 ?Mathematical formulae have been encoded as MathML and are displayed in this HTML version using MathJax in order to improve their display. Uncheck the box to turn MathJax off. This feature requires Javascript. Click on a formula to zoom.
ABSTRACT
Genetic variation in heading dates is essential for developing a rational rice cultivation program, optimizing irrigation practices, and advancing plant breeding in year-round irrigated environments. In this study, we investigated the heading dates of eight rice varieties with varying degrees of photoperiod sensitivity under natural field conditions by conducting year-round periodic sowing in 2019 in Nay Pyi Taw, located in the central region of Myanmar. We elucidated genetic differences in critical day length by observing the longest day length at 30 days before heading, which is likely to be the starting point for floral induction. We analyzed two phenological models: the conventional developmental rate (DVR) model and a modified model considering the critical day length. These analyses aimed to uncover the genetic differences in phenological parameters: temperature sensitivity, photoperiod sensitivity, and earliness among rice varieties. Incorporating the critical day length into the DVR model significantly improved its accuracy in predicting heading dates, particularly for photoperiod-sensitive rice varieties. The parameters derived from the 2019 data proved effective for predicting heading dates in 2018, especially for photoperiod-sensitive varieties. The genetic variation in critical day length and model parameters could be valuable for adapting rice cultivars to different seasons and determining yield and agronomic practices for varietal development programs. These findings contribute to a deeper understanding of rice phenology and the genetic basis for photoperiod sensitivity in Myanmar rice.
GRAPHICAL ABSTRACT

Introduction
Rice production in tropical regions is influenced by a periodic cycle of wet and dry seasons, which is typical of a monsoon climate, with irrigated and rainfed paddy fields being the primary agricultural ecosystem. Myanmar is located between the latitudes of 9°N and 29°N and experiences a tropical monsoon, tropical savanna, or semi-arid (steppe) climate (Beck et al., Citation2018). Myanmar’s rice production, the seventh largest in the world, occurs under a wide range of day lengths and temperature conditions, from the cool northern mountainous highlands to the delta areas around the Ayeyarwady River and the coastal regions in the south.
The Paw San rice varieties are renowned in Myanmar for their texture, fragrant aroma, high milling recovery, elongation during cooking, and premium pricing. However, because of undesirable characteristics, such as low yield and a prolonged growth period influenced by strong photosensitivity, cultivation is limited to once a year (single cropping) during the monsoon season. Given the local demand, export market, and market profitability, farmers are interested in cultivating Paw San varieties twice a year in irrigated areas (Thein, Citation2018). Thus, a breeding program aimed at improving Paw San rice varieties while preserving their original attributes and achieving a higher yield with a shorter growth duration is needed in Myanmar. Information about heading date responses to day length and temperature throughout the year would be invaluable for establishing rational irrigation, dissemination, and breeding programs for major photoperiod-sensitive varieties in irrigated regions. However, limited data exist regarding the days to heading, critical day length, and temperature sensitivity of the predominant varieties in Myanmar.
Plants adapt to seasonal changes and time their flowering by monitoring external and internal cues such as day length (photoperiod), temperature, and developmental age (Brambilla & Fornara, Citation2013). Rice flowering is triggered when the photoperiod is shorter than the critical day length of 9–12 h per day (Summerfield et al., Citation1992). Genetic variation in the critical day length has been observed among accessions of the same species (Shrestha et al., Citation2014). Rice is typically categorized into three growth stages: vegetative, reproductive, and ripening phases. The vegetative phase can be further divided into the basic vegetative phase (BVP) and photoperiod-sensitive phase (PSP) (Vergara & Chang, Citation1985). Rice plants on PSP is sensitive to photoperiod, and PSP is the primary determinant of photoperiod sensitivity in rice cultivars. It is generally measured as the difference between the maximum and minimum growth durations in environments where the day length is shorter than the critical limit (Vergara & Chang, Citation1985). Another significant factor is that high and low temperatures can influence the flowering response of rice (Vergara & Chang, Citation1985). However, estimating the sensitivity of photoperiod and temperature to seasonal changes in the days to heading (DTH) is challenging because these two parameters are intertwined in field experiments.
Mathematical simulations of heading date responses to photoperiod and temperature sensitivity have been incorporated into developmental rate (DVR) models (Gao et al., Citation1992; Horie & Nakagawa, Citation1990; Summerfield et al., Citation1992; Yin et al., Citation1997; Zhang & Tao, Citation2013) using periodic planting experiments (Nakagawa et al., Citation2005). The photoperiod responses of rice cultivars can be assessed at the same location using different planting dates. The DVR model principally functions based on the temperature and photoperiod. Parameter estimations were conducted using nonlinear algorithms such as the SIMPLEX method (Horie & Nakagawa, Citation1990), simulated annealing method (Mavromatis et al., Citation2001), and genetic algorithm (Fukui et al., Citation2015). Parameters related to the phenological response to the environment can be quantified as genetic factors among varieties (Nakagawa et al., Citation2005). However, the phenological parameters of the DVR model for the major varieties of Myanmar throughout the year are not well understood.
In the present study, eight rice cultivars with varying levels of photoperiod sensitivity were planted continuously throughout the year in Nay Pyi Taw, Myanmar. The aim of this study was to understand the genetic variation in heading date and critical day length. In addition, we investigated the phenological responses of these varieties to photoperiod and temperature using a DVR model. This study will aid in the rational planning of irrigation, dissemination, and breeding of new varieties over a year.
Materials and methods
Plant materials
Paw San Hmwe (PSH) is the most prominent of the Paw San variety groups. This group includes Nga Kywe Gyi (NKG), Nga Kywe Taung Pyan (NKTP), and Shwe Bo Paw San (SBPS). Inn Ma Yebaw (IMY) is a rainfed lowland variety favored in the Bago region for its eating quality. Moksoma Kywe Kyay (MSMKK) is an upland variety preferred in eastern mountainous regions. These six Myanmar local quality rice varieties, which have intermediate to strong photoperiod sensitivities, were planted monthly to investigate their photoperiod responses (). Two photoperiod-insensitive varieties, IR24 and Sin Thu Kha (STK), were used as controls.
Table 1. List of plant materials used in this study.
The experiments were conducted at the Seed Bank, Department of Agricultural Research, Yezin, Nay Pyi Taw, Myanmar, from the 2019 dry season to the 2020 dry season (year-round). The experimental station was situated at 19.8367°N and 96.2721°E. The experiments were conducted monthly, resulting in 12 sowing times from February 2019 to January 2020. On the first day of each month, the seeds of each variety were pre-germinated and sown in seedling trays. Seedlings of each variety, approximately 21 days old, were transplanted into five pots (30 × 30 cm), retaining only one plant per pot for heading date evaluation. Approximately 8 kg of loamy soil from the paddy fields was added to the pots, and 20 g of compound fertilizer (15:15:15 N:P:K) was applied to each pot before transplanting. The plants were consistently watered and maintained in a flooded state. Approximately 10 g of urea and potash fertilizer were applied twice: once during active tillering and again during panicle initiation. Insecticides were applied as needed.
Short-day treatment
The number of days required for heading after the day length become shorter than the critical day length was investigated under short-day condition. Plants were placed under black curtains to achieve 8 h of light and 16 h of darkness, starting approximately 50 days after sowing. This short-day treatment persisted until the plants headed. Four varieties (PSH, NKG, NKTP, and IMY) and a separate set comprising two varieties (PSH and IMY) underwent the short-day treatment.
Evaluation of heading date
Plant heading was monitored every two days during the heading period. Heading dates were recorded for five plants of each variety when the first panicle emerged at least 2 cm above the flag-leaf sheath. The DTH, i.e. from sowing to heading, was determined for each variety. The date 30 days before heading (DBH30) was estimated as the date when the plant began floral induction (). The day length at DBH30 is represented as DL30. The longest DL30 among the 12 sowing times was identified as the critical day length.
Figure 1. Definitions of the measures for characterization of heading date in this study. The details are described in the materials and methods section.
Day lengths in Nay Pyi Taw were calculated using the National Oceanic and Atmospheric Administration (NOAA) solar calculator, as described in the Global Monitoring Laboratory of the Early System Research Laboratories of the U.S. Department of Commerce (https://gml.noaa.gov/grad/solcalc/table.php?lat=19.83&lon=96.27&year=2019). Temperature data were obtained from the weather navigation station of the Department of Agricultural Research in 2018 and 2019 (Supplemental ). In 2022, temperature data were obtained using the integrated meteorological observation navigation system FPM-GMX501 (FieldPro, Tokyo, Japan), set up in the Department of Agricultural Research.
Statistical analysis
The average of DTH of the five pots in each month was evaluated to investigate DTH in a month of the twelve sowing times and used in the estimation of critical day length. The sample variance of DTH () over 12 months was calculated for each variety as follows:
Estimation of photoperiod and temperature response using DVR model
We applied the DVR model developed by Nakagawa et al. (Citation2005), which was modified from the three-stage beta model proposed by Yin et al. (Citation1997), to estimate the phenological response of rice varieties. In this model, the progression of developmental stages (DVS) started from sowing (DVS = 0) and progressed to flowering (DVS = 1) by integrating the daily DVR values.
DVR functions as a multiplicative factor for the temperature and photoperiod responses. It is defined as:
where T is the daily mean temperature (°C), and P is the day length (h). G is the number of days required from sowing to heading under optimal conditions. DVS1 and DVS2 represent the ends of BVP and PSP, respectively. The temperature response is expressed as follows:
where Tb, Tc, and To are the base, ceiling, and optimal temperatures, respectively. The values of Tb, To, and Tc were fixed at 8, 30, and 42°C, respectively. Parameter α is the sensitivity of temperature. The response function of the photoperiod g(P) is defined as
where Pb, Pc, and Po represent the base, ceiling, and optimal photoperiods, respectively. Pb, Po, and Pc values were fixed at 0, 10, and 24 h. Parameter (
>0) is the photoperiod-sensitivity coefficient.
In this study, we partly modified g(P) as
where is the critical day length (in hours) estimated by the longest DL30 of each variety.
When was longer than the maximum day length at a given latitude, it was equivalent to that reported by Nakagawa et al. (Citation2005). In both models, DVS1 and DVS2 were defined as DVS1 = 0.145 + 0.005G and DVS2 = 0.345 + 0.005G. Errors in the predicted DVS on the sowing date from 0 and the predicted DVS on the heading date from 1 were calculated. A heuristic algorithm, the genetic algorithm (Scrucca, Citation2013), was used to estimate α, β, and G that minimize the root mean squared error (RMSE). The maximum and minimum values of α and β were set to 0 and 40, respectively. The G parameter varied between 30 and 150.
To establish a modeling pipeline that can be routinely applied to our datasets, we developed an R package named DVIEst, which provides a pipeline for DVI model construction and heading-date prediction based on the constructed model. The current implementation of DVIEst supports the model formulae introduced by Nakagawa et al. (Citation2005) and this study. The source code and detailed description of the package are available at https://github.com/qikushu/DVIEst.
Results
Days to heading
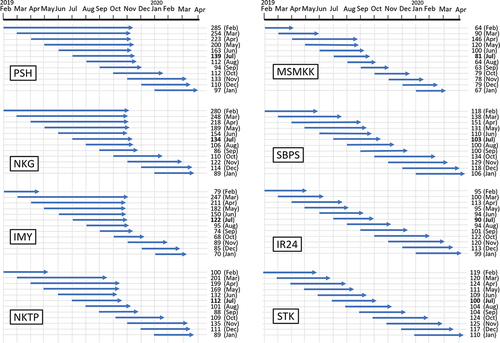
The six major and two check varieties were continuously sown every month to investigate the heading dates of the varieties throughout a year in Nay Pyi Taw (). Historically, farmers in the central area of Myanmar have found the period from late June to mid-July to be the ideal time for sowing monsoon season rice (). Compared with sowing in July, which is the conventional sowing time for monsoon season rice in the Nay Pyi Taw area, sowing from March to June showed extended DTH in the four strongly sensitive varieties (PSH, NKG, IMY, and NKTP). This delay in heading was likely due to the strong photoperiod response to day length. These varieties exhibited wide variations in the differences between their maximum and minimum DTH values, ranging from 113 days in NKTP to 194 days in NKG. Conversely, the photoperiod-insensitive variety STK showed the smallest difference of 25 days, indicating that STK is less likely to respond to seasonal changes in day length. The variance in DTH from the twelve sowing times throughout the year demonstrated that STK had the lowest variances () in DTH (Supplemental Figure 2). The relative variance of each variety compared to STK was assessed using a test of homogeneity of variance (F=
). The F values decreased sequentially among the strongly photoperiod-sensitive varieties PSH, NKG, NKTP, and IMY, the weakly sensitive variety MSMKK, and the insensitive varieties SBPS and IR24, which was likely based on their photoperiod sensitivity.
Figure 2. Heading date and days to heading (DTH) of eight tested varieties sown on different dates throughout the year. The numbers indicate the varieties’ DTH. The months where the shortest DTH was detected are underlined and in bold text.
Necessary days for heading after short-day condition was initiated
The variation in DTH across varieties was likely due to the restriction of heading by the critical day length. To determine whether the number of days required for heading after the day length was shorter than the critical day length, the number of days following the short-day treatment (DAS) was investigated using strongly photoperiod-sensitive varieties (). PSH, NKG, and NKTP exhibited heading at 33 DAS, and IMY exhibited heading at 25 DAS during the dry season from December 2019 to April 2020 (). PSH and IMY exhibited heading at 29 and 28 DAS, respectively, during the monsoon season (). In summary, we estimated that a minimum of 30 days was necessary for the transition from PSP to heading. Subsequently, the date 30 days before heading (DBH30) was considered as the estimated date when the day length was shorter than the critical day length of the variety.
Table 2. Days to heading under short-day treatment during the dry season from December 2019 to April 2020.
Table 3. Days to heading under short-day treatment in the 2020 monsoon season from July to November 2020.
Critical day length
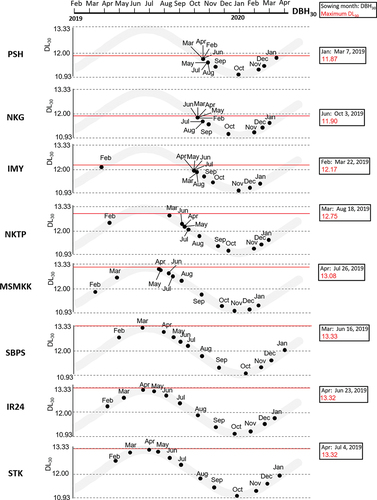
The critical day length of each variety was estimated based on 12 periodic sowings throughout the year (). During 2019 and 2020, the longest and shortest day lengths were 13.33 h during the summer solstice and 10.93 h during the winter solstice in Nay Pyi Taw (). The critical day length (DL) of the variety was determined to be the longest DL30 of the 12 sowing times. For instance, the PSH sown in January headed on April 6. Thus, DBH30 was March 7 and the day length on March 7 was 11.87 h (DL30 = 11.87). The PSH did not head when the DL30 of each sowing time exceeded 11.867 h (). Similarly, the critical day lengths of NKG, IMY, NKTP, MSMKK, SBPS, IR24, and STK in Nay Pyi Taw were 11.90, 12.17, 12.75, 13.08, 13.33, 13.32, and 13.32 h, respectively (, Supplemental Figure 3). For IR24 and STK, the longest DL30 was approximately 13.33 h, matching the longest day length for Nay Pyi Taw. These results indicate that their critical day lengths either exceeded the longest day length at Nay Pyi Taw or that there was no critical day length.
Figure 3. Critical day length of eight tested varieties. The grey curves indicate the day length at Nay Pyi Taw from February 2019 to April 2020. Small dots were plot of the varities sown at each month. The dots are drawn at the date for 30 days before heading (DBH30) in a horizontal axis and day length at date for 30 days before heading (DL30) in a vertical axis. The longest DL30 are defined as the critical day lengths for each variety (red line).
Construction of DVR model
To incorporate the obtained heading characteristics of the major varieties in Myanmar from 12 periodic transplanting sessions throughout the year into a general phenological developmental model, developmental rate (DVR) models were constructed based on day length and temperature in Nay Pyi Taw, Myanmar. In the conventional DVR model (Nakagawa et al., Citation2005, referred to as the NK05 model in this study), the DVR is presumed to be influenced by the f(T) function for temperature sensitivity and the g(P) function for photoperiod sensitivity. Moreover, we developed a critical day length (CDL) model assuming that the DVR becomes zero when g(P) = 0 if the day length exceeds the critical day length Pcritical. The obtained Pcritical values for PSH, NKG, IMY, NKTP, MSMKK, SBPS, IR24, and STK were used to construct the CDL model.
Initially, short-term DVR models were constructed using data from the April-July sowing period, as these months appear to be the optimal season for sowing rice in the summer or during the monsoon season in Myanmar (, , Supplemental Table S2). The predictive accuracy of the DTH in both models was assessed using the adjusted coefficient of determination, R2. R2 was high in the models. The R2 values indicated that the four photoperiod-sensitive varieties (PSH, NKG, IMY, and NKTP) and the weaker-to-insensitive varieties (MSMKK and SBPS) predicted DTH values that closely matched the observed DTH in both the NK05 and CDL models (). However, R2 was lower for the photoperiod-insensitive varieties, IR24 and STK. The critical day lengths correlated with the estimated photoperiod sensitivity parameter β in the NK05 model but not in the CDL model, indicating that β is the primary determinant of the DVR in the NK05 model. Conversely, the estimated G, which represents the earliness of heading, appeared to be a more significant parameter in the CDL model (Supplemental Table S2). The output of the g(P) function in the CDL model was higher than that in the NK05 model when the day length was shorter than the critical length. However, g(P) in the NK05 model exceeded that in the CDL model when the day length exceeded the critical threshold (Supplemental Fig. S4). These characteristics suggest a correlation between β and the critical day length.
Figure 4. DVI models of the April to July sowing times constructed using the NK05 and CDL models. (a,b) regression of the predicted DTH by the observed DTH to show the accuracy of prediction in the eight varieties in the NK05 (a) and CDL (b) models. (c) The adjusted coefficient of the determinant (R2) in each tested variety on the short-term DVI models. (d,e) R2 in each tested variety on the long-term DVI models using data of sowing from February 2019 to January 2020 (d) and data of sowing from February to November 2019. Grey and black bars represent the NK05 and CDL models, respectively.
Table 4. The adjusted coefficient of determinant R2 of the predicted DTH regressed by the observed DTH in four month sowing period throughout a year.
Subsequently, short-term DVR predictions were expanded to other sowing periods spanning four months (Supplemental Table S1). The CDL models were roughly comparable to the NK05 model in terms of R2 values, but offered improved R2 values for the given periods and varieties. The estimated parameters (α, β, and G) for these varieties are suitable for practical DTH prediction throughout the year in Myanmar (Supplemental Table S1). Long-term DVR models capable of making predictions for an entire year were formulated using the data from all 12 sowings (). The R2 values for the photoperiod-sensitive varieties using the NK05 model were relatively low because of the significant delay in the predicted DTH for the December and January sowing periods (Supplemental Figs. S5). Excluding the December and January sowing periods enhanced the prediction accuracy across all tested varieties in the NK05 and CDL models (Supplemental Figs. S6). In the NK05 model, the temperature and photoperiod parameters, α and β, related to the critical day length, but no such relation was observed in the CDL model (Supplemental Table S3).
Prediction of DTH
Finally, DTH was predicted during periodic transplanting from March to November 2018 using variety-specific parameters obtained in 2019 (Supplemental Tables S1 and S2, Supplemental Fig. S7). Both the long-term and short-term DVR models displayed an R2 greater than 0.9 in four strong photoperiod-sensitive varieties (PSH, NKG, IMY, and NKTP) in the CDL model (Supplemental Fig. 7). This indicates that the parameters derived from the 2019 data were effective in predicting the heading dates in 2018. This applicability was particularly notable for photoperiod-sensitive varieties, likely because temperature differences between years played a significant role in the uncertainty of the predictions.
Finaly, we applied prediction of DTH to the plants grown in the field condition. PSH and IMY sown in pots in 2019 were −2.0 and −3.4 days later than the predicted date, respectively. On the other hand, the observed DTH of PSH and IMY sown on 20 July 2022 in the field condition (Supplemental Fig. 8), were 5.83 and 9.03 days later than the predicted date using the parameters estimated in pot condition, respectively. Generally, plants grown in pot showed early heading compared with one grown in the field probably due to limited root space, reduced tiller number, and early transition of reproductive stage. Our variety-specific model parameters were sufficiently accurate to estimate the phenological development of rice varieties for various agricultural applications.
Discussion
Estimation of critical day length by periodical planting
This study examined the heading dates and critical day lengths of major rice varieties in Myanmar to develop a rational cultivation program, irrigation facilities, and plant breeding in irrigated environments by continuous sowing in Nay Pyi Taw, located in the central region of Myanmar. DVR models were constructed to predict heading dates under varying day lengths and temperature conditions in different areas of Myanmar.
We posited that the date 30 days before heading (DBH30) represents the date when the plant initiates floral induction. Among the 12 sowing times, the longest day length at DBH30 was defined as the critical day length (). Our short-day treatment indicated that the average number of days required for heading during the monsoon and dry seasons was 30.5 days (). Photoperiod (day length) only affects the PSP phase (Collinson et al., Citation1992; Mimoto et al., Citation1989). Varieties with strong photoperiod sensitivity did not initiate heading when the day length exceeded the critical day length determined in this study (). This implies that DBH30 serves as a more reliable criterion for estimating the commencement of floral transition and critical day length. The large variation in DTH were found especially in the strong photoperiod-sensitive varieties ( and ). This can be reasonably explained on the basis of the critical day length because day length shifts from short-day to long-day conditions in the Northern Hemisphere with the seasonal change from spring to summer and the varieties sown in February, March, and April contain the critical day length boundaries during their PSP period.
Nonetheless, using the longest day length at DBH30 uniformly across all varieties when determining critical day length could lead to inaccuracies, particularly when estimating the critical day length of photoperiod-insensitive varieties. This is because the PSPs of photoperiod-insensitive varieties are thought to be shorter than those of photoperiod-sensitive varieties (Yoshida, Citation1981). Further investigations are needed to determine the number of days required for heading after the initiation of short-day conditions.
In the present study, the photoperiod sensitivity of the varieties was demonstrated using the actual critical day length in a natural field experiment (). The critical day lengths were observed to range from 11.87 to 12.75 h in photoperiod-sensitive varieties and over 13.08 h in intermediate to photoperiod-insensitive varieties (, Supplemental Figure. S3). The day length between 12.75 and 13.08 h serves as the threshold line for determining strong photoperiod-sensitive and weak-sensitive varieties in Nay Pyi Taw conditions. Conversely, it was impossible to estimate a critical day length that exceeded the maximum day length in Nay Pyi Taw (13.33 h) for the three photoperiod-insensitive varieties (SBPS, IR24, and STK). The critical day length of these varieties may be determined by cultivation under artificial lighting conditions or in regions with longer day lengths during the summer solstice. Alternatively, these varieties may be neutral to the photoperiod because of the absence of a critical day length.
Phenological model
Understanding the heading phenology in rice is fundamental for determining yield and management practices for varietal development (Fukui et al., Citation2015). To better comprehend the phenological parameters of the main varieties in Myanmar, we constructed a conventional DVR model according to Nakagawa et al. (Citation2005) (NK05 model) and a modified NK05 model that included the critical day length (CDL model). In this CDL model, DVR = 0 and g(P) = 0 when the day length exceeded the critical day length.
Improvements in the R2 were found in both short- and long-term DVR by variety (). The patterns of g(P) determined by the photoperiod response values β are key in explaining the cause of improvement, as the only difference between the CDL model and the NK05 model is the g(P) function. Initially, photoperiod response values β showed a strong correlation with the critical day length, having a value of − 0.94 in the NK05 model for the sowing time from April to July (Supplement Table S2). This suggests that the shape of the g(P) function determined by β represents the critical day length in the NK05 (Supplemental Figure S4). Conversely, the β values did not indicate photoperiod sensitivity, as β is not required to cause a sudden drop in the g(P) function around the critical day length. Instead, β appears to have been adjusted to maintain a higher g(P) in the CDL model, compared to g(P) in the NK05 model, on day lengths shorter than the critical day length. This form of g(P) in the CDL model may better illustrate the photoperiod response than the gradual changes observed in the beta function over days longer than the critical day length.
The photoperiod-insensitive varieties SBSP, IR24, and STK exhibited delayed heading under long-day conditions in summer and cold temperatures in winter (). Therefore, they were expected to be influenced by temperature and day length, making their estimation possible using phenological models. The monthly variance of DTH decreased in the order of SBPS, IR24, and STK, suggesting that this order may reflect robustness to temperature and photoperiod changes in the phenological model. Since photoperiod-insensitive varieties are considered to grow under day lengths below the critical threshold throughout the growth period and given the similarity of g(P) in the CDL and NK05 models (Supplemental Figure S4), temperature sensitivity alpha or earliness G are expected to be the primary factors determining the relative days to heading. However, these varieties exhibited low prediction accuracy R2 values in both the NK05 and CDL models, and it was challenging to establish a correlation between the estimated parameters in the order of robustness: SBPS, IR24, and STK. In this study, To, Po, and DVS1 were used as constants. The optimization of these parameters using a genetic algorithm may provide better prediction accuracy in future studies.
Overall, short-term DVR models were considered to provide better predictions, if available. With a more global model, a long-term model may be convenient for coarse estimation using one model per variety.
Conclusions
In this study, we elucidated the variety-specific phenological parameters for critical day length, photoperiod, and temperature responsibility for elite varieties of Myanmar, including the Paw San group varieties, which are well known in Myanmar and other countries. The model parameters developed in this study can be used to predict phenological development and plan crop calendars to adapt to rice varieties in different geographical regions. The critical day length and model parameters will be useful for breeding early maturing (photoperiod-insensitive) varieties of photoperiod-sensitive, good-quality Myanmar rice. Further studies, such as those on the genetic control of photoperiod sensitivity in these varieties, may clarify the photoperiod sensitivity in Myanmar rice varieties.
Authors’ contributions
AY and YY conceptualized and administered the study. MMH, KTW, and OMS conducted experiments in Myanmar. AO collected and analyzed the climate data. MMH, YY, and HY gathered the data and performed statistical analyses. The R script was developed by YY. Acceleration and R package construction for the GitHub repository were performed by TF. The manuscript was initially written by MMH and YY and reviewed by MMH and YY.
Supplemental Material
Download PDF (749.6 KB)Supplemental Material
Download MS Excel (30.4 KB)Disclosure statement
No potential conflict of interest was reported by the authors.
Supplementary material
Supplemental data for this article can be accessed online at https://doi.org/10.1080/1343943X.2024.2308336
Data availability statement
The data used to support the findings of this study have been included in this article.
Additional information
Funding
References
- Beck, H. E., Zimmermann, N. E., McVicar, T. R., Vergopolan, N., Berg, A., & Wood, E. F. (2018). Present and future Köppen-geiger climate classification maps at 1-km resolution. Scientific Data, 5(1), 180214. https://doi.org/10.1038/sdata.2018.214
- Brambilla, V., & Fornara, F. (2013). Molecular control of flowering in response to day length in rice. Journal of Integrative Plant Biology, 55(5), 410–418. https://doi.org/10.1111/jipb.12033
- Collinson, S. T., Ellis, R. H., Summerfield, R. J., & Roberts, E. H. (1992). Durations of the photoperiod-sensitive and photoperiod-insensitive phases of development to flowering in four cultivars of rice (oryza sativa L.). Annals of Botany, 70(4), 339–346. https://doi.org/10.1093/oxfordjournals.aob.a088483
- Fukui, S., Ishigooka, Y., Kuwagata, T., & Hasegawa, T. (2015). A methodology for estimating phenological parameters of rice cultivars utilizing data from common variety trials. Journal of Agricultural Meteorology, 71(2), 77–89. https://doi.org/10.2480/agrmet.D-14-00042
- Gao, L., Jin, Z., Huang, Y., & Zhang, L. (1992). Rice clock model—A computer model to simulate rice development. Agricultural and Forest Meteorology, 60(1–2), 1–16. https://doi.org/10.1016/0168-1923(92)90071-B
- Horie, T., & Nakagawa, H. (1990). Modelling and prediction of development process in rice. I. Structure and method of parameter estimation of a model for simulating development process toward heading. Japanese Journal of Crop Science, 59(4), 687–695. https://doi.org/10.1626/jcs.59.687
- Mavromatis, T., Boote, K., Jones, J., Irmak, A., Shinde, D., & Hoogenboom, G. (2001). Developing genetic coefficients for crop simulation models with data from crop performance trials. Crop Science, 41(1), 40–51. https://doi.org/10.2135/cropsci2001.41140x
- Mimoto, H., Yanase, M., & Chujo, H. (1989). Varietal differences of juvenile phase duration and photoperiodic sensitivity in paddy rice. Japanese Journal of Crop Science, 58(4), 628–634. https://doi.org/10.1626/jcs.58.628
- Nakagawa, H., Yamagishi, J., Miyamoto, N., Motoyama, M., Yano, M., & Nemoto, K. (2005). Flowering response of rice to photoperiod and temperature: A QTL analysis using a phenological model. TAG Theoretical and Applied Genetics, 110(4), 778–786. https://doi.org/10.1007/s00122-004-1905-4
- Scrucca, L. (2013). GA: A package for genetic algorithms in R. Journal of Statistical Software, 53(4), 1–37. https://doi.org/10.18637/jss.v053.i04
- Shrestha, R., Gómez-Ariza, J., Brambilla, V., & Fornara, F. (2014). Molecular control of seasonal flowering in rice, Arabidopsis and temperate cereals. Annals of Botany, 114(7), 1445–1458. https://doi.org/10.1093/aob/mcu032
- Summerfield, R. J., Collinson, S. T., Ellis, R. H., Roberts, E. H., & De Vries, F. W. T. P. (1992). Photothermal responses of flowering in rice (oryza sativa). Annals of Botany, 69(2), 101–112. https://doi.org/10.1093/oxfordjournals.aob.a088314
- Thein, M. S. (2018). Testing photoperiodic sensitivity of paw san rice varieties at different locations. Proceeding of the past, present and future of myanmar paw San Hmwe conference, 23̶, 29.
- Vergara, B. S., & Chang, T. T. (1985). The flowering responses of rice plant to photoperiod. A review of the literature (4th ed.). International Rice Research Institute. http://books.irri.org/9711041510_content.pdf
- Yin, X., Kropff, M. J., Horie, T., Nakagawa, H., Centeno, H. G. S., Zhu, D., & Goudriaan, J. (1997). A model for photothermal responses of flowering in rice I. Model description and parameterization. Field Crops Research, 51(3), 189–200. https://doi.org/10.1016/S0378-4290(96)03456-9
- Yoshida, S. (1981). Fundamentals of rice crop science. International Rice Research Institute. https://doi.org/10.1016/S0378-4290(96)03456-9
- Zhang, S., & Tao, F. (2013). Modeling the response of rice phenology to climate change and variability in different climatic zones: Comparisons of five models. The European Journal of Agronomy, 45, 165–176. https://doi.org/10.1016/j.eja.2012.10.005