
 ?Mathematical formulae have been encoded as MathML and are displayed in this HTML version using MathJax in order to improve their display. Uncheck the box to turn MathJax off. This feature requires Javascript. Click on a formula to zoom.
Abstract
Background
TTR aggregation causes hereditary transthyretin (TTR) polyneuropathy (ATTRv-PN) in individuals with destabilised TTR variants. ATTRv-PN can be treated with ligands that bind TTR and prevent aggregation. One such ligand, tafamidis, is widely approved to treat ATTRv-PN. We explore how TTR stabilisation markers relate to clinical efficacy in 210 ATTRv-PN patients taking tafamidis.
Methods
TTR concentration in patient plasma was measured before and after tafamidis treatment using assays for native or combined native + non-native TTR. TTR tetramer dissociation kinetics, which are slowed by tafamidis binding, were also measured.
Results
Native TTR levels increased by 56.8% while combined native + non-native TTR levels increased by 3.1% after 24 months of tafamidis treatment, implying that non-native TTR decreased. Accordingly, the fraction of native TTR increased from 0.54 to 0.71 with tafamidis administration. Changes in native and non-native TTR levels were uncorrelated with clinical response to tafamidis. TTR tetramer dissociation generally slowed to an extent consistent with ∼40% of TTR being tafamidis-bound. Male non-responders had a lower extent of binding.
Conclusions
Native and non-native TTR concentration changes cannot be used as surrogate measures for therapeutic efficacy. Also, successful tafamidis therapy requires only moderate TTR stabilisation. Male patients may benefit from higher tafamidis doses.
Introduction
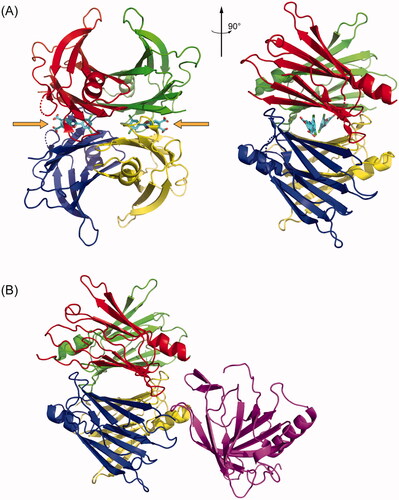
Transthyretin (TTR) is a 127-residue protein that is primarily present in blood plasma, cerebrospinal fluid, and the vitreous humour of the eye [Citation1]. TTR monomers fold into a β-sheet-rich tertiary structure and then self-assemble into native tetramers () [Citation1]. TTR in plasma is primarily synthesised in the liver by hepatocytes [Citation2] and it serves as a secondary carrier of thyroxine [Citation3] and the primary carrier of the retinol-binding protein (RBP):retinol complex () [Citation4]. The thyroxine-binding site is formed by the weaker dimer-dimer interface of the tetramer [Citation1,Citation5], whereas the RBP binding site is on the surface of the tetramer [Citation4].
Figure 1. TTR structures revealing small molecule and protein binding sites. (A) Crystal structure of tetrameric TTR bound to the small molecule kinetic stabiliser tafamidis (PDB ID: 3TCT). Each of the four monomers in the tetramer is coloured differently. The small molecule binding sites, occupied by tafamidis, are indicated with orange arrows. (B) Crystal structure of tetrameric TTR bound to Retinol Binding Protein in purple (PDB ID: 1RLB).
The TTR tetramer is quite kinetically stable [Citation1]. Wild-type TTR (WT TTR) tetramers dissociate with a half-life on the order of 1 day in vitro at 25 °C [Citation6], or 2–3 days ex vivo in blood plasma [Citation6,Citation7], comparable to its rate of turnover (half-life ≈ 2–3 days) in the body [Citation8]. Nevertheless, the dissociation, misfolding, and aggregation of TTR is associated with several diseases known collectively as the transthyretin amyloidoses [Citation1,Citation9,Citation10]. In these diseases, rate-limiting tetramer dissociation [Citation1] produces monomers that misfold and misassemble into aggregates with a spectrum of morphologies, from relatively small (but highly cytotoxic) amorphous oligomers to large cross-β-sheet amyloid fibrils [Citation11–14]. These aggregates, known collectively as ATTR, cause deterioration of exposed post-mitotic tissues, causing, for example, cardiomyopathy when they deposit in the heart [Citation10], and/or polyneuropathy when they deposit in the somatic nervous system [Citation9], and/or a spectrum of gastrointestinal and other symptoms when they deposit in the autonomic nervous system [Citation9,Citation15]. The tissue tropism of the TTR amyloidoses depends on the sequence(s) of TTR inherited. ATTR derived from WT TTR (ATTRwt) primarily deposits in the heart and causes WT TTR cardiomyopathy (ATTRwt-CM); however, polyneuropathy in addition to cardiomyopathy is not uncommon [Citation10]. ATTR derived from one of several variants and WT TTR causes either a hereditary TTR cardiomyopathy (ATTRv-CM) [Citation10] and/or hereditary polyneuropathy (ATTRv-PN), formerly called familial amyloidotic polyneuropathy (FAP) [Citation9]. Upon disease progression, both cardiomyopathy and polyneuropathy exist in variable proportions. The most common variant causing ATTRv-PN has a mutation that substitutes methionine for valine 30 (V30M) and is endemic to parts of Portugal, Sweden, and Japan (ATTRV30M-PN) [Citation16].
Several therapeutic strategies for the ATTR amyloidoses are now available [Citation1,Citation9,Citation17–23]. In one of these, native tetrameric TTR in the plasma is stabilised by using small molecules known as kinetic stabilisers that bind to TTR’s thyroxine binding sites with high affinity and specificity [Citation1,Citation24]. Binding selectively to the native state over the dissociative transition state greatly slows the rate of tetramer dissociation (hence the ‘kinetic stabilisation’ designation) [Citation24], which, as noted above, is the rate-limiting step for TTR aggregation. The small molecule kinetic stabilisers tafamidis [Citation25] and diflunisal [Citation26] were shown to be effective treatments for ATTRv-PN via this mechanism in double-blind, placebo-controlled clinical trials [Citation20,Citation22]. Tafamidis has similarly been shown to be effective for treating both hereditary and WT ATTR-CM [Citation21,Citation23]. The extent to which TTR must be stabilised to observe a clinical response, however, is not known. It is worth noting that amyloid clearance does not measurably occur on the timescale of the tafamidis clinical response in either the polyneuropathy or the cardiomyopathy clinical trials based on heart imaging, suggesting that decreasing circulating non-native TTR may be responsible for reducing morbidity and mortality in these trials [Citation20,Citation23].
A common observation in cases of hereditary TTR amyloidosis is that the plasma levels of TTR are unusually low [Citation27,Citation28]. While the clinical significance of low plasma TTR concentration is not well understood, it does seem to be associated with poor disease prognosis. For example, in a recent analysis of the same ATTR-PN cohort studied here, we reported that the likelihood of responding well to tafamidis was lower for patients with low plasma levels of native TTR than those with closer to normal TTR concentrations [Citation29]. Similarly, while patients with ATTRwt-CM have only marginally lower plasma TTR levels than controls [Citation30], it was recently shown that those with very low plasma TTR levels tend to have worse outcomes than patients with higher plasma TTR levels [Citation30] and that low plasma TTR levels are predictive of future heart failure [Citation31]. These findings suggest that plasma TTR levels could be used as a biomarker for disease progress and/or response to kinetic stabiliser therapy, although it was also recently reported that the extent to which the TTR plasma concentration increases after the initiation of tafamidis treatment was unrelated to the frequency of major adverse cardiovascular events [Citation32]. Clearly, this hypothesis requires further testing.
Herein, we explore how increases in native TTR plasma concentration, decreases in non-native plasma TTR, and the degree of TTR stabilisation correlate with the clinical efficacy of tafamidis meglumine (20 mg q.d.) for treating hereditary ATTR polyneuropathy. We employ plasma samples taken from the cohort of 210 Portuguese ATTRv-PN patients previously studied [Citation29], almost all of whom were heterozygous for the V30M mutation. We use two methods to quantify the plasma TTR concentration in ATTRV30M-PN patients before and after initiating tafamidis therapy. One of these methods utilises a small molecule fluorogenic probe that binds to and then reacts with the two thyroxine binding sites of TTR and therefore exclusively detects natively folded TTR tetramers [Citation29,Citation33]. The other utilises semiquantitative western blots on denaturing SDS-PAGE gels to detect plasma TTR and therefore should equally detect native and non-native TTR. The data reveal that tafamidis treatment substantially decreases non-native TTR levels in blood, while increasing the native TTR tetramer concentration in blood by an average of 57% after two years of treatment. The extent of the native TTR increase and non-native TTR decrease in plasma did not correlate with patient response, possibly because a mechanism beyond proteinopathy becomes the disease driver in the 30% of the patients that are not responsive to tafamidis therapy. Tetramer dissociation is rate limiting for TTR subunit exchange, as folded monomers reassemble into tetramers in the exchange process. To quantify TTR kinetic stability, we measure the subunit exchange rate which equals the tetramer dissociation rate in ex vivo plasma samples. We found that patients that benefitted clinically from tafamidis had on average about 40% of their TTR bound, demonstrating that successful kinetic stabiliser therapy requires only moderate stabilisation, specifically a 40% decrease in TTR tetramer dissociation rate. Male patients that did not respond to tafamidis treatment tended to have low tafamidis concentrations, and therefore less than a 40% decrease in TTR tetramer dissociation rate.
Materials and methods
The data used in this study were either reported previously by Monteiro et al. [Citation29], or obtained by using methods that were previously reported in that paper. We therefore refer readers to that paper for descriptions of the following: study design; study population; patient response classification; acquisition and handling of patient blood plasma handling; recombinant protein expression and purification; the A2-UPLC assay for quantifying native TTR tetramer plasma concentrations; the subunit exchange assay for kinetic stabilisation of TTR in plasma; and quantification of tafamidis plasma concentrations by HPLC. Other methods that are specific to this work are described below.
Measurement of total soluble TTR by the SDS-PAGE/immunoblotting method
Subject and one healthy control plasma sample were thawed; plasma was added to a 1× Laemmli Buffer at a dilution factor of 13.5 and diluted samples were denatured at 100 °C for 10 min. A standard curve was generated using recombinant WT TTR protein diluted in 1× Laemmli Buffer at concentrations of 1 µM, 0.5 µM, 0.25 µM, and 0.125 µM. 15 µL of the denatured subject samples, healthy control, and standard curve were then loaded onto the gel (Invitrogen Bolt 4-12% Bis-Tris Plus precast gels). The gel was run at 200 volts for 30 min and then transferred to a nitrocellulose membrane using a Bio-Rad Transblot Turbo system. The membrane was blocked using Odyssey Blocking Buffer for 30 min and then incubated with the DAKO Polyclonal Rabbit Anti-Human Prealbumin primary antibody (Agilent) at a 1:2000 dilution in Odyssey Blocking Buffer. The membrane was blotted overnight shaking at 4 °C. The next day the membrane was washed three times with TBS + 0.1% Tween-20 (TBST) for 5 min and one time with TBS for 5 min. The secondary antibody used was an IRDye 800CW goat anti-rabbit antibody (LiCor) at a 1:15000 dilution in TBS with 0.5% Tween-20 and blotted for an h. The membrane was then washed three times with TBST for 5 min and one time with TBS for five min. The membrane was imaged using a LiCor Odyssey imaging system. The monomeric TTR band and TTR dimer band were then quantified using Image Studio Lite. TTR concentration in each sample was determined using the standard curve (interpolated values).
Statistics
All graphs were prepared, and statistical tests were performed, in Mathematica 12. We used paired t-tests for comparisons between two groups when they were both normally distributed. If they failed the test for normality, a signed-rank test was used instead. Patients with missing data values were excluded from these tests. Correlations were assessed using the Pearson correlation coefficient. We used one-way ANOVA for assessing the data in and Citation4(B), in which the patient data were separated into six groups: male and female Responders, male and female Partial Responders, and male and female Non-Responders. In all three cases, the ANOVA failed to reach the p = 0.05 significance threshold, so no post-hoc tests were applied. We used a general linear model to analyse the native TTR plasma concentration data at pre-treatment baseline, and after 12 and 24 months of tafamidis treatment ( and )). We also used a general linear model to analyse the total TTR plasma concentration data at pre-treatment baseline, and after 24 months of tafamidis treatment ( and ). The models represented by EquationEquations (1)(1)
(1) and Equation(2)
(2)
(2) were fit to their corresponding datasets using the LinearModelFit function in Mathematica 12. Because there are no interaction terms between the time (T12 and T24) and response (P and R) variables in these two equations, these models embody the situation in which patient response categories do not influence the change in native or total TTR plasma concentration at the 12- and 24-month time points. Such interaction terms do not improve the fit of the models for native or total TTR plasma concentrations; see Supplemental Figures 3 and 4.
Figure 2. Box plots of the plasma concentrations of native, total, and non-native TTR at baseline stratified by response classification—Non-Responders (NR), Partial Responders (PR), and Responders (R)—and patient sex. (A) Concentrations of native TTR measured by the A2-UPLC method. (B) Concentrations of total TTR measured by the SDS-PAGE/IB method. (C) Concentrations of non-native TTR, calculated as the difference between the total TTR and native TTR for patients for whom both measurements are available. (D) Ratio of plasma native to total TTR concentration. In all box plots, the upper and lower fences represent the maximum and minimum values of the data; the top and bottom of the boxes represent the 1st and 3rd quartiles; and the white lines represent the median. The white diamonds are drawn with their centre at the data mean and their upper and lower points span the 95% confidence interval for the mean. Blue hatch marks represent individual data points.
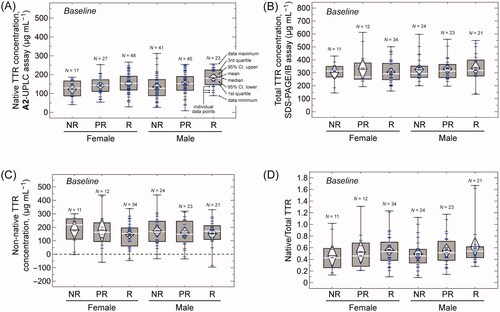
Figure 3. Plasma concentrations, and changes in concentration, of native TTR at 12 and 24 months of tafamidis treatment measured by the A2-UPLC method and stratified by response classification—Non-Responders (NR), Partial Responders (PR), and Responders (R)—and patient sex. (A) Plasma concentrations of native TTR at 12 months. (B) Changes in plasma concentrations of native TTR from baseline to 12 months. (C) Plasma concentrations of native TTR at 24 months. (D) Changes in plasma concentrations of native TTR from baseline to 24 months. (E) Changes in plasma concentrations of native TTR from 12 months to 24 months. (F) A plot of the measured (y-axis) vs. expected (x-axis) plasma native TTR concentrations. Expected concentrations were calculated using the best fit of EquationEquation (1)(1)
(1) , for which r2 = 0.27. The dashed line has a slope of 1 and goes through the origin, for reference. Small, light blue circles represent individual measurements. Larger, dark blue circles represent the averages for each of the 18 sub-groups—2 patient sexes (male, female) × 3 response categories (Non-Responder, Partial Responder, Responder) × 3 sample times (baseline, 12-month, 24-month). That these averages fall very close to the dashed line indicates that, despite the variability in the experimental data, EquationEquation (1)
(1)
(1) represents a good model for the native TTR plasma concentrations. Box plot features are as in .
![Figure 3. Plasma concentrations, and changes in concentration, of native TTR at 12 and 24 months of tafamidis treatment measured by the A2-UPLC method and stratified by response classification—Non-Responders (NR), Partial Responders (PR), and Responders (R)—and patient sex. (A) Plasma concentrations of native TTR at 12 months. (B) Changes in plasma concentrations of native TTR from baseline to 12 months. (C) Plasma concentrations of native TTR at 24 months. (D) Changes in plasma concentrations of native TTR from baseline to 24 months. (E) Changes in plasma concentrations of native TTR from 12 months to 24 months. (F) A plot of the measured (y-axis) vs. expected (x-axis) plasma native TTR concentrations. Expected concentrations were calculated using the best fit of EquationEquation (1)(1) [TTR]nat=c0+cM×M+cP×P+cR×R+c12×T12+c24×T24(1) , for which r2 = 0.27. The dashed line has a slope of 1 and goes through the origin, for reference. Small, light blue circles represent individual measurements. Larger, dark blue circles represent the averages for each of the 18 sub-groups—2 patient sexes (male, female) × 3 response categories (Non-Responder, Partial Responder, Responder) × 3 sample times (baseline, 12-month, 24-month). That these averages fall very close to the dashed line indicates that, despite the variability in the experimental data, EquationEquation (1)(1) [TTR]nat=c0+cM×M+cP×P+cR×R+c12×T12+c24×T24(1) represents a good model for the native TTR plasma concentrations. Box plot features are as in Figure 2.](/cms/asset/548c894e-0719-4857-9653-ddafbbfe3f2e/iamy_a_2126308_f0003_c.jpg)
Figure 4. Plasma concentrations, and changes in concentration, of total and non-native TTR at 24 months of tafamidis treatment measured by the SDS-PAGE/IB method or calculated as the difference between total and native TTR concentrations and stratified by response category—Non-Responders (NR), Partial Responders (PR), and Responders (R)—and patient sex. (A) Plasma concentrations of total TTR at 24 months. (B) Changes in plasma concentrations of total TTR from baseline to 24 months. (C) A plot of the measured (y-axis) vs. expected (x-axis) plasma total TTR concentrations. Expected concentrations were calculated using the best fit of EquationEquation (2)(2)
(2) , for which r2 = 0.03. The dashed line has a slope of 1 and goes through the origin, for reference. Small, light blue circles represent individual measurements. Larger, dark blue circles represent the averages for each of the 18 sub-groups. (D) Plasma concentrations of non-native TTR. (E) Changes in plasma concentrations of non-native TTR from baseline to 24 months. (F) Ratio of native to total TTR plasma concentration after 24 months of tafamidis treatment. Box plot features are as in .
![Figure 4. Plasma concentrations, and changes in concentration, of total and non-native TTR at 24 months of tafamidis treatment measured by the SDS-PAGE/IB method or calculated as the difference between total and native TTR concentrations and stratified by response category—Non-Responders (NR), Partial Responders (PR), and Responders (R)—and patient sex. (A) Plasma concentrations of total TTR at 24 months. (B) Changes in plasma concentrations of total TTR from baseline to 24 months. (C) A plot of the measured (y-axis) vs. expected (x-axis) plasma total TTR concentrations. Expected concentrations were calculated using the best fit of EquationEquation (2)(2) [TTR]tot=γ0+γM×M+γP×P+γR×R+γ24×T24(2) , for which r2 = 0.03. The dashed line has a slope of 1 and goes through the origin, for reference. Small, light blue circles represent individual measurements. Larger, dark blue circles represent the averages for each of the 18 sub-groups. (D) Plasma concentrations of non-native TTR. (E) Changes in plasma concentrations of non-native TTR from baseline to 24 months. (F) Ratio of native to total TTR plasma concentration after 24 months of tafamidis treatment. Box plot features are as in Figure 2.](/cms/asset/8fc22acd-692c-4b91-bde3-2b8a81d0123f/iamy_a_2126308_f0004_c.jpg)
Nonlinear fits to TTR binding data obtained from subunit exchange measurements
We have reported previously how subunit exchange kinetics can be used to calculate the fraction of TTR that is ligand bound, and by extension the dissociation constants for TTR-ligand interactions [Citation7,Citation25,Citation29]. Complete experimental details for measuring tetramer dissociation rate constants using the subunit exchange method are available elsewhere [Citation6,Citation7,Citation29]. We made use of these measured tetramer dissociation rate constants to determine the affinity of tafamidis binding to the mixture of V30M and WT TTR homo- and heterotetramers in ATTRV30M-PN patient plasma as follows. As noted in the Results section, the observed subunit exchange rate constant in the plasma of a ATTRV30M-PN patient who is being treated with tafamidis (kex) divided by the rate of TTR dissociation in that patient’s plasma in the absence of tafamidis (kdiss; measured using the pre-treatment baseline plasma samples) is equal to the fraction of native TTR that is not ligand bound (funbound); in other words, funbound = kex/kdiss. This circumstance arises because only TTR tetramers that do not have bound ligands can dissociate on the timescale of the experiment. These experimentally measured values of funbound can be compared to values of funbound that are calculated by solving the mass balance equations for the species involved in tafamidis binding (TTR, tafamidis, and serum albumin) [Citation7]:
where [TTR]nat and [TTR]nat,free are the overall (ligand bound + unbound) and unbound plasma concentrations of native TTR; [taf]tot and [taf]free are the total and unbound concentrations of tafamidis; [Alb]tot and [Alb]free are the total and unbound concentrations of serum albumin; Kd1 and Kd2 are the dissociation constants for tafamidis binding to the first and second binding sites of TTR tetramers; and Kd,Alb is the dissociation constant for tafamidis binding to albumin. The values of [TTR]nat, [taf]tot, and [Alb]tot were experimentally measured and are provided in Supplementary Table 1. It is known from previous work that Kd,Alb = 1.8 μM [Citation7]. Thus, the values of [TTR]nat,free, [taf]free, and [Alb]free can be calculated for any given values of Kd1 and Kd2 by solving the mass balance equations above (in practice, we obtained these solutions using the FindRoot function in Mathematica 12). The value of funbound that corresponds to these values of Kd1 and Kd2 is then given by funbound = [TTR]nat,free/[TTR]nat.
Table 1. Genetic, clinical, and demographic features of the study population.a
A complete set of funbound values can be calculated for all the samples for which [TTR]nat, [taf]tot, [Alb]tot are known using assumed values of Kd1 and Kd2. These calculated values can then be compared to the corresponding experimentally measured values of funbound. Kd1 and Kd2 are then varied so as to minimise the differences between the calculated and measured values of funbound. This minimisation process was carried out using the NonLinearModelFit function in Mathematica 12.0. This procedure provided a best-fit value for Kd1, but reliable estimates of Kd2 unfortunately could not be obtained in this way because albumin out-competes the second binding site of TTR for tafamidis binding.
Study approval
This study was approved before patient enrolment by the relevant institutional review boards at the Centro Hospitalar do Porto and Scripps Research. All participants provided written informed consent.
Results
Study population and response classification
The inclusion criteria and characteristics of the cohort of 210 Portuguese ATTRv-PN patients have been discussed in detail previously [Citation29]. Briefly, they had to be diagnosed with biopsy-proven ATTRv-PN and had to have been treated with tafamidis for at least 18 months (20 mg tafamidis meglumine taken orally once daily). Their other demographic data and clinical characteristics are summarised in .
A clinical expert in ATTRv-PN on our team (T.C.) previously classified the patients in our cohort as ‘Responders’ if patients experienced essentially complete arrest of all ATTRv-PN symptoms upon starting tafamidis treatment (N = 72 in this group; 49 females, 23 males). Patients were classified as ‘Non-Responders’ if disease progressed substantially despite tafamidis treatment (N = 62; 17 females, 45 males). Patients were classified as ‘Partial Responders’ if their disease progressed slowly or if they experienced improvement in some symptoms (especially autonomic symptoms) but not others (N = 76; 27 females, 49 males) [Citation29].
The total TTR and natively folded TTR plasma concentrations are not equal, suggesting the presence of non-native TTR in ATTRV30M-PN patients
Previously we reported measurements of the plasma concentration of natively folded TTR tetramers in most of our ATTRV30M-PN cohort (201 out of 210 patients) at baseline, i.e. before tafamidis treatment was initiated [Citation29]. To do this, we used an assay in which a small molecule, denoted A2, selectively binds to and then covalently reacts with TTR to form a fluorescent conjugate that can be detected and quantified via ultra-performance liquid chromatography (hereafter referred to as the ‘A2-UPLC method’) [Citation33]. This method specifically detects natively folded TTR tetramers, because only natively folded TTR has the 2 small molecule binding sites that the method requires. Misfolded monomeric, non-native oligomeric or aggregated TTR—collectively referred to as non-native TTR—cannot react with A2 and are thus invisible to the A2-UPLC method. For a subset of patients (N = 53 at baseline, 142 at 24 months), the plasma TTR concentration was also quantified by the Centro Hospitalar do Porto clinical laboratory using a validated immunoturbidimetric assay—hereafter called the ‘clinical lab assay’—as part of routine patient evaluation. The concentrations determined by the clinical lab assay were similar to those determined by the A2-UPLC method except at the lowest concentrations measured by the A2-UPLC method, where the clinical lab assay tended to yield higher concentrations (see Supplemental Table 1 and Supplemental Figure 1A). In addition, plasma TTR concentrations measured by the A2-UPLC method are generally lower than, but correlate with (Pearson r = 0.41), those measured by ELISA using a monoclonal antibody raised against folded TTR for another subset of patients in our cohort (N = 87 at baseline, 85 at 12 months, and 86 at 24 months), which were reported recently [Citation34] (see Supplemental Table 1 and Supplemental Figure 1B). We conclude that the clinical lab assay and folded TTR ELISA, like the A2-UPLC method, mostly detect native TTR and therefore that TTR plasma concentrations measured by the A2-UPLC method can be compared, at least qualitatively, to concentrations measured using the antibody-based methods in the literature. However, there is less ambiguity in the species detected by the A2-UPLC method, so we prefer it for measuring the concentration of native TTR tetramers.
The plasma concentrations of native TTR at baseline are shown in stratified by response category and sex. As we reported previously [Citation29], patients categorised as Responders to tafamidis treatment have the highest native TTR plasma concentrations for both male and female patients, followed by Partial Responders, while Non-Responders have the lowest native TTR concentrations. We also find that males tend to have higher native TTR concentrations than females, consistent with literature data [Citation35]. The unbalanced nature of our dataset (e.g. most Responders being female, while most Non-Responders are male; ) leads to a confounding of the effects of patient sex and response category on plasma native TTR concentration when analysed via, for example, two-way ANOVA. We therefore defer a quantitative discussion of the effect of these factors on plasma native TTR concentration to a later section, where we analyse the dataset as a whole by using a general linear model.
We also determined the baseline TTR plasma concentration for 125 out of 210 of this cohort using a denaturing SDS-PAGE method followed by immunoblotting with a commercially available polyclonal anti-TTR antibody (hereafter called the SDS-PAGE/IB method). This method detects both native and non-native TTR species, including oligomers and aggregates amenable to SDS denaturation. We will therefore refer to this method as measuring ‘total’ TTR. We used recombinant WT TTR to create a standard curve for quantification (for details see Methods section). The patients in our cohort, however, are expected to have both V30M and wild type TTR subunits in their TTR tetramers. We therefore tested the antibody’s ability to detect recombinant V30M TTR and we found that the signal obtained with equal concentrations of V30M TTR is ∼ 40% of the signal obtained with WT TTR alone (Supplemental Figure 2). This suggests that the SDS-PAGE/IB method could underestimate the absolute amount of plasma total TTR in these patients, although measurements of the relative amounts between patient groups or between the same patients at different times should be reliable. Furthermore, the SDS-PAGE/IB method is not as precise as the A2-UPLC method used to measure tetrameric TTR (coefficient of variability ≤ 15% for the technical replicates in only about one-third of the total samples analysed by the SDS-PAGE/IB method versus ≤ 15% for the technical replicates in all samples analysed by the A2-UPLC method). Nevertheless, because of the large number of patients in our cohort, the standard errors of the mean values of the total TTR plasma concentrations averaged across each patient subgroup are on the order of ±10% of the mean and the corresponding 95% confidence intervals are approximately ±20% of the mean (see ).
The baseline plasma concentrations of total TTR measured by the SDS-PAGE/IB method are shown in for the cohort as a whole and stratified by response classification and patient sex. The total TTR concentration is higher than the native TTR concentration by an average of 160.7 ± 9.4 µg mL−1 (mean ± standard error) for the 125 patients for whom both were measured (signed-rank test, Z = 111.8, p ≪ .001). This difference corresponds to the concentration of non-native TTR in the plasma, which is shown stratified by patient sex and response category in . The variability in the data in obscures relationships between the measured amounts of non-native TTR and patient characteristics, but it is clear from comparing that the plasma concentrations of native and non-native TTR are comparable. This result that half of the circulating TTR before treatment is non-native is consistent with previous findings showing that there is a substantial amount of non-native TTR circulating in ATTRV30M-PN patients [Citation14,Citation34]. In fact, the ratio of native:total TTR is on average 0.54 ± 0.03 (mean ± standard error, N = 125), ranging from a low of 0.46 ± 0.09 (mean ± standard error, N = 11) for female Non-Responders to a high of 0.62 ± 0.08 (mean ± standard error, N = 21) for male Responders ().
The plasma concentration of natively folded TTR increases upon initiation of tafamidis treatment to an extent that does not depend on patient response category
Plasma concentrations of native TTR were measured after 12 months of tafamidis treatment for 199 of the 210 patients in our cohort using the A2-UPLC assay (). These concentrations within patient sub-groups have the same pattern as they did at baseline: they are higher for men than for women and tend to increase in the order Non-Responders < Partial Responders < Responders. In addition, the native TTR plasma concentrations are considerably higher after 12 months of tafamidis treatment than they were at baseline, as has been observed after treatment with other kinetic stabilisers [Citation30,Citation36] and tafamidis [Citation32,Citation37]. For the 199 patients for whom measurements of the plasma concentration of native TTR are available both at baseline and after 12 months of tafamidis treatment, the overall average increase is 64.8 ± 5.4 µg mL−1 (mean ± standard error; paired t-test: t = 12.1, p ≪ 0.001). Importantly, though, this increase does not vary in a statistically significant way from sub-group to sub-group (; one-way ANOVA: F = 0.23, p = 0.95). This observation suggests that the increase in plasma native TTR concentration is not predictive of response to kinetic stabiliser therapy in ATTRV30M-PN.
Similar results are found after 24 months of tafamidis treatment (). Native TTR plasma concentrations are again greater for males than for females and increase in the order Non-Responders < Partial Responders < Responders. The plasma TTR concentrations are higher at 24 months than at baseline (by 84.4 ± 5.4 µg mL−1, mean ± standard error, N = 200; paired t-test: t = 15.7, p ≪ 0.001), but again the increase does not vary significantly from sub-group to sub-group (; one-way ANOVA: F = 0.88, p = 0.50). Notably, the increase in plasma TTR concentration is even greater after 24 months of tafamidis treatment than after 12 months. The average increase in the second 12-month period is 19.5 ± 5.8 µg mL−1 (mean ± standard error, N = 198; paired t-test: t = 3.3, p = 0.001).
We used a linear model to better understand how patient sex, response category, and duration of tafamidis treatment affect native TTR plasma concentrations in our cohort. The model has the form shown below:
(1)
(1)
where [TTR]nat is the plasma concentration of native TTR in µg mL−1; c0 is the constant of regression; M is a categorical variable that represents patient sex (M = 0 for female, 1 for male); P and R are categorical variables that together indicate whether a patient is a Non-Responder (P = 0, R = 0), a Partial Responder (P = 1, R = 0), or a Responder (P = 0, R = 1); and T12 and T24 are categorical variables that together indicate whether the plasma concentration in question is from the baseline (T12 = 0, T24 = 0), the 12-month (T12 = 1, T24 = 0), or the 24-month time point (T12 = 0, T24 = 1). The coefficients that multiply each variable measure that variable’s effect on the native TTR plasma concentration.
The fit of our model to the native TTR plasma concentration data from the 198 patients for whom measurements were available at all three time points is good, considering the expected patient-to-patient variability and the error inherent in measuring protein concentrations in complex biological fluids. Although the coefficient of determination was just r2 = 0.27, the model fits extremely well to the average native TTR concentrations for the 18 patient subgroups as shown in (18 subgroups = 2 patient sexes (male, female) × 3 response categories (Non-Responder, Partial Responder, Responder) × 3 sample times (baseline, 12-month, 24-month)). The best fit values for the coefficients are as follows: c0 = 117.1 ± 7.4 µg mL−1 (p ≪ 0.001); cM = 22.1 ± 5.7 µg mL−1 (p ≪ 0.001); cP = 19.0 ± 6.6 µg mL−1 (p = 0.004); cR = 36.5 ± 7.0 µg mL−1 (p ≪ 0.001); c12 = 64.9 ± 6.5 µg mL−1 (p ≪ 0.001); and c24 = 84.4 ± 6.5 µg mL−1 (p ≪ 0.001). The values of the coefficients indicate how much the native TTR plasma concentration differs on average for patients in a given subgroup relative to an arbitrarily chosen ‘reference state’ for that category that otherwise has the same characteristics (the reference state for patient sex is female; for response category it is Non-Responders, and for time since initiation of tafamidis therapy it is pre-treatment baseline). For example, since cM = 22.1 µg mL−1, male patients on average have a plasma concentration of native TTR that is 22.1 µg mL−1 higher than female patients in the same response category and at the same treatment time point. Similarly, since cR = 36.5 µg mL−1, patients that are Responders to tafamidis treatment have a native TTR plasma concentration that is on average 36.5 µg mL−1 higher than Non-Responders of the same sex and at the same treatment time point. The other coefficients can be interpreted similarly.
It is important to note that the model embodied in EquationEquation (1)(1)
(1) does not account for interactions among its variables (patient sex, response category, and time since the initiation of tafamidis therapy); the contribution of each factor is considered to be independent of all the others. Moreover, a more complicated model that accounts for the possibility that the increase in native TTR plasma concentration is different among the response categories does not produce a perceptible improvement in the fit to the data, yielding approximately the same coefficient of determination (r2 = 0.27) as the simpler model represented by EquationEquation (1)
(1)
(1) (Supplemental Figure 3). These results are consistent with the results from the one-way ANOVAs based on the data in and strongly support our assertion that the extent to which native TTR plasma concentrations increases upon tafamidis treatment does not predict response to therapy.
The total TTR plasma concentration changes very little, if at all, in response to tafamidis treatment
The total TTR plasma concentration was measured by the SDS-PAGE/IB method 24 months after initiation of tafamidis therapy for 105 out of the 125 patients for which it was measured at baseline. These concentrations are shown in stratified by response classification and sex, while the changes in total TTR plasma concentrations are shown in . As with the native TTR plasma concentrations, the changes in the total TTR plasma concentration from baseline to the 24-month time point did not differ significantly among the sub-groups (one-way ANOVA, F = 1.15, p = 0.34; ). To explore further how patient sex, response category, and tafamidis treatment affect the total TTR plasma concentration, we again used a linear model represented by the equation below:
(2)
(2)
where [TTR]tot is the plasma concentration of total TTR in µg mL−1; γ0 is the constant of regression and the independent variables M, P, R, and T24 are as in EquationEquation (1)
(1)
(1) (T12 is absent because total TTR measurements were not made for the 12-month time point). Again, the coefficients that multiply each variable measure that variable’s effect on the total TTR plasma concentration.
The fit of our model to the total TTR plasma concentration data from the 105 patients for whom measurements were available at both baseline and the 24-month time point is poor, with a coefficient of determination of r2 = 0.03 (). The best fit values for the coefficients are as follows: γ0 = 306.5 ± 17.1 µg mL−1 (p ≪ 0.001); γM = 19.5 ± 13.9 µg mL−1 (p = 0.16); γp = 32.2 ± 17.4 µg mL−1 (p = 0.07); γR = 22.9 ± 16.5 µg mL−1 (p = 0.17); and γ24 = 10.6 ± 13.1 µg mL−1 (p = 0.42). Apart from the constant of regression γ0, none of the coefficients in the model is significantly different from 0 at a threshold of p < 0.05. Nevertheless, it is noteworthy that while the best-fit values of γM, γP, and γR have values roughly comparable to the corresponding coefficients cM, cP, and cR for the fit of EquationEquation (1)(1)
(1) to native TTR plasma concentrations, the best fit value of γ24 is clearly smaller than its corresponding coefficient, c24: compare γ24 = 10.6 ± 13.1 µg mL−1 to c24 = 84.4 ± 6.5 µg mL−1. This result indicates that the total TTR plasma concentration increases barely, if at all, after 24 months of tafamidis treatment while the native TTR plasma concentration increases substantially (84.4 μg mL−1). Thus, tafamidis substantially decreases the amount of non-native TTR in the plasma (by ≈ 74 μg mL−1), consistent with findings in ATTRV30M-PN patients using techniques that directly detect non-native TTR [Citation14,Citation34]. As with the native TTR plasma concentrations, a model that accounts for a dependence of the change in total TTR plasma concentrations on patient response category does not substantially improve the fit to the data (r2 = 0.04), nor does it result in any coefficients that reach the p < 0.05 significance level; see Supplemental Figure 4.
The decrease in non-native TTR plasma concentration after tafamidis therapy is also apparent from comparing the plasma concentration of non-native TTR at the 24-month time point () to baseline (). After 24 months of tafamidis treatment, the overall mean plasma concentration of non-native TTR for the 105 patients for whom it was measured was 110.3 ± 9.8 µg mL−1 (mean ± standard error). This concentration is lower by ≈ 50 µg mL−1 than the baseline concentration of non-native TTR measured in 125 patients (160.7 ± 9.4 µg mL−1). This decrease is smaller than the ≈ 74 µg mL−1 decrease noted above. This discrepancy is due to the 20 patients for whom total TTR plasma concentrations were measured at baseline but not at 24 months. For the 105 patients for whom total TTR plasma concentrations were measured at both baseline and the 24-month time point, the non-native TTR plasma concentration decreased by 69.9 ± 11.1 µg mL−1 (mean ± standard error, signed-rank test, Z = 83.8, p ≪ 0.001; see ), much closer to the value of 74 µg mL−1 derived from the models. In terms of the ratio of native:total TTR, this ratio was 0.71 ± 0.02 overall after 24 months of tafamidis treatment (mean ± standard error, N = 105), ranging from a low of 0.66 ± 0.05 (mean ± standard error, N = 27) for female Responders to a high of 0.75 ± 0.06 (mean ± standard error, N = 22) for male Responders (). For the 105 patients for whom native and total TTR were measured at both baseline and the 24-month time point, the average increase in the native:total TTR ratio was 0.23 ± 0.03 (mean ± SE; signed-rank test, Z = 742, p ≪ 0.001).
Moderate stabilisation of TTR by tafamidis leads to clinical efficacy
TTR stabilisation in our cohort of ATTRV30M-PN patients is expected to be a function of tafamidis plasma concentration. This concentration was measured after 12 and 24 months of treatment by methods described previously [Citation29]. These data are shown in . As we recently reported, the tafamidis concentration at the 12-month time point in male patients is higher in Responders and Partial Responders than Non-Responders [Citation29]. In female patients, the tafamidis concentration does not vary significantly by response category. These results are apparent in . shows a similar outcome at the 24-month time point. The tafamidis concentrations after 12 and 24 months of treatment for the 207 patients for whom measurements were made at both time points are not significantly different from each other (mean change at 24 months–12 months = −0.27 ± 0.21 µM, paired t-test, t = −1.27, p = 0.21) and they correlate moderately well with each other (Pearson r = 0.67; Supplemental Figure 5), as we have noted previously [Citation29]. This correlation is remarkable given that the time that elapsed between a patient taking their daily dose of tafamidis and having their blood drawn was not controlled. This suggests that the tafamidis plasma concentration is quite stable both between doses and over the course of years, consistent with observations from studies of tafamidis pharmacokinetics [Citation38]. In some cases, the measured concentration of tafamidis was very low. Of the 207 patients for whom the tafamidis plasma concentration was measured at both the 12- and 24-month time points, 19 had at least one measurement that was lower than 3 µM (Supplemental Table 1). It is worth noting, however, that these measurements have a strong tendency to ‘regress to the mean’; in other words, if the measured tafamidis concentration was especially low at one of the time points, it was almost always higher at the other time point (Supplemental Figure 5). This observation suggests that the lowest measured tafamidis plasma concentrations are the result of the inherent variability of the samples and/or the assay. Nevertheless, it is clear that some patients have lower tafamidis plasma concentrations than others. We discuss how this could affect treatment outcomes below.
Figure 5. Tafamidis plasma concentrations stratified by response classification and patient sex and the effect of tafamidis on TTR stability. (A) Box plot of tafamidis plasma concentrations 12 months after initiation of therapy. (B) Box plot of tafamidis plasma concentrations 24 months after initiation of therapy. (C) A plot of funbound – where funbound is the ratio of TTR subunit exchange rate in each patient after 12 or 24 months of tafamidis treatment (kex) to that at baseline (kdiss)—vs. plasma tafamidis concentration at the 12- or 24-month time point (N = 388). The solid curve represents the best fit of a model for tafamidis binding to TTR in patient plasma in the presence of albumin, which competes with TTR for tafamidis binding. This curve was calculated using Kd1 = 25.8 ± 1.4 nM, the best-fit value of the dissociation constant for a single tafamidis molecule binding to TTR; Kd,Alb = 1.8 µM, the previously determined dissociation constant for tafamidis binding to albumin [Citation7]; and the overall post-treatment mean plasma concentrations of native TTR (223 µg mL−1, or 4.05 μM tetramer) and albumin (45 g L−1, or 680 μM) across all patients at the 12- and 24-month time points. (D) Calculated values of funbound (= 1 – fbound) for TTR in the plasma of tafamidis-treated ATTRV30M-PN patients based on the best fit value of Kd1, the known value of Kd,Alb, and the measured tafamidis, native TTR, and albumin concentrations in each patient’s plasma. Small, light blue and orange circles represent the values for individual patients at the 12- and 24-month time points, respectively. Larger, darker blue and orange circles represent the mean values for the patient subgroups at the 12- and 24-month time points, respectively. Error bars represent the standard error of the mean. Box plot features are as in .
![Figure 5. Tafamidis plasma concentrations stratified by response classification and patient sex and the effect of tafamidis on TTR stability. (A) Box plot of tafamidis plasma concentrations 12 months after initiation of therapy. (B) Box plot of tafamidis plasma concentrations 24 months after initiation of therapy. (C) A plot of funbound – where funbound is the ratio of TTR subunit exchange rate in each patient after 12 or 24 months of tafamidis treatment (kex) to that at baseline (kdiss)—vs. plasma tafamidis concentration at the 12- or 24-month time point (N = 388). The solid curve represents the best fit of a model for tafamidis binding to TTR in patient plasma in the presence of albumin, which competes with TTR for tafamidis binding. This curve was calculated using Kd1 = 25.8 ± 1.4 nM, the best-fit value of the dissociation constant for a single tafamidis molecule binding to TTR; Kd,Alb = 1.8 µM, the previously determined dissociation constant for tafamidis binding to albumin [Citation7]; and the overall post-treatment mean plasma concentrations of native TTR (223 µg mL−1, or 4.05 μM tetramer) and albumin (45 g L−1, or 680 μM) across all patients at the 12- and 24-month time points. (D) Calculated values of funbound (= 1 – fbound) for TTR in the plasma of tafamidis-treated ATTRV30M-PN patients based on the best fit value of Kd1, the known value of Kd,Alb, and the measured tafamidis, native TTR, and albumin concentrations in each patient’s plasma. Small, light blue and orange circles represent the values for individual patients at the 12- and 24-month time points, respectively. Larger, darker blue and orange circles represent the mean values for the patient subgroups at the 12- and 24-month time points, respectively. Error bars represent the standard error of the mean. Box plot features are as in Figure 2.](/cms/asset/08a8a303-9ce4-4fa3-ae51-d04b426cf334/iamy_a_2126308_f0005_c.jpg)
We showed previously that tafamidis stabilises plasma TTR in this cohort of ATTRV30M-PN patients in a concentration-dependent manner [Citation29] by using a subunit exchange assay. In this assay [Citation6,Citation29], a FLAG-tagged TTR tetramer is added to a sample of untagged TTR in ATTRV30M-PN plasma. As the tagged and untagged TTR tetramers dissociate, their folded monomeric subunits randomly mix when they reassemble, creating heterotetramers of all possible stoichiometries (untagged:tagged ratios of 3:1, 2:2, and 1:3) along with the two homotetramers that were initially present (untagged:tagged ratios of 4:0 and 0:4). The concentrations of homo- and heterotetramers can be measured as a function of the exchange period by ion exchange chromatography [Citation6]. The TTR tetramers are quantified without interference from the plasma proteome using the A2-UPLC method [Citation6]. The sample approaches an equilibrium distribution of homo- and heterotetramers with monoexponential kinetics at a rate that is dictated largely by the rate of tetramer dissociation, which is the rate-limiting step for subunit exchange. Assuming that the untagged and tagged TTR subunits form isoenergetic tetramers, the final relative concentrations of homo- and heterotetramers follow a binomial distribution (ratios of 1:4:6:4:1 for the untagged:tagged stoichiometries of 4:0, 3:1, 2:2, 1:3 and 0:4).
Small molecule binding to one of TTR’s ligand binding sites is sufficient to prevent tetramer dissociation [Citation39]. Thus, in samples containing TTR ligands the effective rate constant for TTR subunit exchange is kex = funbound × kdiss, where funbound is the fraction of TTR tetramers that have no ligand bound and kdiss is the rate constant for TTR tetramer dissociation in the absence of ligand [Citation7]. We have shown previously that the subunit exchange rate decreases as patients’ plasma concentrations of tafamidis increases in these patients at the 12-month time point [Citation29]. We present these data again in a different format along with the data from the 24-month time point in , in which funbound (where funbound = kex/kdiss) is plotted vs. tafamidis concentration. These data quantify target engagement by tafamidis in ATTRV30M-PN patients, although we note that the observed funbound slightly overestimates the true funbound for the TTR in patient plasma because the added FLAG-tagged TTR competes with the patient’s TTR for tafamidis binding. These data can be used to estimate the affinity of tafamidis for the array of WT/V30M homo- and heterotetramers present in ATTRV30M-PN patients by fitting a model for tafamidis binding to TTR in the presence of serum albumin, which competes with TTR for tafamidis binding, as we have described recently [Citation7]. In this nonlinear regression, we fixed the value of the dissociation constant for tafamidis binding to albumin, Kd,Alb, at 1.8 µM, which we determined previously [Citation7]. The best fit of the model to the funbound data was obtained with Kd1 = 25.8 ± 1.4 nM. The curve representing this fit calculated using the mean concentrations of TTR and albumin in the samples is shown in blue in . The coefficient of determination for the fit was r2 = 0.28, which is acceptable given the errors inherent in measuring the independent variables (tafamidis, TTR, and albumin concentrations) and the dependent variables (changes in subunit exchange rate constants) in biological samples. It should be noted that this estimate of Kd1 is somewhat higher than has been reported for wild-type TTR, for which Kd1 ∼ 3 nM [Citation25], but we note that thyroxine has also been found to have lower affinity for V30M TTR than wild type TTR [Citation40]. It should also be kept in mind that this value of Kd1 represents, in a way, a weighted average of the dissociation constants of the different homo- and heterotetramers present in these WT/V30M TTR heterozygotes. Unfortunately, Kd2 could not be determined accurately since albumin apparently outcompetes the second TTR binding site for tafamidis [Citation7].
The fraction of TTR that is unbound in patient plasma in the true physiological setting (that is, in the absence of added FLAG-tagged probe TTR) can now be calculated using the value of Kd1 determined above along with the known value of Kd,Alb and the measured TTR, tafamidis, and albumin concentrations. The relative values of funbound among the various patient sub-groups at 12 and 24 months vary as one would expect based on their tafamidis concentrations (): they are similar among the female sub-groups (the averages of which range from funbound ∼ 0.59 to 0.61 at 12 months and from 0.63 to 0.64 at 24 months), but are lower for male Responders and Partial Responders (funbound ∼ 0.58 to 0.62 at 12 months and 0.61 to 0.62 at 24 months) than for Non-Responders (0.68 at 12 months and 0.71 at 24 months). This observation is consistent with the relatively low plasma tafamidis concentrations observed in male Non-Responders (). Interestingly, these results imply that the fraction of TTR that is ligand bound in these ATTRV30M-PN patients, or fbound where fbound = 1 – funbound, only needs to be on the order of 0.4 to yield substantial clinical benefit in the Responders and Partial Responders [Citation29], but lower values of fbound in male patients appear to be associated with a lack of response. A 0.4 fraction of tafamidis bound corresponds to a TTR tetramer dissociation rate decrease of 40%. In this connection, it is perhaps worth noting that tafamidis is currently prescribed at a higher dose for ATTR cardiomyopathy than for polyneuropathy. The cardiomyopathy dose is 61 mg of tafamidis free acid once daily, which is bioequivalent to 80 mg of the tafamidis meglumine formulation [Citation38], a four-fold higher dose than was taken by the ATTRV30M-PN patients in this study. This 61 mg free acid dose has been shown to result in average tafamidis plasma concentrations of 23.6 μM. Based on our modelling above, we calculate that fbound at this plasma concentration of tafamidis in ATTRV30M-PN patients would be 0.69 (funbound = 0.31; corresponding to a TTR tetramer dissociation rate decrease of 69%), well above the level of 0.4 established above to be required for clinical efficacy.
Discussion
Study limitations
The cohort of ATTR-PN patients studied herein are virtually all heterozygous for the V30M TTR variant and have an early and narrow distribution of ages of onset (median age of onset = 34.1 years old; see ). While this kind of uniformity is beneficial in many ways for a study like ours, it does not reflect the diversity of the global ATTR-PN patient population. For example, the amyloid fibrils in early-onset ATTRV30M-PN patients are generally composed of full-length TTR, whereas the fibrils in ATTR-PN and -CM patients with WT TTR or other TTR variants are composed of TTR fragments [Citation11] (there is some evidence that these cleavages may occur post fibril formation [Citation13]). Thus, it should be borne in mind that our results may not extend to other populations of ATTR patients. However, it is worth noting that our cohort does represent one of the largest concentrations of ATTR-PN patients in the world [Citation16]. Moreover, consistent with our results, Saith et al. also found that the increase in the plasma concentration of TTR did not correlate with treatment outcome in ATTR-CM patients [Citation32]. Finally, the efficacy of tafamidis treatment appears to be similar for V30M and non-V30M ATTRv-PN patients [Citation41].
Tafamidis treatment increases the plasma concentration of native, but not total, TTR
It has long been known that the plasma TTR concentration tends to be below the reference range for patients with familial TTR amyloidosis, as measured using antibody-based methods that preferentially detect native TTR tetramers, as we showed above [Citation27,Citation28]. Our measurements of the baseline native TTR plasma concentration are consistent with these findings, but we show additionally that the total concentration of TTR in plasma—as detected by the SDS-PAGE/IB method that includes a denaturing step to ensure detection of both native and non-native states of TTR (monomers, oligomers, or larger aggregates)—is significantly higher than the concentration of native TTR. These data indicate that half of the circulating TTR before treatment is non-native in our cohort of ATTRV30M-PN patients, consistent with recent results using methods that specifically detect non-native states of TTR [Citation14,Citation34]. Such high concentrations of non-native TTR are indicative of an imbalance between TTR misfolding and the clearance of non-native TTR in these patients, which allows these species to accumulate and drive neurodegeneration.
Our results show that the native plasma TTR concentration increases very substantially after 12 months of tafamidis treatment. Across all sub-groups, the increase is by 64.8 µg mL−1, from an average over all subgroups of 148.7 µg mL−1 to 213.4 µg mL−1, or 43.5%. The concentration continues to increase with tafamidis treatment, reaching an average of 233.3 µg mL−1 at the 24-month time point, a 56.8% increase. As noted above, such increases in TTR concentration have also been observed upon treatment with other TTR kinetic stabilisers as well as tafamidis, again using antibody-based methods that largely detect native TTR [Citation30,Citation32,Citation36,Citation37].
Our measured concentration of total TTR, in contrast, increases only very slightly after 24 months of tafamidis treatment from an average of 337.0 µg mL−1 to 347.6 µg mL−1, and the increase is not statistically significant, as shown by the value of the parameter γ24 from the fit of EquationEquation (2)(2)
(2) to the total plasma TTR data. This result indicates that tafamidis treatment does not increase the concentration of TTR in general; instead tafamidis selectively increases the concentration of properly folded and assembled native TTR with a concomitant decrease in the concentration of non-native TTR. This finding is consistent with recent reports that show that the concentration of non-native TTR significantly decreases upon tafamidis treatment [Citation14,Citation34].
These results suggest that tafamidis does not raise the concentration of native TTR principally by decreasing its rate of catabolism and turnover, since such a mechanism would almost certainly raise the total concentration of TTR as well as the concentration of native TTR. It is much more likely that tafamidis raises the concentration of native TTR at the expense of non-native TTR by reducing misfolding and degradation of newly synthesised TTR during secretion from hepatocytes [Citation42]. Previous cellular studies demonstrate that molecules like and including tafamidis, that bind to and stabilise TTR tetramers comprised of destabilising mutant subunits within the endoplasmic reticulum, increase the fraction of native TTR secreted from cells by a so-called ‘pharmacological chaperoning’ mechanism [Citation42]. Tafamidis-mediated pharmacological chaperoning decreases the fraction of newly synthesised TTR that misfolds and is degraded within the cell by cellular processes including endoplasmic reticulum-associated degradation [Citation42]. Collectively, these findings support the general strategy of using small molecule ligands to ‘pharmacologically chaperone’ misfolding-prone proteins that are associated with loss- or gain-of-function diseases to improve their ability to attain the native state [Citation43]. While intracellular pharmacological chaperoning of TTR undoubtedly occurs by tafamidis, we hypothesise that the clinical benefit of tafamidis largely arises from the ability of tafamidis to bind to maintain the native conformation of tetrameric TTR in the extracellular space.
The magnitude of the increase in native TTR plasma concentration does not correlate with clinical benefit
As we noted above, low plasma native TTR concentration seems to be an indicator of a poor prognosis in ATTRwt-CM [Citation30] and poor response to therapy in ATTRV30M-PN [Citation29]. These and other observations have led to speculation that increases in TTR concentration could be a biomarker for the therapeutic success of kinetic stabilisers, with larger increases in plasma TTR concentration indicating superior efficacy [Citation36,Citation44]. However, our results clearly show that the extent of the increase in native TTR plasma concentration at the 12- and 24-month time points relative to baseline does not differ in a statistically significant manner among the patient sub-groups; it is essentially the same for Non-Responders as for Responders. This finding is consistent with recently reported results in ATTR-CM patients [Citation32]. Thus, changes in plasma native TTR concentration likely cannot be used as a surrogate measure for therapeutic efficacy, despite being an indication of TTR binding by kinetic stabilisers (i.e., a target engagement biomarker). The decrease in non-native TTR levels upon tafamidis treatment does not correlate with responder status either. Target engagement by kinetic stabilisers reflected by increases in native TTR and decreases in non-native TTR is apparently a necessary, but not a sufficient, condition for therapeutic efficacy. We hypothesise that a determining factor for a therapeutic response may be the rate of non-native TTR clearance at the start of tafamidis therapy which could keep a secondary pathology like neuroinflammation from becoming the driver of ATTRV30M-PN [Citation45,Citation46], consistent with the observation that initiation of therapy early in ATTRV30M-PN progress is important, before the non-native TTR levels get too high [Citation20].
The clinical benefits of tafamidis occur at concentrations that yield modest target engagement
Among the groups that respond to therapy (male and female Partial Responders and full Responders), the fraction of TTR that is tafamidis-bound at the 20 mg q.d. dose of tafamidis meglumine is about 0.4, corresponding to a slowing of TTR tetramer dissociation by 40%. This result suggests that disease progression is a very fine-tuned function of protein stability, such that increasing the kinetic stability of TTR tetramers modestly through ligand binding—slowing tetramer dissociation by 40% corresponding to a stabilisation energy of just 0.3 kcal mol−1—is enough to slow down or stop disease progression in most ATTRV30M-PN patients. Interestingly, female Non-Responders have a similar level of target engagement as female Partial Responders and Responders (fbound = 0.4), consistent with our previous finding that the tafamidis plasma concentrations of female ATTRV30M-PN patients do not vary by response category [Citation29]. This result could suggest a threshold effect, wherein the probability that these patients will benefit from tafamidis therapy reaches a maximum at a certain level of stabilisation, and further stabilisation by increasing the fraction of TTR that is ligand bound has a diminishing effect on disease progression. In other words, if their polyneuropathy progresses further, it is likely because factors other than the proteotoxicity of misfolded TTR (like, for example, a hyperactive inflammatory response [Citation45,Citation46]) become drivers of disease progression. In contrast, better responses to tafamidis therapy are associated with greater TTR stabilisation in male ATTRV30M-PN patients. Since male and female patients overall have similar fractions of tafamidis-bound TTR at the 20 mg q.d. dose of tafamidis meglumine (consistent with their having similar plasma tafamidis concentrations), this suggests that the threshold stabilisation required for maximum benefit is lower in female than in male ATTRV30M-PN patients, and that male patients could in principle benefit from a higher dose of tafamidis, as we have suggested previously [Citation29]. We discuss this notion further in the next section.
Sex differences in the pathogenesis and progression of both familial and sporadic TTR amyloid diseases are well-documented, but poorly understood [Citation9,Citation45,Citation47]. The existence of different thresholds for maximal benefit from kinetic stabilisation in male and female patients suggests the intriguing hypothesis that the reasons for sex differences in the TTR amyloidoses are to some extent biophysical in origin. Two possibilities seem most likely: (1) TTR in male ATTRV30M-PN patients is less stable than in female patients, possibly because of differences in post-translational modifications or the folding environment of the endoplasmic reticulum or the blood plasma environment of male ATTRV30M-PN patients is more destabilising to TTR than that of female patients, and (2) that males are more susceptible to the deleterious effects of non-native TTR than females, possibly because they clear non-native TTR more slowly. In any case, determining the origin of the sex differences in TTR misfolding potential will be important for understanding the aetiology of TTR amyloidosis.
Could a higher tafamidis dose increase the proportion of male responders?
We mentioned above that ATTR-CM is treated with a 61 mg q.d. dose of tafamidis free acid, which is bioequivalent to an 80 mg q.d. dose of tafamidis meglumine, yielding an average tafamidis plasma concentration of 23.6 μM [Citation38]. This is a 2.8-fold increase compared to the average tafamidis plasma concentration observed with the 20 mg q.d. dose of tafamidis meglumine in this study (8.4 μM). The effect of tafamidis plasma concentration on response to tafamidis therapy in ATTRV30M-PN patients has been quantified in a model we developed previously [Citation29] using the data from this cohort of patients. We can use this model to estimate how this higher tafamidis dose would have affected the response-to-therapy of male patients in this study. A description of how the model was applied and the results of this analysis are shown in Supplemental Figure 6. We estimate that there would have been 39 Non-Responders, 44 Partial Responders, and 34 Responders among the male patients if they had been given the 61 q.d. mg dose of tafamidis free acid. Compare this to 45 Non-Responders, 49 Partial Responders, and 23 Responders actually observed among the male patients on the 20 mg q.d. dose of tafamidis meglumine. Thus, changing the tafamidis dose for ATTRV30M-PN patients could increase the response rate for male patients by almost 50%. It is important to note that the analysis on which this result is based is speculative, given that it is based on a retrospective analysis of this patient cohort. The hypothesis that an increased dose of tafamidis would improve the response rate among male ATTRV30M-PN patients can only be tested with an appropriately designed clinical trial. However, this analysis strongly suggests that such a trial could reveal improved outcomes of tafamidis therapy for ATTRV30M-PN patients at a higher dose of tafamidis.
| Abbreviations | ||
| ANOVA | = | analysis of variance |
| ATTRv | = | Variant transthyretin amyloid |
| ATTRv-CM | = | Hereditary TTR cardiomyopathy (v = variant; CM = cardiomyopathy) |
| ATTRv-PN | = | Hereditary transthyretin polyneuropathy (v = variant; PN = polyneuropathy) |
| ATTRwt | = | Wild type TTR amyloid |
| ATTRwt-CM | = | Sporadic TTR cardiomyopathy (wt = wild type; CM = cardiomyopathy) |
| IB | = | immunoblot |
| q.d. | = | once-daily dose |
| RBP | = | retinol binding protein |
| SDS-PAGE | = | sodium dodecylsulfate polyacrylamide gel electrophoresis |
| TBS | = | tris-buffered saline |
| TTR | = | Transthyretin |
| UPLC | = | ultra-performance liquid chromatography |
| V | = | variant |
| WT | = | wild type |
Supplemental Material
Download Zip (11.4 MB)Supplemental Material
Download MS Excel (23.4 KB)Supplemental Material
Download MS Excel (129.8 KB)Acknowledgments
We thank the team of doctors that have followed the patients at the Unidade Corino de Andrade, especially Ana Martins da Silva, Maria Cristina Alves, Marcio Cardoso, and Luis Maia. We thank the nurses who collected the patient blood samples, especially Susana Ferrerira and the study coordinators Katia Valdrez, Inês Cardoso, and Alexandra Sousa. We are particularly grateful to the patients and their families for participating in the study.
Disclosure statement
JWK and ETP discovered tafamidis and receive royalty payments for its sales. JWK was a founder and shareholder in FoldRx, which first developed tafamidis as a therapeutic. JWK is a paid consultant for and has received support for travel and accommodations from Pfizer, which sells tafamidis. TC has participated as an investigator in clinical trials for FoldRx, Pfizer, Alnylam, Ionis, and Prothena that were paid per protocol to Centro Hospitilar do Porto. TC is a consultant for Pfizer, Alnylam, Ionis, and Prothena. TC has been supported for travel, accommodation, and registration for scientific meetings by Pfizer, Alnylam, Ionis and Biogen.
Additional information
Funding
References
- Powers ET, Kelly JW. From uncovering the mechanism of transthyretin aggregation to the drug tafamidis for ameliorating neurodegeneration and cardiomyopathy. In Smith RA, Kaspar BK, Svendsen CN, editors. Neurotherapeutics in the era of translational medicine. London: Academic Press; 2021. p. 65–103.
- Jacobsson B, Collins VP, Grimelius L, et al. Transthyretin immunoreactivity in human and porcine liver, choroid plexus, and pancreatic islets. J Histochem Cytochem. 1989;37(1):31–37.
- Schreiber G. The evolutionary and integrative roles of transthyretin in thyroid hormone homeostasis. J Endocrinol. 2002;175(1):61–73.
- Monaco HL. The transthyretin-retinol-binding protein complex. Biochim Biophys Acta. 2000;1482(1-2):65–72.
- Wojtczak A, Cody V, Luft JR, et al. Structures of human transthyretin complexed with thyroxine at 2.0 Å resolution and 3',5'-dinitro-N-acetyl-L-thyronine at 2.2 a resolution. Acta Crystallogr D Biol Crystallogr. 1996;52(Pt 4):758–765.
- Rappley I, Monteiro C, Novais M, et al. Quantification of transthyretin kinetic stability in human plasma using subunit exchange. Biochemistry. 2014;53(12):1993–2006.
- Nelson LT, Paxman RJ, Xu J, et al. Blinded potency comparison of transthyretin kinetic stabilisers by subunit exchange in human plasma. Amyloid. 2021;28(1):24–29.
- Wang D, Liem DA, Lau E, et al. Characterization of human plasma proteome dynamics using deuterium oxide. Proteomics Clin Appl. 2014;8(7-8):610–619.
- Adams D, Koike H, Slama M, et al. Hereditary transthyretin amyloidosis: a model of medical progress for a fatal disease. Nat Rev Neurol. 2019;15(7):387–404.
- Ruberg FL, Grogan M, Hanna M, et al. Transthyretin amyloid cardiomyopathy: JACC state-of-the-art review. J Am Coll Cardiol. 2019;73(22):2872–2891.
- Ihse E, Ybo A, Suhr O, et al. Amyloid fibril composition is related to the phenotype of hereditary transthyretin V30M amyloidosis. J Pathol. 2008;216(2):253–261.
- Reixach N, Deechongkit S, Jiang X, et al. Tissue damage in the amyloidoses: transthyretin monomers and nonnative oligomers are the major cytotoxic species in tissue culture. Proc Natl Acad Sci USA. 2004;101(9):2817–2822.
- Schmidt M, Wiese S, Adak V, et al. Cryo-EM structure of a transthyretin-derived amyloid fibril from a patient with hereditary ATTR amyloidosis. Nat Commun. 2019;10(1):5008.
- Schonhoft JD, Monteiro C, Plate L, et al. Peptide probes detect misfolded transthyretin oligomers in plasma of hereditary amyloidosis patients. Sci Transl Med. 2017;9(407):eaam7621.
- Gonzalez-Duarte A, Valdés-Ferrer SI, Cantú-Brito C. Characteristics and natural history of autonomic involvement in hereditary ATTR amyloidosis: a systematic review. Clin Auton Res. 2019;29(Suppl 1):1–9.
- Schmidt HH, Waddington-Cruz M, Botteman MF, et al. Estimating the global prevalence of transthyretin familial amyloid polyneuropathy. Muscle Nerve. 2018;57(5):829–837.
- Ericzon BG, Wilczek HE, Larsson M, et al. Liver transplantation for hereditary transthyretin amyloidosis: after 20 years still the best therapeutic alternative? Transplantation. 2015;99(9):1847–1854.
- Adams D, Gonzalez-Duarte A, O'Riordan WD, et al. Patisiran, an RNAi therapeutic, for hereditary transthyretin amyloidosis. N Engl J Med. 2018;379(1):11–21.
- Benson MD, Waddington-Cruz M, Berk JL, et al. Inotersen treatment for patients with hereditary transthyretin amyloidosis. N Engl J Med. 2018;379(1):22–31.
- Coelho T, Maia LF, Martins da Silva A, et al. Tafamidis for transthyretin familial amyloid polyneuropathy: a randomized, controlled trial. Neurology. 2012;79(8):785–792.
- Maurer MS, Sultan MB, Rapezzi C. Tafamidis for transthyretin amyloid cardiomyopathy. N Engl J Med. 2019;380(2):196–197.
- Berk JL, Suhr OB, Obici L, et al. Repurposing diflunisal for familial amyloid polyneuropathy: a randomized clinical trial. JAMA. 2013;310(24):2658–2667.
- Maurer MS, Schwartz JH, Gundapaneni B, et al. Tafamidis treatment for patients with transthyretin amyloid cardiomyopathy. N Engl J Med. 2018;379(11):1007–1016.
- Hammarstrom P, Wiseman RL, Powers ET, et al. Prevention of transthyretin amyloid disease by changing protein misfolding energetics. Science. 2003;299(5607):713–716.
- Bulawa CE, Connelly S, Devit M, et al. Tafamidis, a potent and selective transthyretin kinetic stabilizer that inhibits the amyloid cascade. Proc Natl Acad Sci USA. 2012;109(24):9629–9634.
- Sekijima Y, Dendle MA, Kelly JW. Orally administered diflunisal stabilizes transthyretin against dissociation required for amyloidogenesis. Amyloid. 2006;13(4):236–249.
- Benson MD, Dwulet FE. Prealbumin and retinol binding protein serum concentrations in the Indiana type hereditary amyloidosis. Arthritis Rheum. 1983;26(12):1493–1498.
- Saraiva MJ, Costa PP, Goodman DS. Studies on plasma transthyretin (prealbumin) in familial amyloidotic polyneuropathy, portuguese type. J Lab Clin Med. 1983;102(4):590–603.
- Monteiro C, Mesgazardeh JS, Anselmo J, et al. Predictive model of response to tafamidis in hereditary ATTR polyneuropathy. JCI Insight. 2019;4(12):e126526.
- Hanson JLS, Arvanitis M, Koch CM, et al. Use of serum transthyretin as a prognostic indicator and predictor of outcome in cardiac amyloid disease associated with wild-type transthyretin. Circ Heart Fail. 2018;11(2):e004000.
- Greve AM, Christoffersen M, Frikke-Schmidt R, et al. Association of low plasma transthyretin concentration with risk of heart failure in the general population. JAMA Cardiol. 2021;6(3):258–266.
- Saith SE, Gamino D, Teruya S, et al. Factors associated with changes in serum transthyretin after treatment with tafamidis and outcomes in transthyretin cardiac amyloidosis. Amyloid. 2021;28(4):267–268.
- Choi S, Ong DS, Kelly JW. A stilbene that binds selectively to transthyretin in cells and remains dark until it undergoes a chemoselective reaction to create a bright blue fluorescent conjugate. J Am Chem Soc. 2010;132(45):16043–16051.
- Jiang X, Labaudiniere R, Buxbaum JN, et al. A circulating, disease-specific, mechanism-linked biomarker for ATTR polyneuropathy diagnosis and response to therapy prediction. Proc Natl Acad Sci U S A. 2021;118(9):e2016072118.
- Ritchie RF, Palomaki GE, Neveux LM, et al. Reference distributions for the negative acute-phase serum proteins, albumin, transferrin and transthyretin: a practical, simple and clinically relevant approach in a large cohort. J Clin Lab Anal. 1999;13(6):273–279.
- Judge DP, Heitner SB, Falk RH, et al. Transthyretin stabilization by AG10 in symptomatic transthyretin amyloid cardiomyopathy. J Am Coll Cardiol. 2019;74(3):285–295.
- Falk RH, Haddad M, Walker CR, et al. Effect of tafamidis on serum transthyretin levels in non-trial patients with transthyretin amyloid cardiomyopathy. JACC CardioOncol. 2021;3(4):580–586.
- Lockwood PA, Le VH, O'Gorman MT, et al. The bioequivalence of tafamidis 61-mg free acid capsules and tafamidis meglumine 4 x 20-mg capsules in healthy volunteers. Clin Pharmacol Drug Dev. 2020;9(7):849–854.
- Wiseman RL, Johnson SM, Kelker MS, et al. Kinetic stabilization of an oligomeric protein by a single ligand binding event. J Am Chem Soc. 2005;127(15):5540–5551.
- Rosen HN, Moses AC, Murrell JR, et al. Thyroxine interactions with transthyretin: a comparison of 10 different naturally occurring human transthyretin variants. J Clin Endocrinol Metab. 1993;77(2):370–374.
- Gundapaneni BK, Sultan MB, Keohane DJ, et al. Tafamidis delays neurological progression comparably across Val30Met and non-Val30Met genotypes in transthyretin familial amyloid polyneuropathy. Eur J Neurol. 2018;25(3):464–468.
- Chen JJ, Genereux JC, Suh EH, et al. Endoplasmic reticulum proteostasis influences the oligomeric state of an amyloidogenic protein secreted from mammalian cells. Cell Chem Biol. 2016;23(10):1282–1293.
- Parenti G, Andria G, Valenzano KJ. Pharmacological chaperone therapy: preclinical development, clinical translation, and prospects for the treatment of lysosomal storage disorders. Mol Ther. 2015;23(7):1138–1148.
- Fox JC, Hellawell JL, Rao S, et al. First-in-human study of AG10, a novel, oral, specific, selective, and potent transthyretin stabilizer for the treatment of transthyretin amyloidosis: a phase 1 safety, tolerability, pharmacokinetic, and pharmacodynamic study in healthy adult volunteers. Clin Pharmacol Drug Dev. 2020;9(1):115–129.
- Kurian SM, Novais M, Whisenant T, et al. Peripheral blood cell gene expression diagnostic for identifying symptomatic transthyretin amyloidosis patients: male and female specific signatures. Theranostics. 2016;6(11):1792–1809.
- Azevedo EP, Guimaraes-Costa AB, Bandeira-Melo C, et al. Inflammatory profiling of patients with familial amyloid polyneuropathy. BMC Neurol. 2019;19(1):146.
- Lemos C, Coelho T, Alves-Ferreira M, et al. Overcoming artefact: anticipation in 284 portuguese kindreds with familial amyloid polyneuropathy (FAP) ATTRV30M. J Neurol Neurosurg Psychiatry. 2014;85(3):326–330.
- Dyck PJ, Davies JL, Litchy WJ, et al. Longitudinal assessment of diabetic polyneuropathy using a composite score in the rochester diabetic neuropathy study cohort. Neurology. 1997;49(1):229–239.
- Vinik EJ, Hayes RP, Oglesby A, et al. The development and validation of the norfolk QOL-DN, a new measure of patients’ perception of the effects of diabetes and diabetic neuropathy. Diabetes Technol Ther. 2005;7(3):497–508.
- Suhr O, Danielsson A, Holmgren G, et al. Malnutrition and gastrointestinal dysfunction as prognostic factors for survival in familial amyloidotic polyneuropathy. J Intern Med. 1994;235(5):479–485.