
Abstract
Background
Cardiac amyloidosis is a severe condition leading to restrictive cardiomyopathy and heart failure. Mass spectrometry-based methods for cardiac amyloid subtyping have become important diagnostic tools but are currently used only in a few reference laboratories. Such methods include laser-capture microdissection to ensure the specific analysis of amyloid deposits. Here we introduce a direct proteomics-based method for subtyping of cardiac amyloidosis.
Methods
Endomyocardial biopsies were retrospectively analysed from fresh frozen material of 78 patients with cardiac amyloidosis and from 12 biopsies of unused donor heart explants. Cryostat sections were digested with trypsin and analysed with liquid chromatography - mass spectrometry, and data were evaluated by proteomic software.
Results
With a diagnostic threshold set to 70% for each of the four most common amyloid proteins affecting the heart (LC κ, LC λ, TTR and SAA), 65 of the cases (87%) could be diagnosed, and of these, 61 cases (94%) were in concordance with the original diagnoses. The specimens were also analysed for the summed intensities of the amyloid signature proteins (ApoE, ApoA-IV and SAP). The intensities were significantly higher (p < 0.001) for all assigned cases compared with controls.
Conclusion
Cardiac amyloidosis can be successfully subtyped without the prior enrichment of amyloid deposits with laser microdissection.
Introduction
Amyloidosis is a heterogeneous group of diseases caused by the misfolding and deposition of specific amyloid proteins in various tissues and organs [Citation1]. To date, 36 different human amyloid fibril proteins have been identified, giving rise to a wide range of symptoms and clinical conditions [Citation2]. Some amyloid proteins deposit into a single organ, such as the islet amyloid polypeptide (IAPP) in the pancreas of patients with type II diabetes, leading to loss of beta-cells [Citation3]. Other amyloid proteins, such as the acute-phase reactant serum amyloid A (SAA), which causes inflammatory-related (AA) amyloidosis, deposit in multiple organs and lead to systemic disease [Citation4].
Cardiac amyloidosis is usually secondary to systemic disease where two types account for 95% of all cases: immunoglobulin light chain amyloidosis (AL) and transthyretin amyloidosis (ATTR) [Citation5]. AL amyloidosis is related to bone marrow disorders where the overproduction of immunoglobulins by a plasma cell clone results in the deposition of free light chains of kappa (LC κ) or lambda (LC λ) type in various organs [Citation6]. ATTR amyloidosis can develop at normal circulating TTR concentrations, but genetic mutations resulting in amino acid changes in the protein sequence will markedly affect disease development [Citation7]. Age-related oxidative modifications of TTR and tissue-specific factors likely drives deposition of wild-type TTR, the predominant variant of ATTR amyloidosis [Citation8,Citation9]. Despite the difference in their underlying disease mechanisms, both AL- and ATTR cardiac amyloidosis cause thickening of the ventricular walls of the heart, leading to restrictive cardiomyopathy and heart failure [Citation5]. The clinical management of cardiac amyloidosis depends on the amyloid-type, and often includes high-risk therapeutic interventions [Citation10]. For instance, AL amyloidosis is treated as a plasma cell dyscrasia and the therapy is directed to reduce the proliferation of plasma cells and their production of light chains [Citation11]. Recently, rational designed drugs have entered the clinic for treatment of both AL and ATTR amyloidosis, aiming either to reduce the production of the amyloid proteins, or to ameliorate their fibrillization process [Citation12]. Thus, accurate subtyping of cardiac amyloidosis is of paramount importance for selecting the correct treatment regime and, consequently, also for the clinical outcome.
Although several clinical and laboratory findings can assist in the diagnosis of amyloidosis, definite diagnosis almost always requires immuno/histochemical examination of biopsy specimens [Citation10]. Amyloid deposits are identified with Congo red (CR) staining, which typically generates green birefringence when viewed under cross-polarised light [Citation2]. The determination of the amyloid subtype has traditionally been dependent on immunohistochemistry with antibodies directed towards different amyloid proteins. Unfortunately, immunohistochemistry can be unreliable due to high background staining and lack of antibody specificity, leading to difficulties to implement the method with high sensitivity and specificity [Citation13]. To this aim, proteomic based typing methods have become an important tool for amyloid subtyping and are currently used as the gold standard in a limited number of reference laboratories or centres for amyloidosis research [Citation14–16]. The general proteomic based approach includes trypsin digestion of a biopsy specimen, followed by nano-liquid chromatography-tandem mass spectrometry (nLC-MS/MS) analysis and subsequent data evaluation to identify the pathogenic amyloid fibril protein. This approach has greatly improved the accuracy of the diagnostic procedure and even enabled the identification of novel amyloid proteins [Citation17]. Furthermore, nLC-MS/MS analysis of cardiac amyloid is often preceded by laser-capture microdissection to ensure the specific analysis of amyloid deposits, a procedure which effectively reduces background signal and facilitates data interpretation [Citation14,Citation16]. However, laser-capture microdissection is labour-intensive and the instrumentation is costly, thus hampering the possibility of implementing proteomic based methods for cardiac amyloid subtyping in a larger group of clinical laboratories worldwide.
Here we present a proteomic typing method for the direct classification of cardiac amyloid without prior requirement of the specific laser microdissection of amyloid deposits. Endomyocardial biopsies (EMB) were retrospectively analysed from fresh frozen material of 78 patients diagnosed with cardiac amyloidosis and from 12 biopsies of unused donor heart explants. With a diagnostic threshold set at 70% for each of the four most common amyloid proteins that affect the heart (LC κ, LC λ, TTR and SAA) [Citation18], 65 of the cases (87%) could be diagnosed, and of these, 61 cases (94%) were in concordance with the original diagnosis. To overcome the uncertainty of potentially analysing specimens with little or no amyloid involvement, each specimen was also analysed for the presence of a proteomic cardiac amyloid fingerprint to ensure the specific analysis of amyloid-containing tissue. We argue that this simplified workflow will be of value for expanding the use of proteomic subtyping of cardiac amyloid into accredited clinical laboratories around the world.
Materials and methods
Study population and data collection
The study was approved by the Research Ethics Board at the Sahlgrenska Academy, University of Gothenburg, Sweden, following the Helsinki Declaration (approval number: 286-18). This retrospective single-centre review of the pathology database and electronic patient records includes 78 consecutive patients with cardiac amyloidosis, who underwent diagnostic endomyocardial biopsy at the Sahlgrenska University Hospital between January 1994 and January 2020. Of the patients examined, a clinical diagnosis was not achieved due to missing data in two cases that were excluded. One patient was excluded due to an insufficient amount of myocardial tissue. As a result, the study enrolled 75 patients and 12 controls. For all patients, clinical course, laboratory tests, echocardiography, EMB, cardiac magnetic resonance, scintigraphy, as well as all additional diagnostic approaches available from the initial evaluation, were reviewed independently by two cardiologists to confirm the diagnosis. The scintigraphy analyses were performed either with 99mTc-Hydroxymethylene diphosphonate (HDP) or 99mTc-3,3-diphosphono-1,2-propanodicarboxylic acid (DPD) [Citation19]. Each clinician retrospectively categorised each patient into one of the following subtypes outlined in the European Society of Cardiology position statement on cardiac amyloidosis: immunoglobulin light-chain (AL), serum amyloid A protein (AA) and transthyretin in either its hereditary (ATTRv) or acquired (ATTRwt) form [Citation20]. Each case was discussed by the study team, and any discrepancies between clinicians were reviewed in detail before a final subtyping was agreed upon by the majority of the study team. The clinical diagnoses were compared with the nLC-MS/MS results that were performed on all cases and controls without prior knowledge of the original clinical diagnosis or status.
Endomyocardial biopsy (EMB)
Transvenous EMB was performed in the supine position by cardiologists subspecialized in heart failure and transplantation using the standard Seldinger technique. Biopsies were obtained from the right ventricular septum by using a disposable bioptome with fluoroscopic and echocardiographic guidance [Citation21]. Three to five specimens were obtained from each patient. One specimen was placed on a cork plate in O.C.T. mounting medium and directly frozen in isopentane chilled by dry ice and then stored at −80 °C. The other specimens were fixed in formalin and embedded in paraffin. No complications related to EMB were reported. Corresponding control tissues were obtained from the same location of explanted organ donor hearts.
Explanted hearts
Proteomic samples were prepared from formalin fixed and paraffin embedded (FFPE) blocks originating from explanted hearts, collected within the heart transplantation practice at Sahlgrenska University Hospital.
Congo red staining and assessment of amyloid load
Freshly frozen EMBs obtained from patients were used. Each frozen biopsy specimen measured approximately 1-2 mm in diameter, and cryostat sections were prepared at 10 µm thickness and placed on glass slides. The sections were incubated in alkaline CR solution (CR 3 g/L, NaCl 3 g/L, 80% ethanol, 0,01% NaOH) for 15 min, rinsed in water, counterstained in Mayer’s hemalum (Merck, 109249), rinsed in water, dehydrated to xylene and mounted. The specificity of positive (red) staining by CR was verified by yellow to green birefringence in polarised light microscopy. Samples were subsequently scanned in conventional brightfield illumination at 40X magnification using a Hamamatsu NanoZoomer S60 whole slide scanner and the amount of amyloid deposition established by inspection of digital slides using NDP.view2 software. Grading of amyloid deposition was performed by visual estimation of the relative amount of CR amyloid deposition in the myocardium. It should be noted that the initial diagnosis of cardiac amyloidosis was based on light microscopic investigation of sections of the formalin fixed and paraffin embedded EMBs stained with CR.
Sample preparation with protein digestion
Duplicate samples, each containing 10-15 cryostat sections depending on biopsy size, were prepared from the freshly frozen specimens for analysis by mass spectrometry after removing most of the embedding medium around the biopsy specimen with a scalpel. For two biopsies, limiting amounts of remaining tissue allowed for collection of only single samples.
The cryostat sections were homogenised using a FastPrep®-24 instrument (MP Biomedicals, OH, USA) with Lysing Matrix D (1/3 of the beads) for five repeated cycles (speed 6.5 m/s, 40 s/cycle) in 150 µL lysis buffer containing 2% sodium dodecyl sulphate (SDS) and 50 mM triethylammonium bicarbonate (TEAB). Lysed samples were centrifuged at 16 000 × g for 10 min and the supernatants were transferred to new tubes. The original tubes were washed with additional 50 µL of the lysis buffer and the Fast Prep procedure was repeated followed by centrifugation at 16 000 x g for 10 min and the supernatants combined. Protein concentration in the combined lysates was determined using Pierce™ BCA Protein Assay Kit (Thermo Scientific) and a Benchmark™ Plus microplate reader (BIO-RAD) with bovine serum albumin (BSA) solutions as standards. Thirty micrograms of homogenised protein material were digested with trypsin using the filter-aided sample preparation (FASP) method [Citation22]. Briefly, 30 µg from each sample were reduced with 100 mM dithiothreitol at 60 °C for 30 min, transferred to 30 kDa MWCO Pall Nanosep centrifugation filters (Pall Corporation, Port Washington, NY, USA), washed several times with 8 M urea and once with digestion buffer (DB, 0.5% sodium deoxycholate (SDC) in 50 mM TEAB) prior to alkylation with 10 mM methyl methanethiosulfonate in DB for 20 min at room temperature. Digestions were performed by addition of 0.3 µg Pierce MS grade Trypsin (Thermo Fisher Scientific) in DB at 37 °C and incubated overnight. An additional portion of 0.3 µg trypsin was added and incubated for another four hours at 37 °C. Peptides were collected by centrifugation and purified using High Protein and Peptide Recovery Detergent Removal Resin (Thermo Fisher Scientific) according to the manufacturer’s instructions. Traces of SDC were removed by acidification with 10% TFA and subsequent centrifugation and samples were further purified with Pierce peptide desalting spin columns (Thermo Fischer Scientific) according to the manufacturer’s instructions, dried and reconstituted in 20 µL of water with 3% acetonitrile and 0.2% formic acid just prior to the nLC-MS/MS analysis.
NanoLC-MS/MS analysis
NanoLC-MS/MS analysis was performed with Orbitrap mass spectrometers, either QExactive HF or Orbitrap Fusion Lumos Tribrid interfaced with Easy-nLC1200 liquid chromatography systems (Thermo Fisher Scientific). Peptides were trapped on an Acclaim Pepmap 100 C18 precolumn (100 μm × 2 cm, particle size 5 μm, Thermo Fischer Scientific) and separated on an in-house packed analytical column (75 μm × 35 cm, particle size 3 μm, Reprosil-Pur C18, Dr. Maisch). The nanoLC gradient was run at 300 nL/min from 7-35% solvent B in solvent A during 67 min, 35-48% B during 8 min followed by an increase to 100% B during 5 min, and 100% B for 10 min alternatively from 6-35% B during 77 min up to 100% during 3 min, and 100% B for 10 min. Solvent A was 0.2% formic acid in water and solvent B was 80% acetonitrile, 0.2% formic acid in water. The instrument operated in global data-dependent positive mode where the precursor (peptide) ion mass spectra were acquired at a resolution of 120 000, m/z range 400-1600 or m/z 375-1375 with Automatic gain control (AGC) 300 000-400 000 during 30-50 ms. The 7 most intense ions or the most intense ions during a 1 s cycle time, with charge states 2-5, were selected for fragmentation using HCD at collision energy setting of 28% (NCE). The isolation window was set to 0.7 or 1.2 Da and dynamic exclusion during 20-60 s at 10 ppm was used. MS/MS spectra were acquired at a resolution of 15 000 or 30 000 with maximum injection time set to 30 or 110 ms. Samples were injected in triplicate.
Mass spectrometry data analysis
Peptides and proteins were identified using Proteome Discoverer version 2.4 (Thermo Fisher Scientific). Spectrum Files RC node was used to apply non-linear precursor mass recalibration with 20 ppm initial mass tolerance for precursors and 0.05 Da for fragments. The processed files were matched against the Swiss-Prot Homo sapiens database (December 2019) using Mascot 2.5.1 (Matrix Science, London, United Kingdom) as a search engine and trypsin without missed cleavages as an enzyme rule. Precursor mass tolerance was set to 5 ppm and fragment tolerance to 0.02 Da; oxidation on methionine and acetylation at the N-termini of proteins were set as variable modifications, methylthiolation on cysteine was set as a fixed modification. Quality of peptide matches was assessed using Percolator node with the target False Discovery Rate (FDR) (Strict) set to 0.01.
LC-MS features were quantified by the Minora Feature Detector node in Proteome Discoverer 2.4. Chromatographic alignment and feature mapping were enabled with maximum RT shift of 5 min, mass tolerance of 5 ppm and a minimal Signal-to-noise threshold of 5. Primary ion intensity values at peak maximum for all unique and shared peptides were used to calculate the corresponding protein abundances. The resulting tables were exported from Proteome Discoverer and processed using a Python script as follows: values for the 3 injection replicates were averaged for each protein and sample, and the averaged values were normalised on sum total protein abundance in each sample. The values of two technical replicates (where applicable) were then averaged. After averaging the technical replicates we then calculated the percentages of the diagnostic proteins (see below).
Data evaluation
The assignment of amyloid type in each specimen was based on 4 groups of the most common amyloid proteins, LC λ, LC κ, TTR and SAA, which may aggregate in the heart [Citation18]. As the biopsies varied in size, composition, and the total amount of amyloid per weight of tissue, considerable variations are expected between the samples. Thus, to minimise this sample variability, the abundance of each amyloid protein was expressed as the relative amount (%) instead of total amount of the amyloid protein. A diagnostic algorithm was adapted that previously has been developed for the proteomic subtyping of amyloid in subcutaneous tissue [Citation15]. The relative intensity of each of the 4 amyloid proteins (LC λ, LC κ, TTR and SAA) was expressed in relation to the total intensity of the four precursor proteins; the amyloid type was assigned to the amyloid protein, which had the highest relative intensity, with a diagnostic threshold value of 70%. This threshold value has previously been used for the proteomic subtyping of amyloid in subcutaneous tissue [Citation15]. The intensity measurements of each amyloid protein were based on the identities of tryptic peptides derived from LC λ constant 2 (P0DOY2), LC κ constant (P01834), TTR (P02766) and SAA-1 (P0DJI8), respectively. The intensity measurements of amyloid signature proteins [Citation23] were based on intensities of tryptic peptides derived from ApoA-IV (P06727), ApoE (P02649) and Serum Amyloid P-component (SAP) (P02743). The MS data have been deposited to the ProteomeXchange consortium via the PRIDE partner repository with the data set identifier PXD033168.
Results and discussion
Proteomic analysis of endomyocardial biopsies provides reliable subtyping of cardiac amyloid
Freshly frozen EMBs collected from 78 patients with cardiac amyloidosis were prepared for proteomic analysis. A schematic outline of the sample cohort and the results are shown in . One biopsy was excluded from the procedure due to low protein amount, and two biopsies were excluded due to uncertainty regarding their original clinical diagnoses. All the remaining 75 cases were stained with CR to assess the degree of amyloid deposits in the specimens (). Representative images of CR-stained sections with different amyloid scores (0, +, ++, +++) are shown in . Global proteomic analysis and subsequent data evaluation of the samples allowed for the identification of 2300 to 3300 unique proteins in each sample. Out of 75 samples, 65 cases (87%) presented one amyloid precursor protein above the diagnostic threshold of 70% relative abundance, while 10 cases (13%) did not. Furthermore, in cases with one amyloid protein above the diagnostic threshold, the clinical diagnosis and the proteomic based diagnosis was concordant in 61 of 65 cases (94%) and discordant in 4 of 65 (6%). ATTR was assigned as the amyloid subtype in the majority of the biopsies (32 out of 65), followed by LC λ (28 out of 65) and LC κ (5 out of 65) (). A list of the proteomic based diagnoses compared to the original clinical diagnoses and additional clinical information is shown in and Supplementary Table 1, respectively. Furthermore, to assess the general background signal, we compared the total intensities of the four amyloid precursor proteins in relation to the total protein intensity in amyloid-laden tissue and control heart tissues. The analysis showed more than 20-fold higher relative intensity on average in amyloid-laden tissue compared with control tissue (mean 1.93% vs 0.083%, p < 0.001) (), indicating that the sample material was representative for the amyloid diagnoses and that the background signals of amyloid proteins in a non-amyloidotic tissue are limited.
Figure 1. A schematic outline of the sample cohort and the proteomic results. Seventy-eight biopsies collected as EMBs from patients with cardiac amyloidosis were prepared for proteomic analysis. Three biopsies were excluded from the protocol due to low protein amount and unclear clinical diagnoses, respectivly. The amyloid subtype in each specimen was attributed to any of the four main amyloid precursor proteins which may affect the heart: LC λ, LC κ, TTR and SAA. Out of 75 analysed biopsies, 65 biopsies were above the diagnostic threshold of 70% for the dominating amyloid precusor protein. Of theses 65 cases, 61 cases were in accordance with previously assigned clinical diagnoses, whereas 4 cases were in discordance with the previously assigned diagnoses.
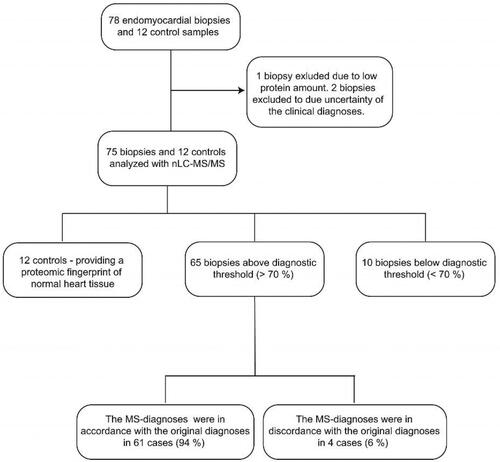
Figure 2. Grading of amyloid content in fresh frozen endomyocardial biopsy specimens after staining with Congo red. (A-D) The CR-stained sections viewed under bright field microscopy. (E-H) The CR-stained sections viewed by fluorescence microscopy and Texas red filter (yellow). The biopsy specimens show varying degree of amyloid deposition, 0 = 0%, + = <5%, ++ = 5-20%, +++ = >20%.
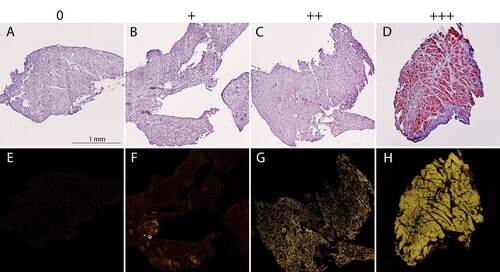
Figure 3. Distribution of the proteomic-based amyloid-typing. (A) TTR was assigned as the pathogenic amyloid-precursor protein in 32 cases. LC λ and LC κ were assigned in 28 and 5 cases, respectively. SAA was not assigned as the amyloid-protein in any of the cases. (B) Relative intensity (%) of the sum of four amyloid proteins (TTR, LC λ, LC κ and SAA) in relation to the total protein intensity in individual control and patient samples, coloured according to the proteomic results. Mean relative intensities for controls and amyloid samples were 0.083% and 1.93%, respectively. Unpaired student T-test. p < 0.001 (****).
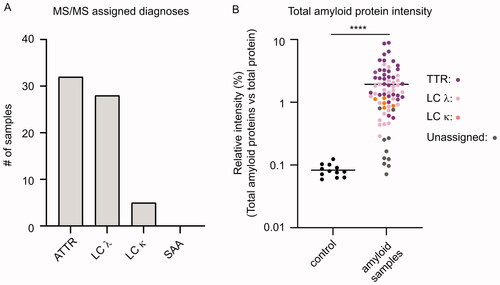
Table 1. Detailed results of the protomic-based diagnoses compared to the clinical diagnoses of cardiac amyloid patients.
As some institutes do not collect frozen biopsies in their clinical routine, we wanted to assess whether our direct approach for the subtyping of cardiac amyloid is also suitable for FFPE tissue samples. Five samples were prepared for proteomic analysis from FFPE blocks originating from explanted hearts of patients who had undergone a heart transplantation due to cardiac amyloidosis. For all five patient cases, a single amyloid precursor protein was consistently identified as the main amyloid protein component with a relative abundance above the diagnostic threshold of 70%. Furthermore, the clinical diagnoses and the proteomic based diagnoses were concordant in all cases (Supplementary Figure 1(A,B)), suggesting that our method is also valid for FFPE tissue samples.
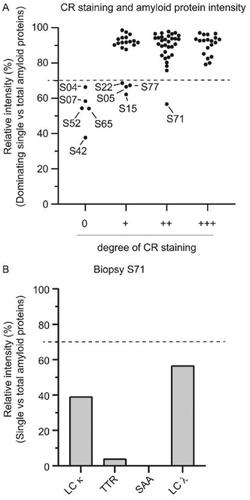
To assess the influence of the degree of amyloid deposits in the specimens on the method’s diagnostic capability, the amyloid scores of the CR stainings were plotted against the relative abundance of the most abundant amyloid precursor protein (). Ten cases were below the diagnostic threshold of 70% relative abundance (S04, S05, S07, S15, S22, S42, S52, S65, S71 and S77) (). Of note, the diagnostic threshold rule of 70%, previously developed for the proteomic subtyping of amyloid in subcutaneous tissue [Citation15], seems also to work well in this dataset as most of the samples were either clearly under or clearly above the 70% value (). Further, five of these unassigned samples had an amyloid CR score of 0, whereas four samples had a score of 1+ and one sample had a score of 2+. Although it is obvious that an amyloid subtype cannot be assigned in a specimen without amyloid, it is important to acknowledge that a negative finding does not necessarily mean that the patient does not have amyloidosis. Furthermore, the amyloid can have a patchy distribution in the myocardium such as the amyloid deposits can be absent in some or even all of the biopsies collected during the sampling procedure [Citation5]. Of note, all patients in this study had a CR positive staining in at least one of the paraffin embedded EMBs prepared from each patient. Thus, a negative CR staining, as seen here for half of the unassigned cases, merely exclude that these particular fresh-frozen biopsies contained any amyloid [Citation2,Citation24]. Therefore, proteomic analyses of additional biopsies collected from the same patients, potentially containing detectable amyloid levels, would likely result in the successful assignment of their amyloid subtypes. Indeed, 16 out of 20 cases with a 1+ score could be assigned a proteomic based diagnosis, indicating that even limited amounts of amyloid are often sufficient for diagnosis with this method. Surprisingly, a single case (S71) with a clear 2+ score was still under the diagnostic threshold. The two most abundant amyloid proteins in this particular sample were LC λ and LC κ, with a relative intensity of 56.7% and 39.1%, respectively (). Although S71 could not be unequivocally assigned with the 70% threshold rule, the results may indicate AL amyloidosis with a biclonal gammopathy as the underlying aetiology. However, it should be noted that in rare cases other amyloid proteins than LC λ, LC κ, TTR and SAA may sometimes deposit in the heart, such as ApoA-I and Atrial natriuretic factor [Citation25,Citation26]. Moreover, even combinations of different amyloid fibril proteins have been reported [Citation27,Citation28], suggesting that caution is needed in data interpretation as misdiagnosis may have direct clinical consequences. Nonetheless, the unbiased proteomic based approach, as used here, enables the possibility to further evaluate the proteomic data to potentially identify rare or even novel amyloid proteins.
Figure 4. Influence of the amyloid score on the method’s diagnostic capability. (A) Relative intensity (%) of the dominating single amyloid protein in relation to the summed total intensity of the four amyloid proteins (TTR, LC λ, LC κ and SAA). Samples from ten cases (indicated in the figure) out of 75 were below the diagnostic threshold of 70%. Five samples had an amyloid score of 0, while four samples had a score of 1+. A single undiagnosed case (S71) had an amyloid score of 2+. (B) The relative intensity (%) of the four single amyloid precursor proteins in relation to the summed total intensity of the four amyloid proteins (TTR, LC λ, LC κ and SAA) in patient sample S71. The two most abundant amyloid proteins were LC λ and LC κ, with a relative intensity of 56.7% and 39.1%, respectively.
Further, the subtyping of AL amyloid was based on intensity measurements of tryptic peptides derived from the constant regions of LC λ and LC κ. This identification strategy should enable detection of the vast majority of AL amyloid fibril fragments, as they are typically composed of a variable region plus a varying part of the constant region [Citation29]. In rare occasions the amyloid fibrils may also be composed of complete LC and fragments of the constant regions [Citation30], which should thus also be detected by this protocol. We are not yet aware of any case where the AL amyloid are composed of fibril fragments of only the variable region, although such a scenario cannot be ruled out. To avoid potential misdiagnosis, the results of the proteomic subtyping should thus always be interpreted in relation to all available clinical and laboratory data. Accordingly, conflicting results can prompt re-evaluation of the MS data by also including peptides derived from the light chain variable regions.
Moreover, the proteomic analysis did not assign AA-amyloid in any of the investigated biopsies, although AA-amyloidosis was the original diagnosis in two cases (S05 and S15). However, SAA was the most dominant amyloid protein in both cases and the relative intensity levels for SAA almost reached the diagnostic threshold (S05: 66.5%; S15: 62.2%) (). Thus, although AA-amyloid was not unequivocally assigned, it is still the most likely causative amyloid protein in these two cases.
Detailed evaluation of four cases with discordant clinical and proteomic based diagnoses
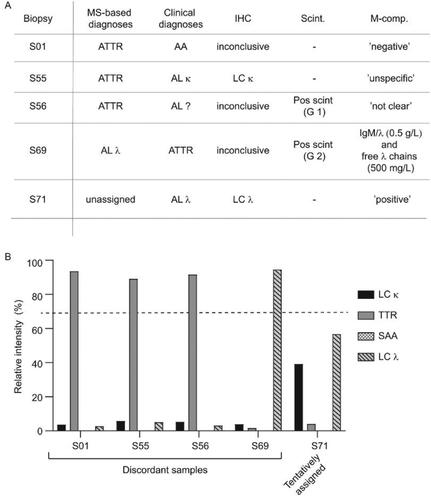
Four cases (S01, S55, S56 and S69) were above the diagnostic threshold, but the assigned diagnoses were discordant to the clinical diagnoses (). The proteomic analysis showed a single dominating amyloid precursor protein for all cases, ranging from 89 to 93%, which were thus all well above the diagnostic threshold of 70% (). To clarify the cause of these discrepancies we re-evaluated the original data that formed the basis for the clinical diagnoses. The case S01 was originally diagnosed as AA-amyloid based on immunohistochemistry that showed positive SAA-staining. However, when a section from the same biopsy was re-stained in connection with this study it was now negative for SAA, indicating that the original diagnosis was probably not correctly assigned. The reason for this discrepancy is yet unclear but immunohistochemistry can be unreliable at times due to lack of antibody specificity. The S55 and S56 cases were subtyped as AL amyloidoses based on immunohistochemistry and DPD-scintigraphy, respectively. However, review of the clinical records did not reveal any additional information that corroborated these diagnoses while the MS-diagnoses were very clear-cut (). Notably, both these cases lacked M-components, which further highlights the uncertainty of the original diagnoses. Further, the S69 case was originally assigned as ATTR based on scintigraphy results while the proteomic-based diagnosis clearly suggested AL λ amyloid. Review of the clinical record for S69 indeed showed two M-components of IgM/λ (0.5 g/L) and free λ chains (500 mg/L), providing a rationale for the proteomic results. The M-components were both relatively small, which may explain why this result was overlooked at the time of diagnosis. As discussed above, the S71 case could not be unequivocally assigned with the 70% threshold rule despite a clear 2+ amyloid score. The two most abundant amyloid proteins were LC λ (56.7%) and LC κ (39.1%), respectively, which may, in combination with results from the other analyses, tentatively be used to assign the case as an AL amyloidosis with a biclonal gammopathy as the underlying aetiology (). According to the clinical record S71 was subtyped as AL λ based on immunohistochemistry. Furthermore, an M-component was indeed identified in the patient, but the record did not provide any further information on the type (or any potential biclonality). Taken together, the original diagnoses were relatively poorly substantiated in the four discordant cases, which may indicate that they were not correct, thus providing a rationale for the apparent discrepancies to the proteomic-based diagnoses.
Figure 5. Cases with discordant clinical and proteomic based diagnoses (A) The proteomic based amyloid typing were discordant with the clinical diagnoses in four cases (S01, S55, S56 and S59). One case (S71) could not be unequivocally assigned with the proteomic analysis despite a clear CR staining (2+). The results from immunohistochemistry (IHC), scintigraphy (Scint.) and M-component analysis (M-comp.) are provided for each case. ‘Pos scint.’ = Scintigraphy performed with a positive result. The positive myocaridal uptake is further graded from 1 to 3 (Grade 1 (G 1): myocardial uptake < rib uptake; Grade 2 (G 2): myocardial uptake = rib uptake; Grade 3 (G 3): myocardial > rib uptake). Ambiguous M-component analysis (e.g. ‘unclear’, ‘not clear’) are denoted exactly as written in the clinical record. (B) Relative intensities (%) of the four single amyloid proteins (LC κ, TTR, SAA and LC λ) expressed in relation to the summed total intensity of the four amyloid proteins in patient samples S01, S55, S56 and S59. The proteomic based diagnoses could be unequivocally assigned in all cases.
Amyloid signature proteins serve as an in situ proteomic marker for amyloid deposition
As the present method is based on analysis of EMB specimens not preceded by laser capture microdissection, unspecific signals of amyloid precursor proteins in non-affected tissue can potentially confound data analysis and may mislead diagnose assignment. Thus, we investigated whether the amyloid signature proteins (ApoE, ApoA-IV and SAP) [Citation23], previously developed for fat aspirates, could serve as in situ markers for cardiac amyloid to ensure that each analysed biopsy contains sufficient amount of amyloid for accurate typing. The intensity of the amyloid signature proteins (ApoE, ApoA-IV and SAP) in relation to the total protein intensity were significantly higher (p < 0.001) in patient samples than in controls (). The relative intensities were on average 1.77% in patient samples, compared with only 0.012% in control tissue. Analysis of the signature proteins in the FFPE tissue samples derived from the explanted hearts demonstrated an average relative intensity of 5.68%. (Supplementary Figure 2(A)). These high signature protein intensities in the explanted hearts likely reflects the high amyloid content in these specimens, as only patients with severe cardiac amyloid deposition are eligible for heart transplantation. The 10 unassigned cases, which displayed little or no CR staining, had a relative signature protein intensity of only 0.25%, which was not statistically significant compared to control tissue (). Thus, a low relative signature protein intensity in a cardiac specimen is associated with poor diagnostic performance.
Figure 6. The amyloid signature proteins provide a useful tool for assessing amyloid levels in cardiac specimens (A) Relative intensities (%) of the sum of the three amyloid signature proteins (ApoE, SAP and ApoA-IV) expressed in relation to the total protein intensity in individual control and patient samples. Mean relative intensities for patient samples and controls were 1.77% and 0.012%, respectively. Unpaired student T-test. p < 0.001 (****). (B) Relative intensities (%) of the sum of the three amyloid signature proteins (ApoE, SAP and ApoA-IV) expressed in relation to the total protein intensity in individual control vs unassigned and assigned samples. Ordinary one-way ANOVA. Control vs unassigned not significant (p = 0.88.). Control vs assigned p < 0.001 (****), unassigned vs. assigned p < 0.001 (****). (C) Relative intensity of total troponin (T and I) expressed in relation to the total protein intensity in patient and control tissue. Mean relative intensities for controls and patients were 0.76% and 0.44%, respectively. Unpaired student T-test. p < 0.001 (****). (D) Relative intensity of total troponin (T and I) in relation to the total protein intensity in control tissue vs unassigned and assigned samples. Ordinary one-way ANOVA. Multiple comparison. Control vs unassigned p < 0.001 (****), control vs. assigned p < 0.001 (****), unassigned vs assigned not significant (p = 0.24).
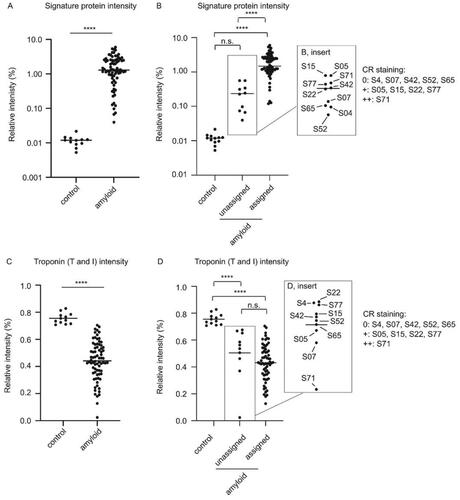
Furthermore, the relative intensities of Troponin I and Troponin T, used here as markers of healthy cardiac tissue, were significantly higher (p < 0.001) in controls compared to patient biopsies (0.76% in controls vs. 0.44% in patient biopsies) (). The average relative intensities of Troponin I and Troponin T in the FFPE tissue samples derived from the explanted hearts were only 0.088%, corroborating the notion of high amyloid load in these samples (Supplementary Figure 2(B)). In addition, the 10 unassigned patient cases had a mean relative Troponin intensity (I and T) of 0.50%, which was also significantly lower (p < 0.001) than the controls. However, the Troponin intensity (I and T) in unassigned cases were not significantly different compared to the assigned cases, indicating that troponins may have limited use for assessing the suitability of a cardiac specimen for proteomic based typing (). Taken together, while histological CR staining is the gold standard for assessing the general presence and degree of amyloid deposition, the use of proteomics for assessing signature proteins in cardiac tissue provides specific structural and semi-quantitative information as to the amyloid deposition. For accurate proteomic based subtyping, we thus propose that the biopsy specimen should contain a minimum of 0.1% of the amyloid signature proteins.
Conclusions and diagnostic considerations
In conclusion, the strategy presented here may have certain clinical advantages compared to previously described methods that include laser-capture microdissection of formalin-fixed and paraffin embedded specimens [Citation14,Citation16]. Apart from being labour-intensive, laser-capture microdissection requires specific equipment and training, thus reducing the possibility to implement proteomic based methods for cardiac amyloid subtyping in clinical laboratories. Here we successfully assigned the subtype without the prior enrichment of amyloid deposits with laser microdissection, suggesting that this step can be excluded from the sample procedure. Proteomic signature proteins were instead used as in situ markers for estimating the degree of amyloid to ensure that the obtained proteomic data were representative of cardiac amyloid deposits. Notably, the method employed frozen rather than formalin-fixed EMBs, which thus requires that at least one biopsy specimen is directly frozen after the sample collection. However, this should be easily accomplished in a clinical setting since it does not require any expensive equipment or training. Finally, we argue that this efficient workflow can be useful for expanding the use of proteomic based methods for cardiac amyloid subtyping in clinical laboratories worldwide.
| Abbreviations | ||
| AA | = | inflammatory-related amyloid protein |
| AGC | = | automatic gain control |
| AL | = | immunoglobulin light chain amyloid protein |
| apoE | = | apolipoprotein E |
| apoA-IV | = | apolipoprotein A-IV |
| ATTR | = | transthyretin amyloid protein |
| ATTRv | = | transthyretin amyloid variant/hereditary form |
| ATTRwt | = | transthyretin amyloid wild/acquired form |
| BSA | = | bovine serum albumin |
| CR | = | Congo red |
| Da | = | Dalton |
| DB | = | digestion buffer |
| DPD | = | 99mTc-3,3-diphosphono-1,2-propanodicarboxylic acid |
| EMB | = | endomyocardial biopsy |
| FASP | = | filter-aided sample preparation |
| FDR | = | False Discovery Rate |
| FFPE | = | formalin fixed paraffin embedded |
| HCD | = | higher energy C-trap dissociation |
| HDP | = | 99mTc-hydroxymethylene diphosphonate |
| IAPP | = | islet amyloid polypeptide |
| IHC | = | immunohistochemistry |
| LC κ | = | immunoglobulin light chain kappa |
| LC λ | = | immunoglobulin light chain lambda |
| MS | = | mass spectrometry |
| MWCO | = | molecular weight cut-off |
| NCE | = | normalised collision energy |
| nLC-MS/MS | = | nano liquid chromatography tandem mass spectrometry |
| ppm | = | parts per million |
| SAA | = | serum amyloid A |
Supplemental Material
Download MS Word (324.6 KB)Disclosure statement
No potential conflict of interest was reported by the author(s).
Correction Statement
This article has been corrected with minor changes. These changes do not impact the academic content of the article.
Additional information
Funding
References
- Pepys MB. Amyloidosis. Annu Rev Med. 2006;57:223–241.
- Benson MD, Buxbaum JN, Eisenberg DS, et al. Amyloid nomenclature 2020: update and recommendations by the international society of amyloidosis (ISA) nomenclature committee. Amyloid. 2020;27(4):217–222.
- Westermark GT, Westermark P. Islet amyloid polypeptide and diabetes. Curr Protein Pept Sci. 2013;14(4):330–337.
- Noborn F, Ancsin JB, Ubhayasekera W, et al. Heparan sulfate dissociates serum amyloid A (SAA) from acute-phase high-density lipoprotein, promoting SAA aggregation. J Biol Chem. 2012;287(30):25669–25677.
- Donnelly JP, Hanna M. Cardiac amyloidosis: an update on diagnosis and treatment. Cleve Clin J Med. 2017;84(12 Suppl 3):12–26.
- Falk RH, Alexander KM, Liao R, et al. AL (Light-Chain) cardiac amyloidosis: a review of diagnosis and therapy. J Am Coll Cardiol. 2016;68(12):1323–1341.
- Bezerra F, Saraiva MJ, Almeida MR. Modulation of the mechanisms driving transthyretin amyloidosis. Front Mol Neurosci. 2020;13:592644.
- Zhao L, Buxbaum JN, Reixach N. Age-related oxidative modifications of transthyretin modulate its amyloidogenicity. Biochemistry. 2013;52(11):1913–1926.
- Noborn F, O'Callaghan P, Hermansson E, et al. Heparan sulfate/heparin promotes transthyretin fibrillization through selective binding to a basic motif in the protein. Proc Natl Acad Sci USA. 2011;108(14):5584–5589.
- Dogan A. Amyloidosis: insights from proteomics. Annu Rev Pathol. 2017;12:277–304.
- Macedo AVS, Schwartzmann PV, de Gusmao BM, et al. Advances in the treatment of cardiac amyloidosis. Curr Treat Options Oncol. 2020;21(5):36.
- Chandrashekar P, Desai AK, Trachtenberg BH. Targeted treatments of AL and ATTR amyloidosis. Heart Fail Rev. 2022;27(5):1587–1603.
- Solomon A, Murphy CL, Westermark P. Unreliability of immunohistochemistry for typing amyloid deposits. Arch Pathol Lab Med. 2008;132(1):14; author reply 14–14; author reply 15. author reply 14–5.
- Vrana JA, Gamez JD, Madden BJ, et al. Classification of amyloidosis by laser microdissection and mass spectrometry-based proteomic analysis in clinical biopsy specimens. Blood. 2009;114(24):4957–4959.
- Brambilla F, Lavatelli F, Di Silvestre D, et al. Reliable typing of systemic amyloidoses through proteomic analysis of subcutaneous adipose tissue. Blood. 2012;119(8):1844–1847.
- Canetti D, Rendell NB, Gilbertson JA, et al. Diagnostic amyloid proteomics: experience of the UK national amyloidosis Centre. Clin Chem Lab Med. 2020;58(6):948–957.
- Dasari S, Theis JD, Vrana JA, et al. Amyloid typing by mass spectrometry in clinical practice: a comprehensive review of 16,175 samples. Mayo Clin Proc. 2020;95(9):1852–1864.
- Alkhawam H, Patel D, Nguyen J, et al. Cardiac amyloidosis: pathogenesis, clinical context, diagnosis and management options. Acta Cardiol. 2017;72(4):380–389.
- Cappelli F, Gallini C, Di Mario C, et al. Accuracy of 99mTc-hydroxymethylene diphosphonate scintigraphy for diagnosis of transthyretin cardiac amyloidosis. J Nucl Cardiol. 2019;26(2):497–504.
- Garcia-Pavia P, Rapezzi C, Adler Y, et al. Diagnosis and treatment of cardiac amyloidosis. A position statement of the european society of cardiology working group on myocardial and pericardial diseases. Eur J Heart Fail. 2021;23(4):512–526.
- Seferovic PM, Tsutsui H, McNamara DM, et al. Heart failure association of the ESC, heart failure society of america and japanese heart failure society position statement on endomyocardial biopsy. Eur J Heart Fail. 2021;23(6):854–871.
- Wiśniewski JR, Zougman A, Nagaraj N, et al. Universal sample preparation method for proteome analysis. Nat Methods. 2009;6(5):359–362.
- Vrana JA, Theis JD, Dasari S, et al. Clinical diagnosis and typing of systemic amyloidosis in subcutaneous fat aspirates by mass spectrometry-based proteomics. Haematologica. 2014;99(7):1239–1247.
- Gilbertson JA, Gillmore JD, Hawkins PN. Amyloid typing: experience from a large referral Centre. In: Picken M, Herrera G, Dogan A, editors. Amyloid and related disorders. Current clinical pathology. Cham: Humana Press; 2015. p. 273–282.
- Lavatelli F, Merlini G. Advances in proteomic study of cardiac amyloidosis: progress and potential. Expert Rev Proteomics. 2016;13(11):1017–1027.
- Maleszewski JJ. Cardiac amyloidosis: pathology, nomenclature, and typing. Cardiovasc Pathol. 2015;24(6):343–350.
- Bergstrom J, Murphy CL, Weiss DT, et al. Two different types of amyloid deposits–apolipoprotein A-IV and transthyretin–in a patient with systemic amyloidosis. Lab Invest. 2004;84(8):981–988.
- Larsen BT, Mereuta OM, Dasari S, et al. Correlation of histomorphological pattern of cardiac amyloid deposition with amyloid type: a histological and proteomic analysis of 108 cases. Histopathology. 2016;68(5):648–656.
- Enqvist S, Sletten K, Westermark P. Fibril protein fragmentation pattern in systemic AL-amyloidosis. J Pathol. 2009;219(4):473–480.
- Engvig JP, Olsen KE, Gislefoss RE, et al. Constant region of a kappa III immunoglobulin light chain as a major AL-amyloid protein. Scand J Immunol. 1998;48(1):92–98.