
 ?Mathematical formulae have been encoded as MathML and are displayed in this HTML version using MathJax in order to improve their display. Uncheck the box to turn MathJax off. This feature requires Javascript. Click on a formula to zoom.
Abstract
Background
Systemic AA amyloidosis is a world-wide occurring protein misfolding disease in humans and animals that arises from the formation of amyloid fibrils from serum amyloid A (SAA) protein and their deposition in multiple organs.
Objective
To identify new agents that prevent fibril formation from SAA protein and to determine their mode of action.
Materials and Methods
We used a cell model for the formation of amyloid deposits from SAA protein to screen a library of peptides and small proteins, which were purified from human hemofiltrate. To clarify the inhibitory mechanism the obtained inhibitors were characterised in cell-free fibril formation assays and other biochemical methods.
Results
We identified lysozyme as an inhibitor of SAA fibril formation. Lysozyme antagonised fibril formation both in the cell model as well as in cell-free fibril formation assays. The protein binds SAA with a dissociation constant of 16.5 ± 0.6 µM, while the binding site on SAA is formed by segments of positively charged amino acids.
Conclusion
Our data imply that lysozyme acts in a chaperone-like fashion and prevents the aggregation of SAA protein through direct, physical interactions.
Introduction
Systemic AA amyloidosis is a world-wide occurring protein misfolding disease that arises from the formation of amyloid fibrils from SAA protein [Citation1–3]. SAA is an acute-phase protein that becomes upregulated in the serum by a factor of 1,000 to 10,000 in response to a strong inflammatory stimulus [Citation1,Citation4,Citation5]. Hence, chronic inflammatory conditions, such as familial Mediterranean fever, rheumatoid arthritis or tuberculosis, are major risk factors for the development of the disease [Citation4,Citation6,Citation7]. AA amyloidosis occurs with an incidence of approximately 1 to 5 cases per 1 million inhabitants in Western countries like the United Kingdom or Sweden [Citation8,Citation9], but retrospective analyses of historical tissue specimens acquired from tuberculosis patients suggest that the disease was more abundant in Europe at the beginning of the twentieth century [Citation10]. In addition, systemic AA amyloidosis can affect captive as well as wild-living animals (birds and mammals) [Citation2,Citation11,Citation12].
Pharmacological treatment of the disease primarily aims to decrease the serum SAA concentration by targeting the underlying inflammation [Citation5,Citation13]. Examples of this are the use of the interleukin-6 blocker tocilizumab or drugs that act on the tumor-necrosis-factor-receptor, such as infliximab or adalimumab [Citation14]. However, not all AA patients are responsive to these treatments [Citation15,Citation16] and other therapeutic strategies have been explored, such as blocking the interactions between SAA, or amyloid fibrils, and glycosaminoglycans [Citation17,Citation18]. Yet, clinical trials with the respective pharmacological agents did not result in a market approval [Citation19–21].
To identify new inhibitors for systemic AA amyloidosis we here take advantage of a previously described cell model to screen for anti-amyloidotic agents in systemic AA amyloidosis [Citation18,Citation22,Citation23]. The cell model is based on observations that macrophages are involved in the biogenesis of AA amyloid deposits in vivo [Citation24], infiltrate amyloid deposits in vivo [Citation25] and that cultured macrophages or monocytic cell lines promote the formation of amyloid deposits from soluble recombinant SAA protein that was added to the culture medium [Citation18,Citation22,Citation26,Citation27]. Cell biological studies show that the cells internalise SAA in such a way that the first detectable amyloid nuclei occur within an endocytic compartment, such as the lysosome or multivesicular bodies [Citation27,Citation28]. Subsequently, the cells die and the previously intracellular amyloid material becomes released into the extracellular space where it can continue to proliferate [Citation29,Citation30]. The cell model was used previously to characterise the activity of known amyloid inhibitors [Citation18,Citation23]. We now demonstrate its potential to identify new inhibitors by screening a library of small proteins and peptides that were purified from human hemofiltrate (HF).
Libraries of human body-derived peptides and small proteins recently emerged as powerful sources to identify new lead compounds for treatment of human diseases, including acquired immunodeficiency syndrome and therapy-induced leukaemia [Citation31–34]. Since the identified hits represent body-own protein sequences, screening such libraries increases the chance of obtaining bioactive agents that are well tolerated by the human body [Citation35]. In our study, the library enabled us to identify human lysozyme as an inhibitor of SAA fibril formation.
Methods
CS statement
Human HF was collected from multiple donors exhibiting the patient’s written informed consent prior to inclusion in the study. The biochemical analysis was based on the positive vote 91/17 of the Ethics Commission of University of Ulm.
Source and preparation of recombinant SAA protein
Murine wild-type SAA1.1 protein as well as the A101C variant of murine SAA1.1 were recombinantly expressed as fusion proteins in Escherichia coli RV308 cells and purified via column chromatography, as described previously [Citation27]. The purified protein was stored in a lyophilised form at −80 °C. The use of the A101C variant will be described further in the methods section on surface plasmon resonance (SPR). Wildtype murine SAA was dissolved in water at a concentration of 10 mg/mL immediately prior to the experiment. The solution was filtered with an Amicon Ultra-0.5 ml centrifugal filter (3 kDa molecular weight cut-off, Merck Millipore) by centrifugation at 14,000 g at 4 °C for 10 min. The retentate was filled up to the original volume with water and the centrifugation step was repeated twice. The protein solution was recovered by placing the filter device upside down in a 2 ml tube, followed by a final centrifugation step at 1,000 g at 4 °C for 1 min. The SAA concentration in the recovered retentate was determined by the method of Gill and von Hippel [Citation36] using a molar extinction coefficient ε at 280 nm of 24,750 M−1 cm−1. The protein concentration was adjusted to 862 µM, which corresponds exactly to 10 mg/mL. That is, all SAA concentrations given in this paper as mg/mL reflect the true molar concentration of the protein. The solution was split into aliquots, flash frozen in liquid nitrogen and stored at −80 °C until use.
Cell preparation and differentiation
THP-1 human monocytic leukaemia cells (Sigma-Aldrich) were cultured in Roswell Park Memorial Institute-1640 cell culture medium (Gibco), which was supplemented with 10% (v/v) heat-inactivated foetal bovine serum (Gibco) and 1% Antibiotic-Antimycotic (Gibco). Cells were incubated in a humidified incubator at 37 °C containing 5% (v/v) CO2. The cells were initially grown in suspension, collected by centrifugation at 100 g for 5 min, and resuspended in medium to count the cell number with a Neubauer improved counting chamber (Marienfeld). The cell suspension was diluted with medium, to which phorbol 12-myristate 13-acetate (PMA, Sigma) was added from a 1 mg/mL stock in ethanol to reach a final concentration of 50 ng/mL. The cells were plated out at a density of 3 × 10⁵cells/mL in 96-well plates (Greiner Bio-One, 100 µL/well) or in 24-well plates (Greiner Bio-One, 1 ml/well) in 1 ml medium. For the Congo red (CR) experiment, 6 mm diameter glass cover-slips (Thermo Fisher Scientific) were placed in the wells of a 96-well plate before plating out the cells. In all cases, we allowed the cells to differentiate in PMA for 72 h, after which the medium was removed and the cells were incubated in PMA-free medium for 24 h. The resulting differentiated cells were used for the various experiments as described below.
Cell culture analysis of a peptide library from human HF
The medium was removed from a 96-well plate with PMA-differentiated cells and replaced with 99 µL fresh medium containing 1 mg/mL SAA that was added from the 10 mg/ml stock immediately before the medium was added to the wells. A 1 µL aliquot of the HF-derived library fractions dissolved in water or 1 µL water (as control) was added to each well. The final library peptide amount in each well corresponded, for fractions F1-F48, to the fraction yield from 200 ml initial HF and, for subfractions S1-S43, to 400 ml or 1,000 ml initial HF. The cells were incubated for 48 h and then analysed using thioflavin T (ThT) staining (described below), CR staining (supplementary methods) or the cell viability assay (described below).
Cell culture analysis of recombinant lysozyme and lysozyme fragments
The medium was removed from a 96-well plate with PMA-differentiated cells and replaced with 198 µL fresh medium containing 50 µM SAA that was added from the 10 mg/ml SAA stock immediately before the medium was added to the wells. A 2 µL aliquot of lysozyme or lysozyme fragment solutions or 2 µL 10 mM sodium phosphate buffer (pH 7.4) or dimethyl sulfoxide (DMSO) were added (as control). The lysozyme solutions were generated by serial dilution of the 10 mM lysozyme stock solution (supplementary methods) with the 10 mM sodium phosphate buffer. Final concentrations of lysozyme in the well ranged from 0.5 to 100 µM. The lysozyme fragment solutions were prepared by serial dilution of the 15 mM lysozyme fragment stocks (supplementary methods) in DMSO to generate final concentrations of lysozyme fragments in the well from 5 to 150 µM. The cells were incubated for 48 h and then analysed by ThT staining or the cell viability assay.
ThT staining
The cells were incubated for 48 h in the presence or absence of SAA and the potential amyloid inhibitors (see above) and amyloid deposition was quantified using ThT staining at the end of the incubation period. To that end, we removed the medium, washed the cells with phosphate-buffered saline (PBS, GIBCO) and fixed them with ice-cold methanol at −20 °C for 10 min. The methanol was removed and the cells were washed with PBS before they were incubated with 100 µL of 12.5 µM ThT in PBS. After 15 min, the solution was replaced with PBS and the ThT fluorescence was measured in a CLARIOstar plate reader (BMG Labtech) as described previously [Citation23]. The measured fluorescence intensities were normalised to a sample containing only SAA protein but no amyloid inhibitor, which was set to 100%. To calculate the half-maximum inhibitory concentration (IC50) the data points were fitted with Origin2019 (OriginLab) to a sigmoidal curve function.
Cell viability assay
The cells were incubated for 48 h without SAA in the presence or absence of the potential amyloid inhibitors (see above). At the end of the incubation period, cell viability was quantified using the 3-(4,5-dimethylthiazol-2-yl)-2,5-diphenyltetrazolium bromide (MTT) assay (Cell Proliferation Kit I, Roche), which was carried out according to the manufacturer’s protocol. In brief, 10 µL of the MTT labelling reagent were added to the 100 µL of culture medium present in each well of the culture plate. After incubation of the mixture for 4 h at 37 °C in a humidified atmosphere, 100 µL 10% (w/v) sodium dodecyl sulphate in 0.01 M HCl were added and incubated overnight at 37 °C. 100 µL of the supernatant were transferred to a new 96 well plate (Greiner Bio-One) and the absorbance of the solubilised formazan product was measured at 550 nm in a FLUOstar Omega plate reader (BMG Labtech).
Cell-free fibril formation assay
200 µL of the 10 mg/mL SAA stock solution in water were mixed with 1 ml 500 mM tris(hydroxymethyl)aminomethane (TRIS) buffer, pH 8.0, 1 ml 200 µM ThT in water and 6.8 ml water to form a kinetic master mix. The lysozyme stock solution (10 mM in sodium phosphate buffer pH 7.4) was serially diluted using 10 mM sodium phosphate buffer, pH 7.4, to generate a series of solutions from 0.005 to 1 mM lysozyme. 10 µL of these solutions or of 10 mM sodium phosphate buffer, pH 7.4 (as control), were pipetted into each well of a black wall 96-well plate (Greiner Bio-One) and mixed with 90 µL from the kinetic master mix to generate a solution containing 0.2 mg/mL (= 17 µM) SAA in 50 mM TRIS, 20 µM ThT and 0 to 100 µM lysozyme, as indicated in . The plate was sealed with sealing film (Rotilabo®) and incubated at 37 °C in a FLUOstar Omega plate reader using the following settings: bottom optic, excitation filter: 450 nm, emission filter: 490 nm, orbital averaging: 4 mm, 20 flashes per well and cycle, total cycle time: 1,800 s.
Surface plasmon resonance
The A101C variant of SAA protein [SAA(A101C)] was dissolved in pure water at a nominal concentration of 3 mg/mL. The concentration was determined using the method of Gill and von Hippel [Citation36] and an ε at 280 nm of 24,870 M−1 cm−1 and adjusted to 2 mg/mL (= 172 µM) in a total volume of 400 µL. 4 µL of a 500 mM tris(2-carboxyethyl) phosphine hydrochloride solution in ethanol were added, mixed and incubated for 30 min at room temperature. 80 µL of a freshly prepared 20 mM solution of EZ-LinkTM Maleimide-PEG2-Biotin (Thermo Fisher Scientific) in 10 mM HEPES buffer (pH 8.0) were added to the SAA(A101C) solution and incubated for 2 h at room temperature. Afterwards, 86 µL 0.7 M NaCl and 6 µL 1 M NaOH were added. Residual EZ-Link was removed by size exclusion chromatography (SuperdexTM30 Increase 10/300 GL column, GE Healthcare). The eluate was collected as fractions of 150 µL and all fractions containing biotinylated SAA(A101C) were pooled, split into aliquots of 200 µL, flash-frozen using liquid nitrogen and stored at −80 °C until further use.
The affinity of lysozyme to immobilised SAA(A101C) was measured at 25 °C with a Reichert SPR7500DC SPR spectrometer, as described previously [Citation37]. A streptavidin-derivatised carboxymethyl dextran hydrogel biosensor chip (SAP; XanTec bioanalytics) was used to immobilise roughly 700 response units of biotinylated SAA(A101C) according to the manufacturer’s recommendations. The reference flow cell was not exposed to SAA. The binding of lysozyme was examined at a flow rate of 25 μL/min. Three independent dilution series of lysozyme were prepared in running buffer (0.005% Tween20 in PBS) leading to final lysozyme concentrations from 80 µM to 1.25 µM. After injection of lysozyme for 4 min, the chip was flushed with buffer without lysozyme and the dissociation was monitored for 10 min. The complex dissociated well within these 10 min of buffer flow. Plots of the measured steady state response units (R) versus lysozyme concentration (c) were fitted with formula Equation(1)(1)
(1) :
(1)
(1)
with Bmax representing the maximum binding capacity (TraceDrawer software, 1:1 steady-state affinity model, Origin2019) to obtain the dissociation constant (KD).
SAA fragment binding assay
A total of 96 overlapping 8-mer peptides covering the entire sequence of murine SAA1.1 with a frame shift of one amino acid (Supplementary Table 1) were synthesised with the auto-spot robot ASP-222 (Abimed) using the standard protocol for spot synthesis [Citation38]. In brief, two β-alanine residues were used to initially derivatize a Whatman 540 cellulose membrane (Whatman) and to define spots. In each step the 9-fluorenylmethyloxycarbonyl (Fmoc) protection was removed from the immobilised peptide residues by treating the membrane for 5 min and 15 min with a 20% (v/v) piperidine solution in N, N-dimethylformamide (DMF). The same procedure was repeated for each peptide in spots and each amino acid. For the coupling steps, Fmoc-protected amino acids, pre-activated as pentafluorophenyl esters, were used at 0.3 M concentration in N-methyl-2-pyrrolidone (three times 0.3 µL spotted). The side chains of the amino acids were protected as follows: 2,2,4,6,7-pentamethyldihydrobenzofuran-5-sulfonyl (arginine), trityl (asparagine, glutamine, histidine, and cysteine), tert-butyl (threonine, tyrosine, serine, aspartic and glutamic acids), tert-butyloxycarbonyl (lysine and tryptophan). After coupling, all unmodified amino groups were capped with a mixture of 0.5 M acetic acid anhydride, 0.125 M N, N-diisopropylethylamine, 0.015 M 1-hydroxy-benzotriazole in DMF. In the final cycle, the Fmoc-deprotection step was done before the capping step, so that N-terminally acetylated peptides were obtained. At the end of the synthesis, the side chain-protecting groups were removed by treatment with 50% (v/v) trifluoroacetic acid (TFA)/dichloromethane.
The membrane was incubated in PBS for 15 min, before it was blocked in 5% (w/v) skimmed milk powder in PBS for 1 h at room temperature. The membrane was washed three times in PBS and incubated with 100 µM lysozyme in PBS solution over night at 4 °C. Afterwards the membrane was washed three times in PBS and incubated with the primary antibody (Anti-lysozyme, rabbit, abcam), which was diluted 1:5,000 in PBS and incubated on the membrane for 60 min at room temperature. The membrane was again washed three times with PBS and incubated for 1 h at room temperature with a 1:1,000 dilution of the secondary anti-rabbit–horseradish peroxidase (HRP) antibody (Dako). Finally, the membrane was washed three times in PBS and developed using West Femto Kit (Thermo Fisher scientific), following the manufacturer’s protocol. The membrane was developed in a Syngene G-box Chemi XL1.4.
Mass spectrometry
Aliquots of subfractions S17 and S18 were lyophilised and dissolved in 0.1% (v/v) TFA at a concentration of 0.1 mg/mL. 15 μL of each sample were filled into a glass vial and placed in the autosampler of an Ultimate 3000 nanoUPLC system coupled to the nanospray source of an Orbitrap Velos Pro mass spectrometer (Thermo Scientific). The samples were analysed in positive ion mode using a spray voltage of 1.5 kV. For both subfractions, an HPLC chromatogram was acquired, and 15,735 (S17) or 15,772 (S18) mass spectra were recorded over the period of the sample elution (65 min). The mass spectra were acquired in the ion trap section of the instrument in normal scan mode and collected for an m/z range of 370 to 1,700. The mass spectra were summed up over 1 min using the QualBrowser (Thermo Scientific), and MaxQuant software [Citation39] was used to assign the experimental masses through a non-specific search of the human proteome based on the UniProt Knowledgebase (www.uniprot.org). This method was used primarily to identify (low abundance) peptide fragments.
In a second step we summed up the mass spectra in each subfraction over the full analysis time (65 min) and deconvoluted the summed spectra using the ‘Quick deconvolution’ feature of MASH Explorer [Citation40] and the default settings. The monoisotopic masses of molecules corresponding to a charge of ≥ 5 and a confidence score of ≥ 90% were analysed for the main component of the subfractions S17 and S18. The mass of this component (14.701,2 Da) could be assigned to c-type lysozyme using mMass [Citation41], allowing a maximum deviation of 0.1 Da between experimental and theoretical mass. In this assignment, disulphide bonds and hydrolysis were assumed as possible modifications.
Transmission electron microscopy (TEM)
5 µL aliquots were withdrawn from the 96-well plate at the end of the cell-free SAA fibril formation experiment (see above) and transferred onto formvar and carbon coated 200 mesh copper grids (Electron Microscopy Sciences). After incubation for 1 min at room temperature excess solvent was removed using filter paper (Whatman), followed by washing the grids three times with water and three times with 50 µL 2% (w/v) uranyl acetate. Excess fluid was removed after each step with filter paper. Finally, the grids were dried on air for 15 min and examined at 120 kV in a JEM-1400 transmission electron microscope (JEOL).
Results
Identification of new protein-based amyloid inhibitors for SAA protein
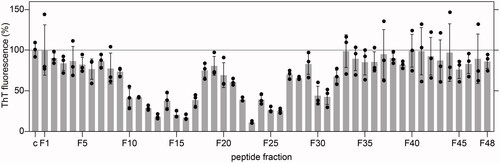
To identify new inhibitors for systemic AA amyloidosis, we screened a library of small proteins, that were purified from human HF, with the cell model of SAA fibril formation. Amyloid formation was monitored based on the fluorescence emission of the amyloid binding dye ThT, which was added to the culture wells at the end of the incubation time (48 h). This time period was previously shown to be sufficient to allow the formation of amyloid deposits in the culture plate [Citation23], while addition of anti-amyloidotic compounds at the beginning of the incubation time reduced the amyloid yield and the ThT signal observable with our assay [Citation23]. In the present case, we tested a total number of 144 crude library fractions, which were obtained through ion exchange chromatography and RPC from human HF (see Materials and Methods for details). 48 of these fractions were obtained by eluting the ion exchange column at pH 6.6; 48 fractions were obtained by elution at pH 7.4 and 48 by elution at pH 9.0. The amount of protein, which was added to each well of the cell culture plate during the initial screen, corresponded to the fraction yield from 200 ml HF. Using this methodology, we obtained the highest inhibitory activity with fraction F23 from the pH 9.0 eluate (). The inhibitory effect was reproducible with two independently purified aliquots (Supplementary Figure S1) and substantially stronger than the inhibitory activity of the fractions from the pH 6.6 or pH 7.4 eluates, which did not reduce the ThT signal by more than 50% (Supplementary Figure S1).
Figure 1. Amyloid load in wells exposed to the crude fractions F1 to F48 from the pH 9.0 eluate, as quantified by ThT fluorescence after incubation of the cells for 48 h (n = 3). Black circles: individual data points. Grey bars: average value. Error bars: standard deviation. The ThT intensity was plotted relative to wells in which cells were incubated without library fractions (c), which were set to 100%.
Through an additional RPC step, we then subdivided fraction F23 into 43 subfractions (S1-S43) and analysed them in the cell model. We obtained the strongest amyloid-inhibitory effects with subfractions S17 and S18 (Supplementary Figure S2). The observed inhibitory effect was dose-dependent; 2.5-fold more concentrated aliquots of the subfractions led to a more potent reduction of the ThT signal (Supplementary Figure S2). An inhibited amyloid formation was also observed when CR green birefringence was used as a readout of amyloid formation (Supplementary Figure S3A). These data indicated that the lowered ThT signal obtained with subfractions S17 and S18 did not simply arise from a competition of the library compound with ThT for the ThT binding site on the fibril but from a reduced amyloid yield. Under the concentration conditions used, subfractions S17 and S18 were not notably toxic and did not provide any evidence of an impaired metabolic activity based on the MTT assay (Supplementary Figure S3B). In conclusion, the low amyloid yield does not arise from a loss of viable cells but from an antagonised formation of amyloid fibrils.
Full-length lysozyme inhibits SAA fibril formation in the cell model
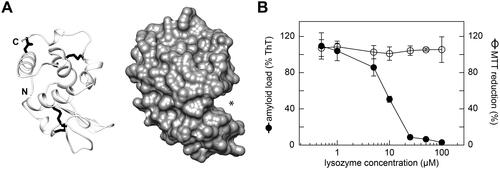
To identify the molecular components underlying this effect, we analysed subfractions S17 and S18 using mass spectrometry. Both subfractions contained one dominating molecular species with a monoisotopic mass of 14,701.2 Da (), which corresponded to the theoretic mass of full-length human c-type lysozyme (14,691.2 Da) with four intact disulphide bonds and at least one other post-translational modification that corresponded to a mass difference of +18 Da. One possibility to explain this mass difference is to assume one hydrolysed peptide bond. The other possibility is one methionine oxidation and two deamidated side chains. Addition of recombinant, full-length human lysozyme to our cell model showed a potent inhibition of amyloid deposition with an IC50 value of 9.1 ± 0.8 µM (). The lysozyme to SAA ratio added to the cells was approximately 1:5 at the IC50 value. There were no signs of toxicity among the range of lysozyme concentrations used (0.5 to 100 µM, ), demonstrating that the inhibited formation of amyloid does not arise from a loss of viable cells.
Figure 2. Mass spectrometric analysis of subfractions S17 and S18. (A) Full-range averaged mass spectra of subfractions S17 and S18, which were summed up over the entire elution period of the HPLC column (65 min). The dominant charge series (z = 9 to z = 14), corresponding to full-length lysozyme, is labelled in both spectra. (B) Deconvoluted mass spectra of the data shown in panel (A). The experimental monoisotopic masses of the main peaks, which correspond to the main peak series in (A), are indicated. The theoretic monoisotopic mass of lysozyme is 14,691.2 Da.
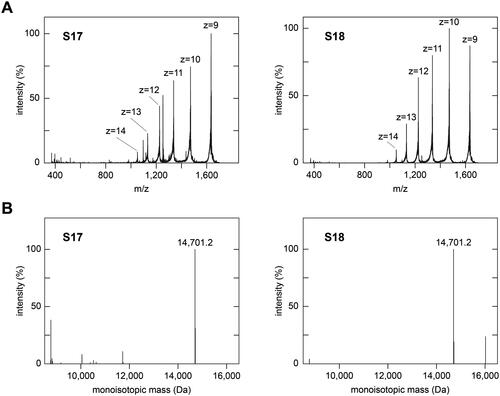
Figure 3. Lysozyme inhibits SAA fibril formation in the cell model. (A) Ribbon diagram (left) and surface representation (right) of human lysozyme (protein data bank: 1REX). N- and C-terminus are indicated. Asterisk: substrate binding cavity. (B) Plot of the amyloid load as quantified by ThT fluorescence and of the cell metabolic activity as quantified based on the MTT reduction after incubation of the cells with different concentrations of lysozyme for 48 h (n = 3). Black circles: amyloid load; open circles: MTT reduction. Error bars: standard deviation. ThT intensity and MTT reduction were plotted relative to samples containing no lysozyme, which were set to 100%.
More in-depth analysis of subfractions S17 and S18 with mass spectrometry revealed a large number of peptide fragments derived from lysozyme (). These peptides resulted in much lower mass spectrometric signals compared with full-length lysozyme (), suggesting that they were much less abundant in the samples. The fragments covered different segments of the lysozyme sequence and were clustered around residues G19-M29, Y38-N60 and P103-R113 of the protein (Supplementary Figure S4). Peptide fragments corresponding to these regions showed neither inhibitory activity (G19-M29 and Y38-N60, Supplementary Figure S5) nor presented an inhibitory activity that was lower than that of full-length lysozyme (P103-R113), Supplementary Figure S5). For example, peptide G19-M29 simultaneously inhibited amyloid formation and reduced the metabolic activity of the cells (Supplementary Figure S5), indicating that this peptide reduced the cell-dependent formation of amyloid by impairing the viability of the amyloid-producing cells. P103-R113 lowered the amount of amyloid (Supplementary Figure S5), but the IC50 value of this reaction (67.3 ± 5.6 µM) was well above the IC50 value of full-length lysozyme (9.1 ± 0.8 µM). Thus, we hereafter focused on full-length lysozyme.
Lysozyme inhibits SAA fibril formation in a cell-free assay
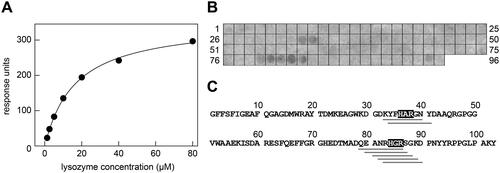
Next, we tested the possibility that lysozyme might physically interact with SAA protein, thereby preventing its aggregation. Indeed, SPR measurements where SAA protein was immobilised on the sensor chip and lysozyme added in the soluble phase demonstrate a direct binding of the two proteins (). From the steady-state signal, we obtained a KD of 16.5 ± 0.6 µM (n = 3, , Supplementary Figure S6A,B). Lysozyme also binds to SAA-derived octapeptides, which were immobilised on a cellulose membrane (). The interactions were particularly strong with peptides in spots 33, 34, 79, 80, 81, 82 and 83 (, Supplementary Figure S6C, Table 1), which represent the most positively charged fragments of SAA protein (). The seven peptides also share a common sequence motif that consists of a histidine, a small aliphatic residue and arginine (), suggesting that SAA is bound by an acidic patch of lysozyme and via electrostatic interactions. As the most acidic motif of lysozyme is in its substrate binding site (Supplementary Figure S7), it is likely that lysozyme binds SAA through its substrate binding channel.
Figure 4. Interaction of lysozyme with SAA protein and SAA fragments. (A) SPR response units obtained upon binding of different concentrations of soluble lysozyme to immobilised SAA. The data were fitted with formula (1) and are representative of three individual experiments (Supplementary Figure S6A-B). The KD value was determined at 16.5 ± 0.6 µM (n = 3). (B) Binding of lysozyme to a series of SAA-derived octa-peptides that were immobilised on the membrane. Bound lysozyme was visualised with an anti-lysozyme antibody. The data are representative of two individual experiments (Supplementary Figure S6C). (C) Sequence of murine SAA plotted side-by-side with the observed lysozyme-binding SAA peptide fragments (grey bars below the sequence). The common shared sequence motifs of the binding peptides are indicated by the grey boxes.
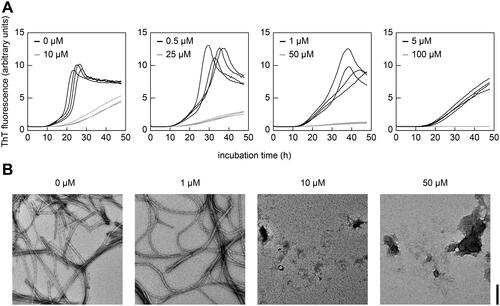
Finally, we used a cell-free assay of fibril formation in which the formation of amyloid fibrils in solution was quantified by real-time ThT fluorescence measurements in the absence of cells. We found that increasing concentrations of lysozyme progressively reduced the observable ThT fluorescence intensity and increased the lag time of fibril formation (). The IC50 value of this reaction was, based on the lag time, 1.3 ± 0.2 µM with a stoichiometry of 1:14 (lysozyme to SAA) at the IC50. Consequently, lysozyme exhibits a higher inhibitory activity in the cell-free assay compared with the cell culture model (see above). The inhibitory activity of lysozyme was confirmed with TEM, as no fibrils were found in samples containing 10 µM or 50 µM lysozyme ().
Figure 5. Lysozyme inhibits SAA fibril formation in a cell-free assay. (A) Real-time ThT fluorescence measurements of the cell-free formation of SAA fibrils in the presence of different concentrations of lysozyme (0 to 100 µM) as indicated in the figure (n = 4). (B) TEM images of representative samples from panel (A) at the end of incubation period. Scale bar: 200 nm.
Discussion
In this research, we identified lysozyme as an inhibitor of amyloid fibril formation from SAA protein. Lysozyme is a 130-amino acid protein that belongs to the α + β class of protein folds and contains four disulphide bonds in its native state (). The protein is part of the innate immune system and participates in the anti-bacterial defense [Citation42]. It binds bacterial peptidoglycans and cleaves the glycosidic bond between N-acetyl muramic acid and N-acetyl glucosamine. The substrate binding site has a channel-like structure and appears to represent the binding site of SAA as well. It is the most acidic part on the surface of lysozyme (Supplementary Figure S7) and thus complementary to the recognised basic patch of residues in SAA protein (). Full-length lysozyme is more active as an inhibitor than peptide fragments of lysozyme (, Supplementary Figure S5), further corroborating the idea that the substrate binding site, which can only be formed by the full-length protein, is important for inhibiting SAA fibril formation. The inhibitory activity is also present if lysozyme contains one or several post-translational modifications that account for the observed mass difference of 18 Da in subfractions S17 and S18 (). Although the exact nature of the modification could not be established, it does not seem to be essential for the observed anti-amyloidotic activity, as uncleaved, recombinant full-length lysozyme also inhibited the formation of amyloid fibrils from SAA protein (, ).
Several pieces of evidence indicate that the underlying inhibitory mechanism involves a direct interaction of lysozyme with SAA protein. Lysozyme is able to bind to SAA protein in vitro () and prevents SAA fibril formation also in the absence of cells (). These data imply that lysozyme acts like a molecular chaperone that prevents the aggregation of its client protein. The inhibitory effect was sub-stoichiometric and the ratio of lysozyme versus SAA was 1:5 in the cell model and 1:14 in the cell-free assay, which indicates that one lysozyme molecule affects several SAA molecules. One possible explanation for the sub-stoichiometric effect of lysozyme is that it interacts with oligomeric states of SAA protein, preventing the further aggregation of SAA into fibrils. An alternative explanation is that lysozyme dynamically interacts with SAA protein such that it affects the aggregation behaviour of several SAA protein molecules within a given period of time.
That the stoichiometric ratio of lysozyme versus SAA was higher in the cell culture than in the cell-free assay can be explained with the fact that the cell model, which involves an internalisation of SAA during amyloid biogenesis [Citation27], represents a more complex environment than a cell-free sample. That is, it is more difficult to find and to bind SAA (oligomers) in the cell model compared to cell-free reactions. Importantly, the sub-stoichiometric activity of lysozyme observed in our study differs from the activity of other amyloid inhibitors, such as β-sheet breakers, which are only active in super-stoichiometric amounts, such as 5:1 or 20:1 (inhibitor versus amyloid protein) [Citation43–45].
Human lysozyme is an amyloidogenic protein itself and known to underlie systemic amyloidosis in humans [Citation46]. However, all patients showing this disease express mutational variants of lysozyme [Citation47]. For several of these mutations it was shown that they destabilise the native protein and promote its unfolding into aggregation competent species that are able to form an intermolecular β-sheet structure [Citation48,Citation49]. Therefore, wildtype lysozyme does not suffice to provoke the disease in vivo, although it was found to be able to form fibrils in vitro [Citation50]. Yet, these fibrils occur only if the protein is exposed to harsh conditions, namely pH2 and 57 °C [Citation50], making it unlikely that lysozyme fibrils or oligomers may have influenced our experiments, which were carried out under much more physiological conditions.
The anti-amyloidotic activity of lysozyme does not seem to be restricted to SAA protein as there is evidence that lysozyme also affects the fibrillation of Alzheimer’s Aβ peptides [Citation51,Citation52]. While further work will be necessary to explore as to whether or not lysozyme exhibits relevant levels of anti-amyloidotic effects in vivo, we noted that the concentration of lysozyme in the human serum is normally in the range of 0.1–0.2 µM [Citation53], which is significantly lower than the IC50 values measured in our cell model (9.1 ± 0.8 µM) or in the cell-free aggregation assay (1.3 ± 0.2 µM). However, the lysozyme serum concentration may elevate under inflammatory conditions, such as rheumatoid arthritis [Citation54], and as lysozyme is expressed in macrophages [Citation55] that are thought to be involved in the biogenesis of amyloid deposits in vivo [Citation24], it is possible that the local concentration of protein can be in range so that it may act on the fibrillation in vivo. Concerning possible applications of our current findings, one may envision possibilities to engineer lysozyme-derived compounds by rational biotechnological design that present more potent anti-amyloidotic activities and may thus be used to eventually prevent amyloid formation in a therapeutic setting.
Author contributions
T.M, I.P.-G., A.A.R. and L.S. carried out experiments. M.M., W.-G. F. and L.S. contributed reagents and materials. T.M, I.P.-G., C.H., J.B., A.R.-A., S.W., C.Q.S. and M.F. analysed data. M.F. designed research. T.M. and M.F. wrote the paper. All authors could comment on the manuscript.
| Abbreviations | ||
| AF488 | = | Alexa Fluor 488 |
| Bmax | = | maximum binding capacity |
| CR | = | Congo red |
| DMF | = | N, N-dimethylformamide |
| DMSO | = | dimethyl sulfoxide |
| FACS | = | fluorescence activated cell sorting |
| Fmoc | = | 9-fluorenylmethyloxycarbonyl |
| HF | = | hemofiltrate |
| HRP | = | horse-radish peroxidase |
| IC50 | = | half maximum inhibitory concentration |
| KD | = | equilibrium dissociation constant |
| LC3B | = | microtubule-associated proteins 1A/1B light chain 3 B |
| MTT | = | 3-(4,5-dimethylthiazol-2-yl)-2,5-diphenyltetrazolium bromide |
| PBS | = | Phosphate-buffered saline |
| PMA | = | phorbol 12-myristate 13-acetate |
| RPC | = | reversed phase chromatography |
| SAA | = | serum amyloid A |
| SPR | = | surface plasmon resonance |
| TBS | = | TRIS-buffered saline |
| TBS-T | = | TRIS-buffered saline plus Tween |
| TEM | = | transmission electron microscopy |
| TFA | = | trifluoroacetic acid |
| ThT | = | thioflavin T |
| TRIS | = | tris(hydroxymethyl) aminomethane |
Supplemental Material
Download PDF (1 MB)Acknowledgements
The authors thank Natalie Scheurmann (Ulm University) for technical assistance in protein purification and Nico Preising from the Core Facility Functional Peptidomics (Ulm University) for peptide synthesis.
Disclosure statement
W.-G.F. has business interests in Pharis Biotech GmbH that may be affected by the research reported in the enclosed paper. T.M., I.P.-G., C.H., J.B., A.R.-A., S.W., C.Q.S., M.M, L.S and M.F. have no potential conflict of interest to declare.
Additional information
Funding
References
- Husby G, Marhaug G, Dowtor B, et al. Serum amyloid a (SAA): biochemistry, genetics and the pathogenesis of AA amyloidosis. Amyloid. 1994;1(2):119–137. doi:10.3109/13506129409148635.
- Westermark GT, Fändrich M, Westermark P. AA amyloidosis: pathogenesisand targeted therapy. Annu Rev Pathol. 2015;10:321–344. doi:10.1146/annurev-pathol-020712-163913.
- Gursky O. Structural basis for vital function and malfunction of serum amyloid A: an Acute-Phase protein that wears hydrophobicity on its sleeve. Curr Atheroscler Rep. 2020;22(11):69. doi:10.1007/s11883-020-00888-y.
- Uhlar CM, Whitehead AS. Serum amyloid A, the major vertebrate acute-phase reactant. Eur J Biochem. 1999;265(2):501–523. doi:10.1046/j.1432-1327.1999.00657.x.
- Brunger AF, Nienhuis HLA, Bijzet J, et al. Causes of AA amyloidosis: a systematic review. Amyloid. 2020;27(1):1–12. doi:10.1080/13506129.2019.1693359.
- Röcken C, Shakespeare A. Pathology, diagnosis and pathogenesis of AA amyloidosis. Virchows Arch. 2002;440(2):111–122. doi:10.1007/s00428-001-0582-9.
- Blank N, Hegenbart U, Lohse P, et al. Risk factors for AA amyloidosis in Germany. Amyloid. 2015;22(1):1–7. doi:10.3109/13506129.2014.980942.
- Pinney JH, Smith CJ, Taube JB, et al. Systemic amyloidosis in England: an epidemiological study. Br J Haematol. 2013;161(4):525–532. doi:10.1111/bjh.12286.
- Hemminki K, Li X, Försti A, et al. Incidence of hereditary amyloidosis and autoinflammatory diseases in Sweden: endemic and imported diseases. BMC Med Genet. 2013;14:88. doi:10.1186/1471-2350-14-88.
- Westermark P, Nilsson GT. Demonstration of amyloid protein AA in old museum specimens. Arch Pathol Lab Med. 1984;108(3):217–219.
- Zschiesche W, Jakob W. Pathology of animal amyloidoses. Pharmacol Ther. 1989;41(1-2):49–83. doi:10.1016/0163-7258(89)90102-2.
- Westermark GT, Westermark P. Serum amyloid a and protein AA: molecular mechanisms of a transmissible amyloidosis. FEBS Lett. 2009;583(16):2685–2690. doi:10.1016/j.febslet.2009.04.026.
- Lachmann HJ, Goodman HJ, Gilbertson JA, et al. Natural history and outcome in systemic AA amyloidosis. N Engl J Med. 2007;356(23):2361–2371. doi:10.1056/NEJMoa070265.
- Okuda Y, Ohnishi M, Matoba K, et al. Comparison of the clinical utility of tocilizumab and anti-TNF therapy in AA amyloidosis complicating rheumatic diseases. Mod Rheumatol. 2014;24(1):137–143. doi:10.3109/14397595.2013.854048.
- Obici L, Merlini G. AA amyloidosis: basic knowledge, unmet needs and future treatments. Swiss Med Wkly. 2012;142:w13580. doi:10.4414/smw.2012.13580.
- Sayed RH, Hawkins PN, Lachmann HJ. Emerging treatments for amyloidosis. Kidney Int. 2015;87(3):516–526. doi:10.1038/ki.2014.368.
- Kisilevsky R, Lemieux LJ, Fraser PE, et al. Arresting amyloidosis in vivo using small-molecule anionic sulphonates or sulphates: implications for alzheimer’s disease. Nat Med. 1995;1(2):143–148. doi:10.1038/nm0295-143.
- Elimova E, Kisilevsky R, Szarek WA, et al. Amyloidogenesis recapitulated in cell culture: a peptide inhibitor provides direct evidence for the role of heparan sulfate and suggests a new treatment strategy. Faseb J. 2004;18(14):1749–1751. doi:10.1096/fj.03-1436fje.
- Dember LM, Hawkins PN, Hazenberg BPC, et al. Eprodisate for the treatment of renal disease in AA amyloidosis. N Engl J Med. 2007;356(23):2349–2360. doi:10.1056/NEJMoa065644.
- Rumjon A, Coats T, Javaid MM. Review of eprodisate for the treatment of renal disease in AA amyloidosis. Int J Nephrol Renovasc Dis. 2012;5:37.
- Papa R, Lachmann HJ. Secondary, AA, amyloidosis. Rheum Dis Clin North Am. 2018;44(4):585–603. doi:10.1016/j.rdc.2018.06.004.
- Kluve-Beckerman B, Liepnieks JJ, Wang L, et al. A cell culture system for the study of amyloid pathogenesis. Amyloid formation by peritoneal macrophages cultured with recombinant serum amyloid A. Am J Pathol. 1999;155(1):123–133. doi:10.1016/S0002-9440(10)65107-3.
- Puscalau-Girtu I, Scheller JS, Claus S, et al. Cell assay for the identification of amyloid inhibitors in systemic AA amyloidosis. Amyloid. 2019;26(1):24–33. doi:10.1080/13506129.2019.1568978.
- Lundmark K, Shariatpanahi AV, Westermark GT. Depletion of spleen macrophages delays AA amyloid development: a study performed in the rapid mouse model of AA amyloidosis. PLoS One. 2013;8(11):e79104. doi:10.1371/journal.pone.0079104.
- Takahashi M, Yokota T, Kawano H, et al. Ultrastructural evidence for intracellular formation of amyloid fibrils in macrophages. Virchows Arch A Pathol Anat Histopathol. 1989;415(5):411–419. doi:10.1007/BF00747742.
- Shirahama T, Miura K, Ju ST, et al. Amyloid enhancing factor-loaded macrophages in amyloid fibril formation. Lab Invest. 1990;62(1):61–68.
- Claus S, Meinhardt K, Aumüller T, et al. Cellular mechanism of fibril formation from serum amyloid A1 protein. EMBO Rep. 2017;18(8):1352–1366. doi:10.15252/embr.201643411.
- Shirahama T, Cohen AS. Intralysosomal formation of amyloid fibrils. Am J Pathol. 1975;81:101.
- Kollmer M, Meinhardt K, Haupt C, et al. Electron tomography reveals the fibril structure and lipid interactions in amyloid deposits. Proc Natl Acad Sci U S A. 2016;113(20):5604–5609. doi:10.1073/pnas.1523496113.
- Claus S, Puscalau-Girtu I, Walther P, et al. Cell-to-cell transfer of SAA1 protein in a cell culture model of systemic AA amyloidosis. Sci Rep. 2017;7(1):45683. doi:10.1038/srep45683.
- Forssmann W-G, Schulz-Knappe P, Meyer M, et al. Peptide chemistry 1992 : proceedings of the 2nd Japan Symposium on Peptide Chemistry November 9-13, 1992, Shizuoka, Japan. ESCOM; 1993.
- Schulz-Knappe P, Schrader M, Ständker L, et al. Peptide bank generated by large-scale preparation of circulating human peptides. J Chromatogr A. 1997;776(1):125–132. doi:10.1016/s0021-9673(97)00152-0.
- Münch J, Ständker L, Forssmann WG, et al. Discovery of modulators of HIV-1 infection from the human peptidome. Nat Rev Microbiol. 2014;12(10):715–722. 2014;12:doi:10.1038/nrmicro3312.
- Eberle J, Wiehe RS, Gole B, et al. A fibrinogen alpha fragment mitigates Chemotherapy-Induced MLL rearrangements. Front Oncol. 2021;11:689063. doi:10.3389/fonc.2021.689063.
- Brauer F, Schmidt K, Zahn RC, et al. A rationally engineered anti-HIV peptide fusion inhibitor with greatly reduced immunogenicity. Antimicrob Agents Chemother. 2013;57(2):679–688. doi:10.1128/AAC.01152-12.
- Gill SC, von Hippel PH. Calculation of protein extinction coefficients from amino acid sequence data. Anal Biochem. 1989;182(2):319–326. doi:10.1016/0003-2697(89)90602-7.
- Dopler A, Guntau L, Harder MJ, et al. Self versus nonself discrimination by the soluble complement regulators factor H and FHL-1. J Immunol. 2019;202(7):2082–2094. doi:10.4049/jimmunol.1801545.
- Frank R. Spot-synthesis: an easy technique for the positionally addressable, parallel chemical synthesis on a membrane support. Tetrahedron. 1992;48(42):9217–9232. doi:10.1016/S0040-4020(01)85612-X.
- Cox J, Mann M. MaxQuant enables high peptide identification rates, individualized p.p.b.-range mass accuracies and proteome-wide protein quantification. Nat Biotechnol. 2008;26(12):1367–1372. doi:10.1038/nbt.1511.
- Wu Z, Roberts DS, Melby JA, et al. MASH explorer: a universal software environment for Top-Down proteomics. J Proteome Res. 2020;19(9):3867–3876. doi:10.1021/acs.jproteome.0c00469.
- Niedermeyer THJ, Strohalm M. mMass as a software tool for the annotation of cyclic peptide tandem mass spectra. PLoS One. 2012;7(9):e44913. doi:10.1371/journal.pone.0044913.
- Ragland SA, Criss AK. From bacterial killing to immune modulation: recent insights into the functions of lysozyme. PLoS Pathog. 2017;13(9):e1006512. doi:10.1371/journal.ppat.1006512.
- Bruinsma IB, Karawajczyk A, Schaftenaar G, et al. A rational design to create hybrid β-sheet breaker peptides to inhibit aggregation and toxicity of amyloid-β. Medchemcomm. 2011;2(1):60–64. doi:10.1039/C0MD00213E.
- Tjernberg LO, Näslund J, Lindqvist F, et al. Arrest of beta-amyloid fibril formation by a pentapeptide ligand. J Biol Chem. 1996;271(15):8545–8548. doi:10.1074/jbc.271.15.8545.
- Soto C, Kindy MS, Baumann M, et al. Inhibition of alzheimer’s amyloidosis by peptides that prevent beta-sheet conformation. Biochem Biophys Res Commun. 1996;226(3):672–680. doi:10.1006/bbrc.1996.1413.
- Pepys MB, Hawkins PN, Booth DR, et al. Human lysozyme gene mutations cause hereditary systemic amyloidosis. Nature. 1993;362(6420):553–557. 1993;362:doi:10.1038/362553a0.
- Anker S, Hinderhofer K, Baur J, et al. Lysozyme amyloidosis—a report on a large german cohort and the characterisation of a novel amyloidogenic lysozyme gene variant. Amyloid. 2022;29(4):245–254. doi:10.1080/13506129.2022.2072198.
- Canet D, Last AM, Tito P, et al. Local cooperativity in the unfolding of an amyloidogenic variant of human lysozyme. Nat Struct Biol. 2002;9(4):308–315. doi:10.1038/nsb768.
- Vettore N, Moray J, Brans A, et al. Characterisation of the structural, dynamic and aggregation properties of the W64R amyloidogenic variant of human lysozyme. Biophys Chem. 2021;271:106563. doi:10.1016/j.bpc.2021.106563.
- Morozova-Roche LA, Zurdo J, Spencer A, et al. Amyloid fibril formation and seeding by Wild-Type human lysozyme and its Disease-Related mutational variants. J Struct Biol. 2000;130(2-3):339–351. doi:10.1006/jsbi.2000.4264.
- Luo J, Wärmländer SKTS, Gräslund A, et al. Human lysozyme inhibits the in vitro aggregation of Aβ peptides, which in vivo are associated with Alzheimer’s disease. Chem Commun (Camb). 2013;49(58):6507–6509. doi:10.1039/c3cc42325e.
- Luo J, Wärmländer SKTS, Gräslund A, et al. Non-chaperone proteins can inhibit aggregation and cytotoxicity of alzheimer amyloid β peptide. J Biol Chem. 2014;289(40):27766–27775. doi:10.1074/jbc.M114.574947.
- Brouwer J, van Leeuwen-Herberts T, de Ruit M V Determination of lysozyme in serum, urine, cerebrospinal fluid and feces by enzyme immunoassay. Clin Chim Acta. 1984;142(1):21–30. doi:10.1016/0009-8981(84)90097-4.
- Torsteinsdóttir I, Håkansson L, Hällgren R, et al. Serum lysozyme: a potential marker of monocyte/macrophage activity in rheumatoid arthritis. Rheumatology. 1999;38(12):1249–1254. doi:10.1093/rheumatology/38.12.1249.
- Gordon S, Todd J, Cohn ZA. In vitro synthesis and secretion of lysozyme by mononuclear phagocytes. J Exp Med. 1974;139(5):1228–1248. doi:10.1084/jem.139.5.1228.