
Abstract
Background
Neurofilament light chain (NfL) has emerged as a sensitive biomarker in hereditary transthyretin amyloid polyneuropathy (ATTRv-PN). We hypothesise that NfL can identify conversion of gene carriers to symptomatic disease, and guide treatment approaches.
Methods
Serum NfL concentration was measured longitudinally (2015–2022) in 59 presymptomatic and symptomatic ATTR variant carriers. Correlations between NfL and demographics, biochemistry and staging scores were performed as well as longitudinal changes pre- and post-treatment, and in asymptomatic and symptomatic cohorts. Receiver-operating analyses were performed to determine cut-off values.
Results
NfL levels correlated with examination scores (CMTNS, NIS and MRC; all p < .01) and increased with disease severity (PND and FAP; all p < .05). NfL was higher in symptomatic and sensorimotor converters, than asymptomatic or sensory converters irrespective of time (all p < .001). Symptomatic or sensorimotor converters were discriminated from asymptomatic patients by NfL concentrations >64.5 pg/ml (sensitivity= 91.9%, specificity = 88.5%), whereas asymptomatic patients could only be discriminated from sensory or sensorimotor converters or symptomatic individuals by a NfL concentration >88.9 pg/ml (sensitivity = 62.9%, specificity = 96.2%) However, an NfL increment of 17% over 6 months could discriminate asymptomatic from sensory or sensorimotor converters (sensitivity = 88.9%, specificity = 80.0%). NfL reduced with treatment by 36%/year and correlated with TTR suppression (r = 0.64, p = .008).
Conclusions
This data validates the use of serum NfL to identify conversion to symptomatic disease in ATTRv-PN. NfL levels can guide assessment of disease progression and response to therapies.
Introduction
Hereditary transthyretin amyloidosis (ATTRv) represents a life-threatening multisystem disorder with varying cardiac and neurological manifestations [Citation1,Citation2]. ATTRv is caused by pathogenic variants in the transthyretin (TTR) gene causing the transthyretin protein to dissociate, misfold and deposit in multiple organs and tissues, leading to organ dysfunction [Citation1,Citation3]. ATTRv is present worldwide, with endemic pockets, and is inherited in an autosomal dominant manner. However, incomplete penetrance, varying age of onset and organ manifestations, both within and between families, makes prediction of the age of disease onset challenging [Citation1]. This is particularly important due to advances in disease modifying therapies over the last 5 years, which have the capacity to dramatically suppress TTR production, thereby slowing or halting progression, and improving outcomes and quality of life of affected individuals [Citation4–6]. Recent studies have identified that early commencement of targeted treatments can significantly limit the development of more severe disease stages [Citation1,Citation4,Citation7,Citation8]. However, patients with early disease may either have no neuropathy symptoms or signs, or clinical features which cannot be easily quantified by current tools [Citation9,Citation10]. As a result, sensitive biomarkers, particularly those which might indicate early disease, are required to identify neuropathy disease onset and progression.
Neurofilament light chain (NfL) has emerged as a potential biomarker of neuropathy both in hereditary transthyretin amyloidosis and other neurological conditions [Citation11–16]. The neurofilaments are constituent scaffolding proteins of the axonal cytoskeleton [Citation11,Citation17] and are released into the blood in response to axonal damage or degeneration [Citation11,Citation18]. NfL can be reliably quantified at extremely low concentrations in the blood using highly sensitive methods, such as digital immunoassay on the Single molecule array (Simoa) platform (Quanterix, Billerica, USA) [Citation11,Citation18].
An ideal biomarker should have the capacity to non-invasively and reliably detect early disease with both sensitivity and specificity, alter with disease progression and respond to treatment [Citation19]. To date, studies have indicated that NfL may be useful to monitor disease progression, severity, and treatment response in ATTRv. Specifically, NfL is increased in individuals with symptomatic neuropathy when compared to healthy controls [Citation12–16] and asymptomatic carriers [Citation14,Citation15,Citation20]. In addition, NfL correlates with clinical [Citation13–16,Citation20] and electrophysiological [Citation16,Citation20] measures of disease severity. Furthermore, treatment trials, have demonstrated a reduction in NfL with gene silencing treatment compared to those on placebo [Citation12,Citation21]. However, longitudinal assessments of NfL in asymptomatic and symptomatic cohorts and appropriate cut-off values for transition to symptomatic disease have yet to be established.
As such, the present series aimed to evaluate the use of serum NfL using the Simoa platform in a cohort of asymptomatic and symptomatic ATTRv gene carriers. In addition to validation of studies using a real-life cohort, NfL was assessed longitudinally to quantitate change over time, to propose appropriate NfL cut-off values for conversion to symptomatic disease and to evaluate change in NfL with treatment in a real-life cohort.
Materials and methods
Participants
Patients with suspected or diagnosed neuropathy due to ATTRv amyloidosis, or asymptomatic carriers of a neuropathic variant, reviewed at both the National Hospital of Neurology and Neurosurgery (NHNN), Queen Square and the National Amyloidosis Centre (NAC), Royal Free Hospital, between 2015 and 2022, who had a stored serum sample at the time of clinical review were included in the study. Patients were excluded if neuropathy was due to an alternate cause. Local ethics committees at each site approved the study and all participants provided written informed consent (sample storage at NAC under BioAmyloid IRAS 256590; data is published under the ethics INC REC: 09/H0716/61).
Clinical characteristics
Patient characteristics and clinical scores were recorded at NHNN clinical visits as part of routine care. Age, gender, ATTRv mutation and clinical phenotypic characteristics were documented. Rating scales including the validated polyneuropathy disability scale (PND 0–4, higher score more affected), Coutinho/Familial Amyloid Polyneuropathy (FAP) stage (0–3, higher score more affected), neuropathy impairment score (NIS; range 0–244, higher score more affected), and lower limb subset (NIS-LL, range 0- 88, higher score more affected), Medical Research Council score (MRC; range 0–70, higher score less affected) and Rasch-modified CMT symptom score (SS, range 0–12), symptoms and examination score (ES, range:0–28) and the composite score of symptoms, signs and neurophysiology (NS, range 0–36, higher score more affected) scores and Norfolk quality of life diabetic neuropathy score (Norfolk-QOL-DN; −4–136; higher more affected) were recorded [Citation22–30].
Prior to 2018, MRC scores and CMT scores were routinely performed and after MRC scores, CMT scores, NIS, NIS-LL and Norfolk QOL-DN assessments were performed. If comprehensive documentation was available NIS and NIS-LL scores were recalculated for patients between 2015 and 2018 by a single author (A.S.C). These retrospective calculations likely underestimate the neuropathy, with the default of reduced sensation or reflexes being utilised, unless clearly stipulated as absent in clinical documentation.
Retrospective blood samples
Serum blood samples were serially stored at the time of review at the NAC. Samples were spun within 4 h, before storage in −30 °C freezers where they were kept until transportation to UCL for testing. Routine biochemistry, including tests of renal function (creatinine and eGFR) was undertaken on blood obtained at the same draw as that for storage of serum. On occasion concurrent transthyretin (TTR; prealbumin) was undertaken on the same blood sample.
Neurofilament testing
NfL concentration was measured according to manufacturer’s instructions on blinded samples using the Simoa™ platform and HD-X Analyser (Quanterix, Billerica, MA) as previously described (Supplementary appendix) [Citation31]. Samples were duplicated, to ensure internal reliability, and NfL concentrations (pg/ml) were defined using a standard curve fitted using a 4-parameter logistic algorithm. All samples were tested concurrently in one batch using the same reagents. Coefficients of variation, both intra- and inter-assay, were demonstrated to be <20%.
Statistics
The duration of follow-up was defined as the time between the first and last available serum sample, with a data cut-off of 15th September 2022. For descriptive analyses the earliest pre-treatment time point was used with a complete data set. Age, NfL, NIS, NIS-LL, MRC, CMTSS, CMTES and CMTNS were not normally distributed, as such these variables are presented as medians and interquartile ranges, and difference between mutation groups (T60A, V30M and “Other”) were assessed by independent-samples Kruskal-Wallis tests. Differences between PND and FAP stages, gender and mutation status was assessed via a Chi-squared test. Creatinine and eGFR were normally distributed, after 2 outlier values were excluded (1 T60A, 1 V30M), and differences between the means was assessed by ANOVA.
For cross-sectional analyses the earliest pre-treatment time point was used with a complete data set. NfL was normally distributed after log-transformation, and hence log-transformed NfL was used for subsequent analyses. A student’s t-test was used to compare log(NfL) and gender and further correlations between log(NfL), age, blood parameters and examination scores were performed by Pearson’s correlations. As no baseline variables (age, gender, Creatinine, eGFR) were found to affect NfL levels, ANOVA with Tukey’s post-hoc tests were performed to assess for differences between log(NfL) across the PND and FAP scores. The cross-sectional diagnostic performance of NfL was evaluated by the area under the curve (AUC) derived from receiver operating characteristics (ROC) with calculation of the Youden index to determine the optimal cut off value to discriminate PND 0 from PND 1 and above, and PND 0 and 1 from PND 2 and above.
For longitudinal analyses, we identified four groups: Asymptomatic (A), Symptomatic (S), Sensory converters (SC) and Sensorimotor converters (MC). Individuals were characterised as asymptomatic (A) if they remained asymptomatic throughout the follow-up period with PND 0, MRC 70 and NIS 0. Symptomatic individuals (S) had evidence of a symptomatic neuropathy at baseline, with NIS > 5 or MRC score < 70 and PND score of 1 or above. An individual was categorised as a sensory converter (SC), if they were asymptomatic at initial review and during follow-up transitioned from PND or FAP scores of 0 to 1, NIS 0 to > 0 and maintained an MRC score of 70. Sensorimotor converters (MC) were individuals who were asymptomatic at baseline and converted from a PND score of 0 or 1 to a score of ≥ 2 and developed muscle weakness (MRC score < 70).
Using mixed-effect models, we explored longitudinal NfL changes prior and in response to treatment. For pre-treatment models, time 0 was defined as the time of first available sample, and all samples were included up until treatment commencement. We analysed NfL changes prior to treatment using linear mixed-effects models to account for the correlation between repeated measurements in each participant. The specified fixed-effects, interaction terms and random factors, as well as the formula for the statistical model is shown in the supplementary appendix. The longitudinal diagnostic performance of NfL was evaluated by AUC, ROC and Youden Indices to define NfL cut-off values to discriminate A from SC, MC and S; A and SC from MC and S; and A from MC and S.
For post-treatment analyses, time 0 was defined as the date of treatment commencement. Individuals were included if they had at least one sample within 6 months prior to treatment commencement, and at least one NfL sample 6 months after treatment commencement. Pearson’s correlations were performed to evaluate if the change in NfL after treatment was correlated with the change in TTR levels (most recent post-treatment/baseline pre-treatment value for both NfL and TTR) over the same time interval. Differences between change in NfL (most recent post-treatment/baseline pre-treatment NfL) and TTR suppression was performed by Kruskal-Wallis and Mann-Whitney U tests, after dividing groups into <50%, 50–80% and >80% TTR suppression. Pearson’s correlations were performed to assess for a relationship between change in NfL and NIS, NIS-LL, MRC, CMTSS, CMTES, CMTNS.
In order to assess whether NfL is responsive to treatment, longitudinal analyses were conducted; only individuals with greater than 50% TTR suppression over time, with at least two time points separated by at least 6 months were included. We analysed NfL changes post-treatment using linear mixed-effects models to account for the correlation between repeated measurements in each participant. The fixed-effects and random factors, as well as the formula for the statistical model is shown in the supplementary appendix.
Statistical analyses were performed in R or SPSS (version 25). For all analyses statistical significance was defined as a p < .05.
Results
Clinical demographics
We identified 59 patients with neuropathy associated with ATTRv-PN or carriers of a ATTRv gene variant seen at both NHNN and NAC between 2015 and 2022. One patient (TTRT60A) was excluded from the initial cross-sectional analysis, as all samples were post-treatment.
Varying ATTRv mutations were seen in the 59 included patients, including 26 patients with TTRT60A, 12 with TTRV30M and 22 with “Other” variants including: 4 with TTRG47V, 3 with TTRV122I, 3 with TTRS77Y, 2 with TTRA97S and 1 individual with each of TTRS23N, TTRE42D, TTRH90D, TTRA120S, TTRE54G, TTRR34G, TTRE89K, TTRI107V and TTRF33I. The mean age was 62.2 years (range 33.2 − 79.5). Baseline characteristics for the complete cohort, and according to mutation, are shown in . Across the ATTR variant groups, T60A, V30M and “Other”, there were no differences in age, gender, creatinine, eGFR, PND, FAP, NIS, NIS-LL, MRC, CMTSS, CMTES or CMTNS scores ().
Table 1. Baseline characteristics.
Functional assessment
Cross-sectional analyses identified no correlation between log(NfL) and age (r = 0.08, p = .54), eGFR (r = 0.04, p = .79) or creatinine (r = –0.09, p = .52); Supplementary figure 1A-C). Of note, there were two outliers with Creatinine levels > 400 (1 patient with TTRV30M and another with TTRT60A) when these outliers were removed, no correlation between creatinine and NfL was identified (r = –0.01, p = .94); Supplementary figure 1D). NfL did not significantly differ between sexes (p = .49), or by genetic variant (p = .1; Supplementary figure 2A-B). As such, these variables were excluded as covariates in subsequent analyses.
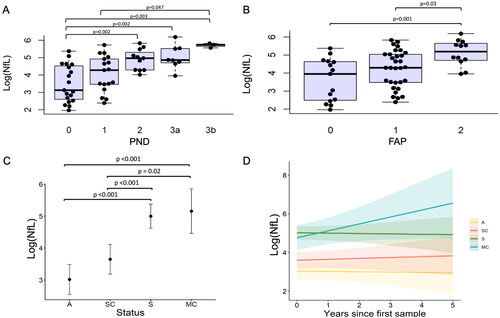
Baseline NfL levels correlated with NIS (r = 0.5, p = .001), NIS-LL (r = 0.51, p < .001), CMTSS (r = 0.47, p = .004), CMTES (r = 0.51, p = .002), CMTNS (r = 0.56, p = .002) and MRC scores (r = −0.57, p < .001; Figure 1A-F, respectively), but not with Norfolk QOL-DN (r = 0.22, p = .45; Supplementary figure 3). In keeping with correlations that baseline NfL levels increased with disease severity, statistically significant differences were observed in NfL levels between PND0 and PND2 (p = .002), PND3A (p = .002) and PND3B (p = .003), and PND1 and PND3B (p = .047; ) cohorts. Similarly, significant differences in NfL were seen between FAP2 and FAP0 (p = .001) and FAP1 (p = .03; ). Receiver operating characteristic analysis disclosed that NfL levels > 52.2 pg/ml discriminated patients with PND2 or above, from PND0 and 1 (AUC = 0.83; 95% CI 0.71–0.95) with a sensitivity of 100% and specificity of 55.5% (, Supplementary figure 4).
Figure 1. Correlations between logged neurofilament light chain concentrations (log(NfL), pg/ml) and examination scores (A-F). A: Neuropathy impairment score (NIS), B: Neuropathy impairment score, lower limb subset (NIS-LL), C: Rasch-modified Charcot-Marie-Tooth symptom score CMTSS), D: Rasch-modified Charcot-Marie-Tooth symptom and examination score (CMTES), E: Rasch-modified Charcot-Marie-Tooth neuropathy composite score (CMTNS) and F: Medical Research Council score (MRC).
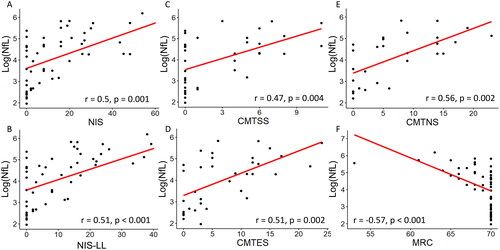
Figure 2. Serum neurofilament light chain (NfL) increases with disease severity (A-B) and with transition to symptomatic disease (C-D). A-B: Baseline logged neurofilament light chain (log(NfL), pg/ml) increases with increasing peripheral neuropathy disability (PND) scores (A) and familial amyloid polyneuropathy (FAP) stage (B). Black circles indicate raw data values. C-D: Longitudinal evaluation of logged neurofilament light chain (log(NfL), pg/ml) levels according to clinical group as assessed by generalised linear mixed model. C: Differences in log(NfL) over time can be distinguished by group status demonstrating significant increases in symptomatic and sensorimotor converters irrespective of time, when compared to asymptomatic and sensory converting patients, D: Longitudinal changes (years) in log(NfL) according to group status, where A: Asymptomatic (yellow), SC: Sensory converters (red), MC: Sensorimotor converters (aqua) and S: Symptomatic (green) groups.
Individuals were characterised as asymptomatic (A) if they remained asymptomatic throughout the follow-up period with PND 0, MRC 70 and NIS 0. Symptomatic individuals (S) had evidence of a symptomatic neuropathy at baseline and throughout the follow-up period, with NIS > 5 or MRC score < 70 and PND score of 1 or above at baseline. An individual was categorised as a sensory converter (SC), if they were asymptomatic at initial review and during follow-up they transitioned from PND or FAP scores of 0 to 1, NIS 0 to > 0 and maintained an MRC score of 70. Sensorimotor converters (MC) were individuals who were asymptomatic at baseline and converted from a PND score of 0 or 1 to a score of ≥ 2 and developed muscle weakness (MRC score < 70).
Utility as a longitudinal disease marker
A total of 173 longitudinal samples, prior to and after treatment, were available for 50 individuals, with varying sample numbers from 2 to 9, over a maximal follow-up of 4.75 years. Prior to treatment, a total of 121 samples were available, including 2–5 samples per person (Mean 2.8 (1.9–3.7)), in 43 individuals over an average of 2.0 years (SD 0.8–3.1 years). At baseline 27 individuals were asymptomatic and 16 were symptomatic. During the follow-up period 11 remained asymptomatic (A), 5 converted to a sensorimotor neuropathy (MC), 11 converted to sensory neuropathy (SC) and 16 remained symptomatic (S).
Baseline characteristics according to disease progression groups are presented in . There were no significant differences in age, gender, creatinine or eGFR between groups. At baseline the NIS (p < .0001), NIS-LL (p < .0001), MRC (p < .0001), CMTSS (p = .003), CMTES (p = .001), CMTNS (p = .005) and NfL (p < .0001) significantly differed between the groups (). Specifically, the asymptomatic and sensory converters had significantly lower NIS, NIS-LL, MRC, CMTSS, CMTES, CMTNS and NfL levels (all p < .01) than the symptomatic group (). The sensorimotor converters had significantly lower NIS (p = .01), NIS-LL (p = .01), MRC (p = .01) and CMTSS (p = .05) than the symptomatic group, but not CMTES, CMTNS or NfL levels (). Sensory converters did not differ from the asymptomatic group or sensorimotor converters across any parameter. The asymptomatic group had significantly lower NfL levels at baseline than the sensorimotor converters (p = .002) but did not differ in any other clinical parameter. Compared to the asymptomatic cohort, baseline NfL levels were 2.5-fold higher in sensory converters, 7.4-fold higher in sensorimotor converters and 9.3-fold higher in the symptomatic cohort.
Table 2. Baseline characteristics of longitudinal groups.
The mixed-effects model of NfL change over time demonstrated that, irrespective of time, NfL was higher in the symptomatic cohort and sensorimotor converters, than in the asymptomatic cohort or sensory converters (all p < .001; , Supplementary table S1-2). The NfL was observed to rise over time most rapidly in the sensorimotor converter group, more so than the sensory converter group, although this did not reach significance (p = .08; , Supplementary table S1-2). NfL increased by an average of 7.14% each year in sensorimotor converters, and by 0.95% in sensory converters. NfL levels remained relatively stable in the asymptomatic and symptomatic groups over time (). Individual NfL trajectories are displayed in Supplementary figure S5.
NfL concentration at baseline of greater than 64.5 pg/ml discriminated symptomatic and sensorimotor converters from asymptomatic or sensory converter groups with a sensitivity of 91.9% and specificity of 78.7% (AUC = 0.87; 95% CI 0.81–0.94; , Supplementary figure S6A). Similarly, NfL levels greater than 64.5 pg/ml discriminated asymptomatic individuals from sensorimotor converters or symptomatic individuals with a sensitivity of 92.0% and specificity of 88.5% (AUC 0.95 95% CI: 0.90–0.99; , Supplementary Figure S6B). Asymptomatic individuals could be discriminated from sensory converters, sensorimotor converters or symptomatic individuals using a cut off of 88.9 pg/ml with sensitivity of 62.9% and specificity of 96.2% (AUC0.84, 95% CI: 0.77–0.91; , Supplementary Figure S6C).
Table 3. NfL cut-off values: sensitivity and specificity.
In individuals with two samples separated by 6 months (n = 14), relative change in NfL was explored in asymptomatic individuals and those converting to either a sensory or sensorimotor neuropathy (SC and MC). An increase in NfL by a factor of 1.17, or by 17%, could discriminate asymptomatic individuals from sensory or sensorimotor converters with a sensitivity of 88.9% and specificity of 80% (AUC 0.89, 95% CI 0.71–1.00, , Supplementary Figure S6D).
After treatment with a gene silencer, a total of 58 samples were available, including a range of 2 − 10 samples per person (mean 4.5, SD 2.1–6.9), from 13 individuals over an average of 1.63 years (SD 0.62–2.64). Four individuals did not respond clinically to the initial treatment and as such their treatment was altered. In these individuals the NfL level increased during the treatment period (e.g. Supplementary Figure S7A-B) with concordant stability or increases in TTR levels. As such, where both TTR and NfL levels were available, the change in NfL after treatment (post-treatment/last value pre-treatment) was correlated with the change in TTR levels over the same time interval. This demonstrated a significant positive correlation (r = 0.64, p = .008) with greater TTR suppression correlating with a reduction in NfL levels (<1) and reduced TTR suppression or/an increase in TTR levels resulting in a rise in NfL (>1) (). Despite the small number of patients, a greater reduction in NfL was associated with greater TTR suppression (p = .03, ). Specifically, a significantly greater reduction in NfL was found in patients with >80% TTR suppression than those with <50% TTR suppression. No significant differences in the change in NfL were found between individuals with <50% or 50–80% TTR suppression (p = .86).
Figure 3. Post-treatment alterations in neurofilament light chain (NfL). A: Change in NfL correlates with change in transthyretin (TTR). Change in NfL and TTR are both calculated as recent post-treatment concentration divided by baseline pre-treatment concentration; B: Greater reduction in NfL (<1: reduction, >1: increase) is found with increasing TTR suppression (%). C: Longitudinal evaluation (years) of logged neurofilament light chain (log(NfL), pg/ml) concentration after effective treatment (>50% TTR suppression) as assessed by generalised linear mixed model. Black circles indicate raw data values.
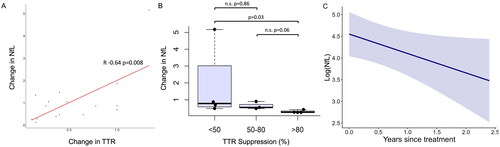
In order to evaluate if NfL reduced with effective treatment, we conservatively included only those with greater than 50% TTR suppression over time with at least two time points separated by at least 6 months. Eight individuals remained with a total of 37 samples. NfL levels reduced on average by 3.11 times (range 1.81–7.59). The change in NfL did not correlate with baseline NIS (r = −0.2, p-.66), NIS-LL (r = −0.3, p = .47), MRC (r = 0.25, p = .55) CMTSS (r = 0.04, p-.93), CMTES (r = 0.09, p = .84) or CMTNS (R = 0.04, p = .92; Supplementary figures S8A-F). The mixed-effects model revealed that in individuals with greater than 50% TTR suppression, the log(NfL) level reduced significantly over time (p = .048, log(coefficient) =-0.45, , Supplementary Table 2). This equates to the NfL decreasing each year, by a factor of 0.64, or 36%. Individual NfL trajectories post-treatment are displayed in Supplementary figure S9.
Discussion
This study validates the use of serum NfL in a genetically heterogeneous, real-life ATTRv population to monitor disease onset, progression, and response to treatment, and suggests absolute and relative cut-off values to predict transition from asymptomatic to symptomatic disease. Our findings corroborate previous studies describing the utility of NfL as a marker of severity of neuropathy, finding consistent increases in NfL with both increasing PND and FAP scores [Citation12,Citation14,Citation15]. Furthermore, this data confirms the external validity of NfL as a biomarker, correlating well with neuropathy examination scores [Citation13,Citation16,Citation20].
NfL is widely reported to increase with age in patients and controls [Citation14,Citation32–34], with age-adjusted reference values of NfL levels developed [Citation33,Citation35]. However, similar to some previous studies in ATTRv [Citation12,Citation15], this present study did not identify a correlation between NfL and age. It has been suggested that disease stage and the corresponding axonal degeneration, in ATTRv have a much larger effect on NfL than age, and hence may mask the more moderate age-related increase [Citation14,Citation15]. In this study the mean NfL was 92.5 pg/ml, which is both higher than described in other neuropathies (CIDP 26–42 pg/ml, CMT 26 pg/ml) [Citation34,Citation36–38] and seen in other studies of ATTRv (81.8 pg/ml [Citation16] 69.4 pg/ml [Citation12], 66.4 pg/ml [Citation15], 58.1 pg/ml [Citation13]). While the severity of neuropathy in our cohort is difficult to directly compare to previous studies, the higher NfL may suggest a greater overall severity of disease, which may further mask the effect of age in this population.
The present study extends our knowledge of NfL dynamics in ATTRv by evaluating longitudinal changes in NfL. Interestingly, in individuals indistinguishable on clinical grounds who would remain asymptomatic or convert to a sensory or sensorimotor neuropathy during follow up, the baseline NfL was significantly higher in sensorimotor converters, suggesting that NfL can be used as an early biomarker of disease onset and progression. At baseline the NfL levels in these sensorimotor converters were similar to those who were symptomatic, and the elevation in NfL was persistent irrespective of time. Furthermore, the rate of NfL increase was increased in sensorimotor converters, compared to sensory converters, and was relatively static in those who were asymptomatic or symptomatic during follow-up. Taken together these findings suggest that not only can NfL be used as an early biomarker of disease onset and progression, but also that there is likely a continuum of NfL elevation with relatively stable levels seen in asymptomatic individuals, with lower rates of increase in sensory converters, and then more rapid rate of NfL increase in sensorimotor converters which then plateaus in symptomatic individuals; this parallels the progression of disease observed clinically, with greater axonal loss observed progressively as an individual transitions through the PND stages, clinically from asymptomatic, to small and then large fibre sensory neuropathy to sensorimotor neuropathy [Citation39]. The plateau in NfL concentrations observed in symptomatic individuals may reflect reaching a steady state of axonal loss, as has been observed in other longitudinal studies of inherited neuropathies such as CMT1A and HSN1 [Citation40].
Whilst the utility of NfL as a biomarker has become clear, cut-off values to predict transition to symptomatic disease are yet to be established. Maia et al. proposed a cut-off value in a young cohort of V30M patients of 10.6 pg/ml (sensitivity 96.2% and specificity of 93.8%) to distinguish between PND0 and PND1 patients [Citation14]. However, as observed in this (14.3 pg/ml), and many previous studies in ATTRv, the proposed NfL cut-off value is frequently lower than the NfL observed in control or asymptomatic cohorts (15.5 − 22.9 pg/ml) [Citation12,Citation13,Citation16,Citation41]. The lower values in this early onset V30M cohort may reflect both the direct effect of age and the lower likelihood of comorbidities increasing NfL in a younger cohort. In distinguishing those with PND1 from PND2 cut-off values of 66.9 pg/ml (sensitivity 61.5% and specificity 92.3%) or 75.7 pg/ml (sensitivity 84.6% specificity 80%), were suggested in both early- and later-onset V30M cohorts, respectively [Citation14]. These findings more closely align with our data suggesting a cut off of 52.2 pg/ml could be used to distinguish PND 0-1 from PND ≥2 (sensitivity 100%, specificity 55.5%). Ticau et al. proposed a slightly lower cut off of 37 pg/ml (sensitivity of 84.9%, specificity 96.4%), however, it should be noted that this distinguished those with ATTRv-PN from healthy controls, rather than from asymptomatic carriers [Citation12]. Altogether, however, these values are limited due to the cross-sectional nature of the data.
As such, in attempts to overcome this limitation, we investigated cut off values in our longitudinal dataset. At baseline when indistinguishable clinically on the basis of PND, FAP, NIS, or MRC scores, an absolute cut off value of 64.5 pg/ml could distinguish both asymptomatic, or asymptomatic and sensory converters, from sensorimotor converters or symptomatic individuals with sensitivities of 91.9% and 92% and specificities of 78.7% and 88.5%, respectively. Whereas a cut off value of 88.9 pg/ml was able to distinguish asymptomatic individuals from sensory or sensorimotor converters and symptomatic individuals, albeit, with a lower sensitivity of 62.9% and specificity of 96.2%. However, a relative increase of 17% was able to distinguish individuals who were asymptomatic from those converting to a sensory or sensorimotor neuropathy with sensitivity of 88.9% and specificity of 80%. Thus, taken together, our data suggests that a single NfL value of greater than 64.5 pg/ml, or an increase in NfL concentration of 17% or more over 6 months could reflect transition to symptomatic disease.
A wide variety of ATTR variants were included in the population studied, reflecting the heterogeneity of ATTRv observed in the UK. It remains unclear if NfL levels may differ across ATTRv variants when confounding factors such as age of onset and comorbidities are removed.
The present study also demonstrates that in individuals receiving effective treatment, NfL reduces, validating the use of NfL to monitor treatment response. This finding was observed regardless of the disease severity at baseline, demonstrating that gene silencing therapies are efficacious across the spectrum of disease severity in ATTRv. Our data also indicates the importance of monitoring TTR suppression in practice, in individuals on gene silencers, and establishes that changes in TTR levels positively correlates with the change in NfL. Furthermore, despite the small patient numbers, the present study demonstrates that with greater TTR suppression, there is a greater reduction in NfL concentrations. This data provides validity to the recommendations suggested by Adams et al. suggesting that serum TTR (prealbumin) should be monitored at baseline and every 6 months in those commenced on gene silencers [Citation42].
Our study is limited by its retrospective design and the non-uniformity of follow-up time points. Furthermore, due to the stringency of our prescribed required time points, for follow-up periods post-treatment for example, the number of included samples was reduced, thus reducing the power of our analyses. Despite this we have identified coherent findings, which validate previous reports of the utility of NfL as an early biomarker of disease onset, progression and treatment response. Large, prospective longitudinal assessments of NfL are required to further validate the cut-off values proposed in this study.
Conclusions
In the present study, we have validated the use of NfL in a real-life cohort to monitor disease activity, finding that NfL correlates well with disease severity and examination scores. NfL was observed to increase longitudinally with progression from asymptomatic to symptomatic disease, with the most rapid rates of increase observed in those converting from asymptomatic to a sensorimotor neuropathy. We provide distinct, longitudinally derived cut-off values for conversion to symptomatic disease and demonstrate the utility of NfL as a treatment-responsive biomarker, while indicating the importance of monitoring TTR levels in patients on gene silencers to assess for adequate TTR suppression. While prospective longitudinal studies confirming our findings are required, the evidence for the utility of NfL as a useful disease biomarker is accumulating.
| Abbreviations | ||
| A | = | asymptomatic |
| ATTRv-PN | = | Hereditary transthyretin amyloidosis polyneuropathy |
| AUC | = | Area under the curve |
| CIDP | = | chronic inflammatory demyelinating polyradiculoneuropathy |
| CMT | = | Charcot-Marie-Tooth disease |
| CMT1A | = | Charcot-Marie-Tooth type 1A |
| CMTSS | = | Charcot-Marie-Tooth symptom subscore |
| CMTES | = | Charcot-Marie-Tooth symptom and examination subscore |
| CMTNS | = | Charcot-Marie-Tooth Neuropathy Score version 2 |
| eGFR | = | estimated glomerular filtration rate |
| FAP | = | Familial amyloidosis Polyneuropathy stage |
| HSN1 | = | Hereditary sensory neuropathy type 1 |
| MC | = | Sensorimotor converter |
| MRC | = | Medical research council power score |
| NIS | = | Neuropathy impairment score |
| NIS-LL | = | Neuropathy impairment score – lower limb subset |
| Norfolk-QOL-DN | = | Norfolk quality of life questionnaire – diabetic neuropathy |
| PND | = | polyneuropathy disability score |
| ROC | = | receiver operating characteristics |
| S | = | Symptomatic |
| SC | = | sensory converter |
| TTR | = | transthyretin or prealbumin. |
Supplemental Material
Download MS Word (17.4 KB)Supplemental Material
Download PDF (1.5 MB)Acknowledgements
MMR is grateful to the Medical Research Council (MRC MR/S005021/1), Wellcome Trust (G104817), National Institutes of Neurological Diseases and Stroke and office of Rare Diseases (U54NS065712 and 1UOINS109403-01), Muscular Dystrophy Association (MDA510281), Charcot Marie Tooth Association (CMTA), Harrington Discovery Institute, Alnylam Pharmaceuticals and Applied Therapeutics for their support. This research was also supported by the National Institute for Health Research University College London Hospitals Biomedical Research Centre. HZ is a Wallenberg Scholar supported by grants from the Swedish Research Council (#2022-01018 and #2019-02397), the European Union’s Horizon Europe research and innovation programme under grant agreement No 101053962, Swedish State Support for Clinical Research (#ALFGBG-71320), the Alzheimer Drug Discovery Foundation (ADDF), USA (#201809-2016862), the AD Strategic Fund and the Alzheimer’s Association (#ADSF-21-831376-C, #ADSF-21-831381-C, and #ADSF-21-831377-C), the Bluefield Project, the Olav Thon Foundation, the Erling-Persson Family Foundation, Stiftelsen för Gamla Tjänarinnor, Hjärnfonden, Sweden (#FO2022-0270), the European Union’s Horizon 2020 research and innovation programme under the Marie Skłodowska-Curie grant agreement No 860197 (MIRIADE), the European Union Joint Programme – Neurodegenerative Disease Research (JPND2021-00694), the National Institute for Health and Care Research University College London Hospitals Biomedical Research Centre, and the UK Dementia Research Institute at UCL (UKDRI-1003). MCK was supported by a Practitioner Fellowship from the National Health and Medical Research Council (#1156093).
Disclosure statement
ASC has served on advisory boards for Alnylam and has received travel support from Jansen. YR, LO’D, AJH and EV have no declarations. HZ has served at scientific advisory boards and/or as a consultant for Abbvie, Acumen, Alector, Alzinova, ALZPath, Annexon, Apellis, Artery Therapeutics, AZTherapies, Cognito Therapeutics, CogRx, Denali, Eisai, Merry Life, Nervgen, Novo Nordisk, Optoceutics, Passage Bio, Pinteon Therapeutics, Prothena, Red Abbey Labs, reMYND, Roche, Samumed, Siemens Healthineers, Triplet Therapeutics, and Wave, has given lectures in symposia sponsored by Alzecure, Biogen, Cellectricon, Fujirebio, Lilly, and Roche, and is a co-founder of Brain Biomarker Solutions in Gothenburg AB (BBS), which is a part of the GU Ventures Incubator Program (outside submitted work). SV, MCK and AMR have no declarations. JDG has served as an advisor for Alnylam, Ionis, ATTRalus, AZ, Intellia, Lycia, Bridgebio, Pfizer. MMR has served on a steering committee for BridgeBio Pharmaceuticals and consulted for Alnylam.
Additional information
Funding
References
- Carroll A, Dyck PJ, de Carvalho M, et al. Novel approaches to diagnosis and management of hereditary transthyretin amyloidosis. J Neurol Neurosurg Psychiatry. 2022;93(6):668–678. doi:10.1136/jnnp-2021-327909.
- Conceição I, González-Duarte A, Obici L, et al. Red-flag symptom clusters in transthyretin familial amyloid polyneuropathy. J Peripher Nerv Syst. 2016;21(1):5–9. Mar doi:10.1111/jns.12153.
- Sekijima Y. Transthyretin (ATTR) amyloidosis: clinical spectrum, molecular pathogenesis and disease-modifying treatments. J Neurol Neurosurg Psychiatry. 2015;86(9):1036–1043. doi:10.1136/jnnp-2014-308724.
- Coelho T, Maia LF, da Silva AM, et al. Long-term effects of tafamidis for the treatment of transthyretin familial amyloid polyneuropathy. J Neurol. 2013;260(11):2802–2814. Nov doi:10.1007/s00415-013-7051-7.
- Adams D, Gonzalez-Duarte A, O’Riordan WD, et al. Patisiran, an RNAi therapeutic, for hereditary transthyretin amyloidosis. N Engl J Med. 2018;379(1):11–21. doi:10.1056/NEJMoa1716153.
- Benson MD, Waddington-Cruz M, Berk JL, et al. Inotersen treatment for patients with hereditary transthyretin amyloidosis. N Engl J Med. 2018;379(1):22–31. doi:10.1056/NEJMoa1716793.
- Ericzon BG, Wilczek HE, Larsson M, et al. Liver transplantation for hereditary transthyretin amyloidosis: after 20 years still the best therapeutic alternative? Transplantation. 2015;99(9):1847–1854. Sep doi:10.1097/TP.0000000000000574.
- Plante-Bordeneuve V. Update in the diagnosis and management of transthyretin familial amyloid polyneuropathy. J Neurol. 2014;261(6):1227–1233. doi:10.1007/s00415-014-7373-0.
- Adams D, Cauquil C, Labeyrie C. Familial amyloid polyneuropathy. Curr Opin Neurol. 2017;30(5):481–489. doi:10.1097/WCO.0000000000000476.
- Conceição I, Costa J, Castro J, et al. Neurophysiological techniques to detect early small-fiber dysfunction in transthyretin amyloid polyneuropathy. Muscle Nerve. 2014;49(2):181–186. Feb doi:10.1002/mus.23901.
- Gaetani L, Blennow K, Calabresi P, et al. Neurofilament light chain as a biomarker in neurological disorders. J Neurol Neurosurg Psychiatry. 2019;90(8):870–881. Aug doi:10.1136/jnnp-2018-320106.
- Ticau S, Sridharan GV, Tsour S, et al. Neurofilament light chain as a biomarker of hereditary transthyretin-Mediated amyloidosis. Neurology. 2021;96(3):e412–e422. Jan 19 doi:10.1212/WNL.0000000000011090.
- Kapoor M, Foiani M, Heslegrave A, et al. Plasma neurofilament light chain concentration is increased and correlates with the severity of neuropathy in hereditary transthyretin amyloidosis. J Peripher Nerv Syst. 2019;24(4):314–319. doi:10.1111/jns.12350.
- Maia LF, Maceski A, Conceição I, et al. Plasma neurofilament light chain: an early biomarker for hereditary ATTR amyloid polyneuropathy. Amyloid. 2020;27(2):97–102. doi:10.1080/13506129.2019.1708716.
- Louwsma J, Brunger AF, Bijzet J, et al. Neurofilament light chain, a biomarker for polyneuropathy in systemic amyloidosis. Amyloid. 2021;28(1):50–55. Mar doi:10.1080/13506129.2020.1815696.
- Luigetti M, Di Paolantonio A, Guglielmino V, et al. Neurofilament light chain as a disease severity biomarker in ATTRv: data from a single-Centre experience. Neurol Sci. 2022;43(4):2845–2848. doi:10.1007/s10072-021-05850-7.
- Khalil M, Teunissen CE, Otto M, et al. Neurofilaments as biomarkers in neurological disorders. Nat Rev Neurol. 2018;14(10):577–589. doi:10.1038/s41582-018-0058-z.
- Ferreira-Atuesta C, Reyes S, Giovanonni G, et al. The evolution of neurofilament light chain in multiple sclerosis. Front Neurosci. 2021;15:642384. doi:10.3389/fnins.2021.642384.
- Strimbu K, Tavel JA. What are biomarkers? Curr Opin HIV AIDS. 2010;5(6):463–466. doi:10.1097/COH.0b013e32833ed177.
- Loser V, Benkert P, Vicino A, et al. Serum neurofilament light chain as a reliable biomarker of hereditary transthyretin-related amyloidosis-A swiss reference center experience. J Peripher Nerv Syst. 2023;28(1):86–97. doi:10.1111/jns.12524.
- Ticau S, Aldinc E, Polydefkis M, et al. Treatment response and neurofilament light chain levels with long-term patisiran in hereditary transthyretin-mediated amyloidosis with polyneuropathy: 24-month results of an open-label extension study. Amyloid. 2023;20:1–11. doi:10.1080/13506129.2023.2232520.
- Bril V. NIS-LL: the primary measurement scale for clinical trial endpoints in diabetic peripheral neuropathy. Eur Neurol. 1999;41(Suppl 1):8–13. doi:10.1159/000052074.
- Murphy SM, Herrmann DN, McDermott MP, et al. Reliability of the CMT neuropathy score (second version) in Charcot-Marie-tooth disease. J Peripher Nerv Syst. 2011;16(3):191–198. Sep doi:10.1111/j.1529-8027.2011.00350.x.
- Vinik EJ, Hayes RP, Oglesby A, et al. The development and validation of the norfolk QOL-DN, a new measure of patients’ perception of the effects of diabetes and diabetic neuropathy. Diabetes Technol Ther. 2005;7(3):497–508. doi:10.1089/dia.2005.7.497.
- Coutinho P, Martins da Silva A, Lopes Lima J, et al. Forty years of experience with type I amyloid neuropathy: review of 483 Cases. In: Glenner GG, Pinho e Costa P, Falcao de Freitas A, editors. Amyloid and Amyloidosis. Amsterdam: Excerpta Medica; 1980:88–98.
- Dyck PJ, Boes CJ, Mulder D, et al. History of standard scoring, notation, and summation of neuromuscular signs. A current survey and recommendation. J Peripher Nerv Syst. 2005;10(2):158–173. Jun doi:10.1111/j.1085-9489.2005.0010206.x.
- Dyck PJ, Kratz KM, Lehman KA, et al. The rochester diabetic neuropathy study: design, criteria for types of neuropathy, selection bias, and reproducibility of neuropathic tests. Neurology. 1991;41(6):799–807. Jun doi:10.1212/wnl.41.6.799.
- Sadjadi R, Reilly MM, Shy ME, et al. Psychometrics evaluation of Charcot-Marie-tooth neuropathy score (CMTNSv2) second version, using rasch analysis. J Peripher Nerv Syst. 2014;19(3):192–196. doi:10.1111/jns.12084.
- Kleyweg RP, van der Meché FG, Schmitz PI. Interobserver agreement in the assessment of muscle strength and functional abilities in Guillain-Barré syndrome. Muscle Nerve. 1991;14(11):1103–1109. doi:10.1002/mus.880141111.
- Yamamoto S, Wilczek HE, Nowak G, et al. Liver transplantation for familial amyloidotic polyneuropathy (FAP): a single-center experience over 16 years. Am J Transplant. 2007;7(11):2597–2604. doi:10.1111/j.1600-6143.2007.01969.x.
- Weinhofer I, Rommer P, Zierfuss B, et al. Neurofilament light chain as a potential biomarker for monitoring neurodegeneration in X-linked adrenoleukodystrophy. Nat Commun. 2021;12(1):1816. doi:10.1038/s41467-021-22114-2.
- Ladang A, Kovacs S, Lengelé L, et al. Neurofilament light chain concentration in an aging population. Aging Clin Exp Res. 2022;34(2):331–339. doi:10.1007/s40520-021-02054-z.
- Benkert P, Meier S, Schaedelin S, et al. Serum neurofilament light chain for individual prognostication of disease activity in people with multiple sclerosis: a retrospective modelling and validation study. Lancet Neurol. 2022;21(3):246–257. doi:10.1016/S1474-4422(22)00009-6.
- Sandelius Å, Zetterberg H, Blennow K, et al. Plasma neurofilament light chain concentration in the inherited peripheral neuropathies. Neurology. 2018;90(6):e518–e524. doi:10.1212/WNL.0000000000004932.
- Abdelhak A, Petermeier F, Benkert P, et al. Serum neurofilament light chain reference database for individual application in paediatric care: a retrospective modelling and validation study. Lancet Neurol. 2023;22(9):826–833. doi:10.1016/S1474-4422(23)00210-7.
- Fukami Y, Iijima M, Koike H, et al. Association of serum neurofilament light chain levels with clinicopathology of chronic inflammatory demyelinating polyneuropathy, including NF155 reactive patients. J Neurol. 2021;268(10):3835–3844. doi:10.1007/s00415-021-10537-2.
- van Lieverloo GGA, Wieske L, Verhamme C, et al. Serum neurofilament light chain in chronic inflammatory demyelinating polyneuropathy. J Peripher Nerv Syst. 2019;24(2):187–194. doi:10.1111/jns.12319.
- Hayashi T, Nukui T, Piao JL, et al. Serum neurofilament light chain in chronic inflammatory demyelinating polyneuropathy. Brain Behav. 2021;11(5):e02084.
- Fernandes A, Coelho T, Rodrigues A, et al. Clinicopathological correlations of sural nerve biopsies in TTR Val30Met familial amyloid polyneuropathy. Brain Commun. 2019;1(1):fcz032.
- Rossor AM, Kapoor M, Wellington H, et al. A longitudinal and cross-sectional study of plasma neurofilament light chain concentration in Charcot-Marie-tooth disease. J Peripher Nerv Syst. 2022;27(1):50–57. doi:10.1111/jns.12477.
- Disanto G, Barro C, Benkert P, et al. Serum neurofilament light: a biomarker of neuronal damage in multiple sclerosis. Ann Neurol. 2017;81(6):857–870. doi:10.1002/ana.24954.
- Adams D, Algalarrondo V, Polydefkis M, et al. Expert opinion on monitoring symptomatic hereditary transthyretin-mediated amyloidosis and assessment of disease progression. Orphanet J Rare Dis. 2021;16(1):411. doi:10.1186/s13023-021-01960-9.
- Buxbaum JN, Dispenzieri A, Eisenberg DS, et al. Amyloid nomenclature 2022: update, novel proteins, and recommendations by the international society of amyloidosis (ISA) nomenclature committee. Amyloid. 2022;29(4):213–219. doi:10.1080/13506129.2022.2147636.