
ABSTRACT
Two studies examine the circumstances in which singletons, defined by unique feature-change rate, guide attention in visual search. Participants searched for a static vertical/horizontal white target bar amidst tilted distractors. Bars were contained inside surround shapes with periodically oscillating features. In Experiment 1, displays consisted of surrounds with abrupt (discrete) or continuous (smooth) changes between two values (red–blue, square–diamond). For discrete displays, target surrounds did not guide attention when uniquely faster-oscillating than distractor surrounds, but did in smooth displays. For unique-slow oscillating target surrounds, the opposite guidance pattern was found across discrete and smooth displays. In Experiment 2, displays had a mixture of discrete and smooth surrounds. Here, only unique slow-oscillating discrete surrounds guided attention. No guidance was found for smooth surrounds. Findings suggest that faster oscillations are masked by higher-frequency harmonic signals from slower changing discrete items, and there is attentional prioritization of discrete over smooth changes.
Visual search is often facilitated when the target item is a unique and easily distinguishable element within a display (Treisman & Gelade, Citation1980; Wolfe, Citation1994). In a display of green bars, a single red bar is quickly located (Treisman & Gelade, Citation1980). In addition to static feature contrasts, like colour, attention can also be guided by the unique temporal characteristics of a target (Cass et al., Citation2011; Nakayama & Motoyoshi, Citation2017). Various forms of temporal uniqueness can direct attention, e.g., motion direction (Thornton & Gilden, Citation2001), acceleration (Nakayama & Motoyoshi, Citation2017), motion change (Howard & Holcombe, Citation2006), or phase uniqueness (Li et al., Citation2023).
Motion is not necessary for dynamic attributes to guide attention; purely temporal changes in the form of flicker can also have this effect. In displays containing luminance flicker, items with unique faster or slower change rates tend to draw attention and reduce search-slopes for a target (Cass et al., Citation2011; Spalek et al., Citation2009; Stolte & Ansorge, Citation2021). Pilling and Georgieva (Citation2018) also found facilitation with flicker; however, the pattern of facilitation was somewhat different from these studies with luminance. Pilling and Georgieva had a different initial motivation; the study aimed to investigate whether unique temporal synchrony or asynchrony of feature changes attracted attention in a display. In the synchronous case, the surrounding objects changed in colour and shape either in or out of synchrony. The results showed that a singleton with synchronous feature changes among asynchronous changes guided attention, but asynchronous-change singletons among synchronous failed to produce guidance. A subsequent experiment, using only synchronous stimuli, showed it was not the synchrony itself but rather the perceived difference in flicker between the synchronous and asynchronous items that influenced search and produced the asymmetry. Essentially, a singleton with a slower change rate attracted attention; one with a higher rate was indistinct. Results differed from the previously described studies using luminance flicker, where both higher- and lower-rate singletons guided attention (Cass et al., Citation2011; Stolte & Ansorge, Citation2021).
Why the different results? The asymmetry may be related to the type of feature changes used, or to their multidimensional nature. A different possibility is that the effect somehow results from the abruptness of the feature changes; these were discrete changes in the colour and orientation of the stimuli, ones that gave the perception of an oscillation between two distinct shapes of different colour; this contrasts with the smooth sinusoidal changes used, for instance, in Cass et al. (Citation2011). The current experiments aim to replicate the asymmetric pattern of search reported in Pilling and Georgieva (Citation2018) and to identify its cause, so as further to understand how attention is allocated in dynamic environments. The same stimulus types are used as in the earlier experiment: regular quadrilaterals alternate as diamonds and squares while simultaneously changing colour.
In Experiment 1, the critical comparison was between having such stimuli whose feature changes occur either in a discrete manner as in Pilling and Georgieva (Citation2018) or smoothly and sinusoidally modulated as in Cass et al. (Citation2011). In Experiment 2, the same stimulus types are given, but here mixed displays of discrete and smooth feature changes are given. The basic question concerns identifying the conditions in which asymmetry in guidance occurs for feature changes. The answer to this question will give insight into the conditions required for singletons to guide attention in dynamic displays.
Experiment 1
Method
Participants
Twenty-four participants were drawn from Oxford Brookes undergraduate participant panel (age = 18–25, 19 females); all had normal/corrected-to-normal vision.
Stimuli
Stimuli were displayed on a 19″ Sony® Trinitron® monitor (1024 × 768 pixels resolution; 100 Hz refresh rate) controlled by a Quad-Core PC (Nvidia® GeForce®-8400-GS graphics card), viewed at approximately 500 mm in a dimly lit room. Approximate subtended angles are given for all stimuli. Software was written and compiled in BlitzMax (Sibley, Citation2011); it was responsible for stimulus presentation, randomization, and response recording.
The display background was set to grey (RGB: 171, 171, 171). The search array consisted of 3, 6, or 9 white rectangular bars (1.28° × 0.17°approximate subtended visual angle), equally spaced on a notional circle (11.95° diameter) around fixation. In all trials, there was a target bar (vertical or horizontal with equal probability); distractor bars were oblique with a random tilt with the constraint that it was >±8° from the horizontal/vertical. Bars was contained within the hollow centre (diameter 1.71°) of a regular quadrilateral (side length = 3.5°) surround.
In discrete change trials, surrounds were oriented as a square or a diamond, and red (RGB: 255, 0, 0) or blue (RGB: 0, 0, 255). The initial shape–colour state was pseudorandomly determined. A static depiction of the display is given in . Surrounds discretely changed both colour and orientation with the features in synchrony at their given rate (e.g., a surround might alternate between blue–diamond and red–square). Target and distractor surrounds were always one of three rates: 179, 3.57, 7.14 Hz. The phases of the display items were uncorrelated. Seven target–distractor rate combinations were given labelled A–G, target Hz (distractor Hz): (A) 1.79 Hz (1.79 Hz); (B) 3.57 Hz (3.57 Hz); (C) 7.14 Hz (7.14 Hz); (D) 3.57 Hz (1.79 Hz); (E) 7.14 Hz (3.57); F) 1.79 (3.57); (G) 3.57 (7.14 Hz). Trial types A–C were baseline; target and distractors had the same rate (hereafter condition T = D). The relevant comparisons were between these baselines and ones with a more rapid (condition T > D; trial-types D, E) or slower (condition T < D; trial types F, G) target rate.
Figure 1. Static screenshot example of the search display in the discrete case. In the example, set size = 9; target bar = horizontal.
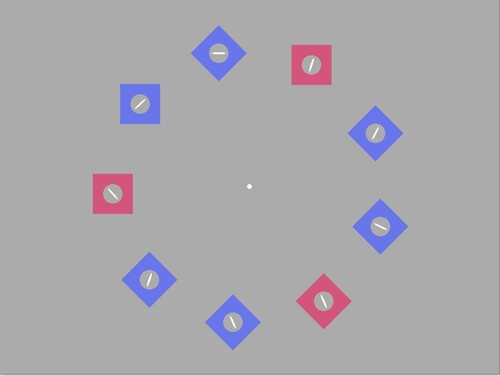
Displays on smooth trials were equivalent to discrete trials except for differences associated with the surrounds. Feature changes were modulated to be smooth change across two features, rather than done in a single step. Thus, rather than a sudden change from being, for example, a blue diamond to becoming a red square, the surround would morph colour from blue to red via the intermediate hues within HCL colour space, and shift in intermediate orientations from a diamond to become a square. Sinusoidal modulations to both features were done. The same combinations of target–distractor rates were given as for discrete trials.
Design and procedure
All independent variables were repeated measures. These were Type (discrete, smooth), Target–Distractor rate (A–G), and Set Size (3, 6, 12). It was counterbalanced such that, for half the participants, the rotation from diamond to square was clockwise, and for the others, anticlockwise. A total of 840 trials was given with equal numbers of each condition. Regular self-paced breaks were given. Sessions took approximately 40 mins. Participants were instructed to report if the one non-oblique bar was horizontal or vertical by means of a left or right gamepad trigger. Immediate auditory feedback was given. Participants were told to respond as quick as possible, but not to guess. Demonstrations and 30 randomly selected practice trials were given prior to the experiment.
Results and discussion
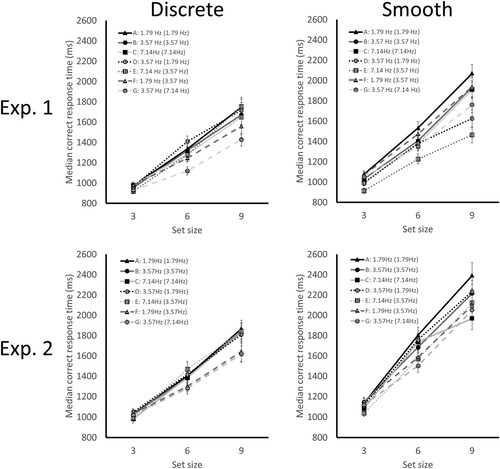
Error rates were low (<5%). Analysis focused on median correct response times (RTs). These were calculated per participant for each trial type. Across-participant means of individual median correct RTs are shown in the upper-half of .
Figure 2. Median correct response times for the individual target–distractor combinations for discrete trials (left and right column, respectively) for Experiments 1 and 2 (top and bottom rows, respectively). Set size is on the abscissa; the ordinate depicts the cross-participant median correct response time (ms). Target rate is indicated by marker shape: triangle = 1.79 Hz; circle = 3.57 Hz, square = 7.14 Hz. The line colour denotes the distractor: black line = 1.79 Hz; dark-grey line = 3.57 Hz; light-grey = 7.14 Hz. Separate lines are given for each target–distractor combination (A–G). Condition is denoted by the dash type of the line and the marker fill: solid line + solid fill denotes baseline (T = D), long-dashed line + marker with horizontal black–white stripes = the slower target (T < D), short-dotted line + marker with vertical black–white stripes = faster target condition (T > D). Error bars show ±1 standard error.
Mean search slopes were calculated for each constituent target–distractor rate (A–G). These are shown in (top left). Slopes were also calculated across the relevant target–distractor rate trials to produce the mean for each of the three conditions for the purpose of analysis (T = D, T > D, T < D). These are shown in (bottom left).
Figure 3. The top row depicts search slopes (ms/item) for the seven target–distractor combinations (A–G) for the discrete and smooth trials. The bottom row depicts mean search slopes calculated across the corresponding trial types for the three conditions (baseline, T = D; faster target, T > D; slower target, T < D). Error bars show ±1 standard error.
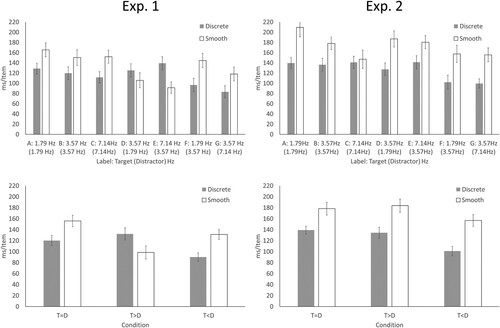
Bayesian repeated measure ANOVAs were performed using jamovi (the jamovi project, 2022, v2.3, https://www.jamovi.org) with the jsq-Baysian methods module (v1.2.0). ANOVAs were performed separately for the discrete- and smooth-change trials. In all these ANOVAs, there was a single factor of condition (T < D; T > D; T = D). For discrete trials, the Bayes factor indicated strong evidence of an effect of condition (BF10 = 14.61). Post-hoc comparisons between the two singleton conditions (T < D; T > D) against the baseline (T = D), found moderate evidence for shallower search slopes in the slower target condition (T < D) against baseline (BF10 = 3.62), and weak evidence for slopes in the faster condition (T > D) being the same as the baseline (BF01 = 2.84). For smooth trials, the Bayes factor indicated strong evidence for an effect of condition (BF10 = 63.31). Post-hoc comparisons found strong evidence for shallower search slopes in the faster target condition (T > D) against baseline (BF10 = 17.11), and weak evidence for shallower search slopes in the slower target condition (T < D) against baseline (BF10 = 1.15).
Thus, the target rate had different effects for the two display types against the respective baselines. For discrete displays, the search efficiency was only improved with slower-rate target–surrounds, for the smooth trials, only faster-rate target–surrounds unequivocally improved search. The asymmetry with discrete trials replicates that reported by Pilling and Georgieva (Citation2018). It shows the asymmetry to be a specific consequence of discrete feature changes. The effect with discrete changes is curious, because with smooth changes the faster changes were the ones most effective in drawing attention. However, the effect of the two are difficult to compare because the relevant comparisons between discrete and smooth feature changes were not made in the same display. Experiment 2 tested whether the asymmetry would persist in displays in which distractors consisted of both discrete- and smooth-changing elements.
Experiment 2
Experiment 2 presented mixed displays in which distractors always consisted of both discrete- and smooth-changing items. Other aspects of the task were the same as in Experiment 1.
Method
Experiment 2 (N = 24) used the same recruitment criteria as Experiment 1 (age: 18–25; 20 females); none had taken part in Experiment 1. The only differences from Experiment 1 were in the display composition. In Experiment 1, displays only contained either discrete- or smooth-changing surrounds. In Experiment 2, distractors were mixed such that approximately half were discrete and half smooth. In half the trials, the target surround was a discrete change, and in the other half, it was a smooth change.
Results and discussion
Data were processed as described for Experiment 1. Error rates were low (<5%) and not analysed further. Grand average means of median correct responses are shown in the lower half of . Mean search slopes were calculated for the constituent trial types (A–G) and means for the three respective conditions (T = D, T > D, T < D). These were done separately for the two target types (discrete, smooth). These are shown on the right-hand side of .
Bayesian repeated measure ANOVAs were performed in the same way as described for Experiment 1. For discrete target trials, the Bayes factor indicated strong evidence of an effect of condition (BF10 = 46.58). Post-hoc comparisons between the two discrete singleton conditions against baseline found strong evidence for shallower search slopes in the slower target condition (T < D) against baseline (BF10 = 176.79), and moderate evidence for slopes in the faster target condition (T > D) being the same as the baseline (BF01 = 4.21). For smooth trials, the Bayes factor indicated weak evidence for the null hypothesis of no effect of target condition (BF01 = 1.01). Post-hoc comparisons found moderate evidence for slopes in the faster target condition (T > D) not differing from baseline (BF01 = 4.05), and weak evidence for slopes in the slower target condition (T < D) not differing from baseline (BF01 = 1.46).
Thus, with the discrete targets, the same pattern was found in Experiment 2 as in Experiment 1: more slowly changing target–surrounds facilitated search against the baseline both in pure (displays containing only discrete surrounds) and mixed (containing both surround types). This was not the case for smooth-changing target–surrounds. Here faster, but not slower, surrounds produced clear search facilitation against the baseline in the pure displays (displays containing only other smooth change surrounds). With the mixed displays, however, this facilitation was absent: both faster and slower targets were found to be statistically indistinguishable from the baseline.Footnote1
General discussion
Experiment 1 demonstrated an asymmetric bias in the guidance produced by discrete feature changes: attention was guided towards a target singleton with a slower change rate, but was not by one with a faster rate. The same pattern was not found with smooth feature changes; here, there was a much less pronounced asymmetry, and in the opposite direction.
Experiment 2 showed that the asymmetric bias for faster changing targets persisted when the display consisted of a mix of discrete and smooth feature changes. However, for the smooth targets, no guidance at all was produced in the mixed displays, even for the more slowly changing targets, ones that had produced distinct guidance with the pure displays.
The results suggest, in contrast to the explanation of the asymmetry given in Pilling and Georgieva (Citation2018), that the bias with discrete stimuli was not a preference for stability in dynamic displays consisting of multi-feature changes. Were this true, a similar asymmetry should have been found for the smooth changes. The asymmetry is a specific characteristic of discrete targets placed among discrete distractors. The fact that singleton smooth changes no longer produced guidance when placed among discrete changes hints at the process responsible. It suggests that the temporal energy generated by discrete feature changes is a factor that determines whether guidance is produced. The discrete changes produce a temporal pattern of square wave changes, compared with sinusoidal smooth changes. This means that discrete changes generate higher-frequency broadband harmonic signals in addition to those at the fundamental oscillation rate. How might this produce the observed data pattern? At first glance, it might be assumed that -for the discrete changes -the substantially higher temporal frequencies of the faster changing singletons would make them distinct among the more slowly changing distractors, as it does for smooth changes. However, the discrete feature changes of the distractors will produce higher frequency harmonics that will compete with the fundamental frequency of the faster changing target. This will serve to reduce the singleton’s salience and therefore its attentional guidance. A discrete singleton with slower changing features would be unaffected by this: the slower changing fundamental frequency would remain unique in the display because the distractor harmonics would not overlap. The consequence of this would be the asymmetry in guidance for discrete changes we observe. The harmonics generated by discrete changes would also affect the salience of smooth-changing singletons when in competition within the same display. When present only among other smooth-changing objects, a faster-changing surround guided attention; however, when discrete-changing distractors were added to the display, this same surround no longer produced guidance. Again, the otherwise distinct temporal signal of a faster changing smooth target is diminished by the higher frequencies generated by the discrete changes.
A further point to note from Experiment 2 is that targets overall had longer search times when located in smoothly changing, compared to discretely changing, objects. In the former case, targets took on average nearly 50 ms per item longer to find compared to the latter case. This suggests that discrete changes enjoyed attentional priority over the smooth changes in the search, despite targets being equally distributed across both. The discrete change locations are likely more salient in the displays because of their greater temporal energy. A similar phenomenon may be occurring in the “mudsplash” paradigm (O’Regan et al., Citation1999), where searching is disrupted by the presence of broadband temporal changes in the form of irrelevant objects discretely oscillating between visible–invisible. The cycling feature changes in the current experiments are likely weaker in their effect than the cycling onset–offset changes used in the “mudsplash” paradigm, but the process is likely analogous.
Overall, the results add to growing evidence that attests to the complex nature of salience in dynamic displays (Kunar & Watson, Citation2011). In dynamic visual displays, a target defined by unique temporal differences from other display elements is not intrinsically salient, even if the temporal difference is substantial. For temporal cues to guide attention they are most effective when composed of discrete rather than smooth feature changes, and when changes oscillate at a slower rate than a faster one. The only unique attributes that guided attention in all cases were discrete changes that oscillated at slower rates than other display items.
These facts have design implications for visual alerting systems in complex visual displays. A smoothly oscillating change (e.g., rapid movements in a dial needle position) which might ordinarily draw attention, may be rendered inconspicuous when in competition with discrete changes (e.g., blinking lights, screen images with alternating shapes). Discrete change locations seem to have attentional priority other smooth change locations, but a unique discrete change will only draw attention to itself when it has a distinctly slower oscillation rate than other items. This suggests that, to be noticed in a dynamic environment, high priority visual signals such as warnings are better in the form of slower discrete visual changes.
Disclosure statement
No potential conflict of interest was reported by the author.
Notes
1 It is notable that the baseline search slopes were neither uniform nor displayed the same pattern across the two experiments. In Experiment 1, Bayesian ANOVA showed a clear main effect of type (BF10 = 405.74) in the search slopes: showing that searching was generally more efficient for discrete than for smooth baseline trials. In Experiment 2, the same ANOVA showed an interaction between type and rate (type + rate + type×rate; BF10 = 98.24), this reflects the fact that baseline slopes were notably steeper for more slowly changing smooth trials than for the corresponding discrete trials, but these differences in the slopes were diminished at the fastest rate. The fact that there are different effects across the baselines is not entirely surprising. It must be noted here that, for Experiment 1, the type corresponds to the status of all surrounds (target and distractor), but in the mixed displays of Experiment 2, type corresponds only to the target alone (distractor surrounds were always a mix of both discrete and smooth). Given this difference in what they represent, the difference in baseline patterns is perhaps unsurprising. Overall, the findings with respect to the baseline patterns suggest that there are general effects of the dynamic surrounds on search efficiency. These may, in part, be consequences of the different perceptual attributes generated by the two change types (e.g., differences in perceived motion signal strength, differences in colour heterogeny). The different pattern found in Experiment 2 suggests there may be some additional specific effects on the perceptibility of the target bar itself by the surround.
References
- Cass, J., Van der Burg, E., & Alais, D. (2011). Finding flicker: Critical differences in temporal frequency capture attention. Frontiers in Psychology, 2, 320. https://doi.org/10.3389/fpsyg.2011.00320
- Howard, C., & Holcombe, A. O. (2006). Progressively poorer perceptual precision and progressively greater perceptual lag: Tracking the changing features of one, two and four objects. Journal of Vision, 6(6), 785–785. https://doi.org/10.1167/6.6.785
- Kunar, M. A., & Watson, D. G. (2011). Visual search in a multi-element asynchronous dynamic (MAD) world. Journal of Experimental Psychology: Human Perception and Performance, 37(4), 1017. https://doi.org/10.1037/a0023093
- Li, Y., Ye, B., & Bao, Y. (2023). The same phase creates a unique visual rhythm unifying moving elements in time. PsyCh Journal, 12(4), 500–506. https://doi.org/10.1002/pchj.636
- Nakayama, R., & Motoyoshi, I. (2017). Sensitivity to acceleration in the human early visual system. Frontiers in Psychology, 8, 925. https://doi.org/10.3389/fpsyg.2017.00925
- O’Regan, J. K., Rensink, R. A., & Clark, J. J. (1999). Change-blindness as a result of ‘mudsplashes’. Nature, 398(6722), 34–34. https://doi.org/10.1038/17953
- Pilling, M., & Georgieva, M. (2018). Feature synchrony-asynchrony and rate of change in visual search. Visual Cognition, 26(10), 792–801. https://doi.org/10.1080/13506285.2018.1561565
- Sibley, M. (2011). Blitzmax V. 1.51 [Computer software]. Blitz Research Ltd.
- Spalek, T. M., Kawahara, J. I., & Di Lollo, V. (2009). Flicker is a primitive visual attribute in visual search. Canadian Journal of Experimental Psychology / Revue Canadienne de Psychologie Expérimentale, 63(4), 319. https://doi.org/10.1037/a0015716
- Stolte, M., & Ansorge, U. (2021). Automatic capture of attention by flicker. Attention, Perception, & Psychophysics, 83(4), 1407–1415. https://doi.org/10.3758/s13414-020-02237-2
- Thornton, T., & Gilden, D. L. (2001). Attentional limitations in the sensing of motion direction. Cognitive Psychology, 43(1), 23–52. https://doi.org/10.1006/cogp.2001.0751
- Treisman, A. M., & Gelade, G. (1980). A feature-integration theory of attention. Cognitive Psychology, 12(1), 97–136. https://doi.org/10.1016/0010-0285(80)90005-5
- Wolfe, J. M. (1994). Guided search 2.0: A revised model of visual search. Psychonomic Bulletin & Review, 1(2), 202–238. https://doi.org/10.3758/BF03200774