
ABSTRACT
The aim of this paper is to foreground network analysis as a statistical lens through which higher education institutions can articulate their own process of striving for teaching excellence, and how it is constituted in their own contexts. The paper offers an approach to analysis that extends the frontiers of methodologies in ‘measurement’ of teaching excellence; one that responds to the shortcomings of the current methodologies, critiqued for being reductive, performative, alienating, and promoting closure and convergence in how they assess teaching excellence. We review epistemological and methodological shifts in conceptualising teaching excellence and measurement that are required to work with our methodology, as well as provide statistical details, for anyone who wishes to reproduce our profiled examples. We thus build in the paper a link between the theory of (teaching) excellence and practice (of measurement) and champion a theory-based approach to the methodology of educational metrics.
Introduction
The aim of this paper is to foreground network analysis as a statistical lens through which teaching excellence in a university can be critiqued. Through the statistical approach that we profile in the paper, we extend methodological frontiers that can help higher education institutions (HEIs) articulate their own vision of what teaching excellence means, in the context of their own discourse of purpose, and with reference to the ways in which teaching excellence is constituted in that context. The methodology that we discuss in the paper offers a critical framework for the analysis of data (here we use a case study of NSS as a critical example), to support engagement with teaching excellence as a situated notion.
We offer in the paper a theory-driven approach to data analytics – that is we present a methodology of ‘measurement’ of teaching excellence that locates its understandings and manifestations in a set of values, categories, overt markers and other elements through which a university department sees themselves in the world. We draw on philosophical concepts of ‘epistemic frames’ (Shaffer, Collier, and Ruis Citation2016) and a ‘relational turn in social sciences’ (Selg and Ventsel Citation2020), to operationalise a methodology that enables universities to design metrics that reflect their particular ‘stance’ on teaching excellence. This can be achieved by a different approach to measuring relations. The key contributions of our paper therefore are: (1) extension of key theoretical (epistemic frame theory) and methodological work about relations in measurement (relational turn theory) to develop a definition of teaching excellence as a concept of relation and (2) new application of this theoretical work to survey data which can be used for institutional teaching excellence metrics that are based on such understandings of teaching excellence.
Critical literature on teaching excellence (as we show in the sections below) emphasises that excellence is always subjective and negotiated within epistemic frames of people (i.e. the structure of connections among knowledge, skills, values, pedagogies, resources and other aspects related to teaching through which, for instance, departmental teams understand teaching excellence). It also urges policy makers and institutional leaders to find approaches to ‘measurement’ that reflect such understandings of teaching excellence. We work in this paper with this literature and and address the methodology gap and argue that in order to encourage universities and policy makers to work with the definition of teaching excellence as a relational concept and then to operationalise this meaning in measurement, which needs to emphasise the structure of connections in people’s epistemic frames. We thus build in the paper a link between the theory of (teaching) excellence and practice (of measurement) and champion a theory-based approach to the methodology of educational metrics. The methodology helps to avoid traps of atheoretical or data-driven approaches in which the data is expected to ‘speak for itself’ (without a theory of teaching). These traps are common in current teaching excellence frameworks, widely criticised for assuming that teaching excellence is linear, objective and universal (e.g. O’Leary and Wood Citation2019).
To support our arguments, we present a hypothetical example of a department and analyse the structure of connections between the elements of the epistemic frame that drives the work of that department towards creating students’ sense of belonging to a community of staff and students. That sense of belonging is the outcome of interest in the paper (chosen due to available variables in the sample dataset). Through that example, our aim is to emphasise that analysing the structure of the connections between elements constituting a department’s work towards creating a sense of belonging for the students is a more accurate methodology. As we develop the sections of the paper, we make a case as to why methodological approaches that emphasise these structures should replace the more classical approaches to modelling (such as multivariate and linear analyses) which focus on each of these elements in isolation, and which privilege an instrumental ethos of measurement of teaching (e.g. Spence Citation2019). In the conclusion, we summarise for policy makers how our methodology could be scaled up, in methodologically robust ways, to constitute metrics of teaching excellence used in national/ international assessments. We begin with a review of key understandings of teaching excellence to date.
Teaching excellence – conceptual review
The notion of teaching excellence is a contested one. Across the globe, contemporary and historical discourses around teaching excellence point to the complexities in defining and ‘evidencing’ teaching excellence (e.g. see edited volume by Broughan, Steventon, and Clouder (Citation2018) for international perspectives, or Gunn and Fisk (Citation2013) for a critical literature review). Literature on teaching excellence raises questions around the origins of the word ‘excellence’, and its appropriations in policy to meet the marketised and performative goals of higher education frameworks (e.g. Dunkin Citation1995; Wood and Su Citation2017; Wilcox Citation2021). Research also questions the universality and generic measures of teaching excellence (e.g. Saunders and Ramírez Citation2017) and critiques the tendency in teaching excellence schemes to reduce complex and situated nature of teaching excellence to simplified, arbitrary, and quantifiable indicators (e.g. Dixon and Pilkington Citation2017; Bahia et al. Citation2017). Key criticisms of current teaching excellence metrics are that have little to do with teaching and are merely used to fit performative policy regimes (e.g. Race Citation2017; Shattock Citation2018).
Micro-, meso- and macro-level perspectives
There are micro-, meso – and macro-level perspectives from which teaching excellence has been analysed (e.g. see Sanders, Moore, and Mountiford-Zimdars Citation2020 for a useful summary). At the micro-level, teaching excellence is considered at the individual or course level and is mostly framed in teacher-student interactions or within an implementation of transformative teaching practices (e.g. Bradley, Kirby, and Madriaga Citation2015; Canning Citation2019). Work on teaching excellence at micro-level usually focuses on framing it as delivering quality education to students, through student-cantered approaches, aiming to bring about intellectual and developmental outcomes in the students (e.g. Fitzmaurice Citation2010).
At the meso-level, teaching excellence is conceptualised as an institutional or/ and disciplinary issue, with literature raising questions about institutional learning and teaching strategies and award schemes (e.g. Madriaga and Morley Citation2016). Meso-level studies with respect to teaching excellence usually point to tensions between contextualised expectations of excellent teaching and generic, top-down awards (e.g. Behari-Leak and McKenna Citation2017), the purpose of teaching excellence awards more generally (Madriaga and Morley Citation2016) and the potential of awarded teachers to influence teaching and learning in their institutions and beyond, and to raise the status of teaching vis-à-vis research (e.g. Førland and Roxå Citation2023).
At the macro-level, academic debates tend to focus on international standards and the contested notion of ‘world-class’ excellence, with critiques being focused on the universality of teaching excellence frameworks and comparability issues (e.g. Altbach Citation2015; Hayes Citation2019). Relevant macro-level literature also raises questions about social justice issues, such as equal access to excellence. Examples include work by Bahia et al. (Citation2017) with respect to the Bologna Process in Europe; and by Salmi (Citation2023) who focuses on achieving equity in HE through teaching excellence initiatives, referring to the broader social justice missions of universities or Pusser and Marginson (Citation2013) who raise the issue of rankings being an instrument to exercise power.
Teaching excellence as tied to HE purposes
Broad-based conceptualisations of teaching excellence can also be organised in different ways. These hinge on understandings of teaching excellence that cross-cut the micro-, meso – and meta-themes reviewed above, and focus on the epistemological shifts in the meaning of teaching excellence and its ties to the purposes of higher education. Skelton (Citation2005), for instance, organises these shifts according to the changing and expanding purposes of higher education and names the following broad categories: traditional (educating learned gentlemen through the pursuit of knowledge), performative (responding to student outcomes and satisfaction), psychologised (professionalising teaching and learning in higher education by establishing ‘best practice’ procedures) and critical (supporting universities towards taking their own ‘stance’ on teaching excellence). Hunt and Hicks (Citation2018) refer to teaching excellence as bounded, highlighting its ties to the socio-cultural, geographic and economic contexts in which HE institutions operate and how these change the purpose of universities. Runté and Runté (Citation2018) posit that any conceptualisations of teaching excellence must be placed within the larger shift in the purposes of higher education. They identify four ideological discourses that have driven the changes in articulating the purposes of HE – that is, the discourse of enlightenment, human capital, manpower and the discourse of consumerism. They subsequently review the corresponding shifts in conceptualising teaching excellence, as meaning, respectively, high standards, responding to students’ needs, preparing future workers and satisfying the consumer.
Broadly speaking, shifts in purposes of HE have been summarised as changing from traditional and/or being for the elites and places for the pursuit of knowledge, to producing professionals skilled to support economic growth, supporting businesses and enhancing students’ employability outcomes (Skelton Citation2005). Evidencing teaching excellence under these shifts has therefore increasingly been associated with responding to performative metrics around students’ professional (career) success and satisfaction, with critiques pointing out to ‘mistrust, simulation, threat to identity and loss of autonomy in an atmosphere where the “customer” must be satisfied’ (Gourlay and Stevenson Citation2017, 394). Increasingly, literature on these core shifts and assessments of teaching excellence has been expanded through research in international contexts and by globalist perspectives (e.g. see special issue edited by Su and Wood Citation2019), highlighting the uniqueness of meanings of teaching excellence and shifts in HE purposes to being shaped by differing geo-political and socio-economic circumstance across nations and differing forms of HE partnerships, such as transnational education (e.g. Crosling Citation2018; O’Mahony Citation2014).
Introducing teaching excellence as a concept of relations
Whilst the perspectives reviewed above emphasise relations between elements of teaching excellence frameworks and the purposes of HE, they do not fully capture where we want to take readers in their thinking about how relations matter in conceptualising and ‘measuring’ teaching excellence. For example, from the psychologised perspective, relations in teaching excellence are constructed as ‘tools’ that can help predict what will be learned and how (Malcom and Zukas Citation2001). Such constructions come from the psychologised theory of learning which places emphasis on the structure of the student-teacher relationship (Skelton Citation2005). But how about the structure of relationships between other elements of the departmental, or even institutional, epistemic frame in which that student and teacher form their relationship? Our methodology models ways of conceptualising teaching excellence as being constructed and acting in the world of a group of people with a common approach to teaching, who may even share a repertoire of knowledge and skills (for example, shaped by their discipline) and use the same set of values that guides how teaching excellence is understood (i.e. their epistemic frame – Shaffer, Collier, and Ruis Citation2016). These people may also share experiences of the same institutional, policy and resource factors that may facilitate or prevent them from executing their shared understanding of teaching excellence. They may have a common identity exhibited through markers such as knowledge, skills, disciplinary perspectives on teaching excellence, etc. However, what is central to the epistemic frame that connects them is that ‘it is not mere possession of relevant knowledge, skills, values, practices and other attributes that characterise the epistemic frame of a community [of departmental teaching teams – our emphasis], but the particular set and configuration of them’ (Shaffer and Ruis Citation2017, 176).
It is from the above theoretical premise that we have constructed our methodology, placing emphasis on relations as constitutive of each other, and as something that ‘make up’ teaching excellence. Exploring relations in such a way and how they ‘make data into information by adding meaning’ (Shaffer Citation2017, 19), prompted us to explore the possibilities of network analysis as an approach that can help measure teaching excellence as a concept of relations. In conceptualising teaching excellence as a concept of relations, we borrow from Nixon that it is ‘a process of growth, development and flourishing; under the relational approach, teaching excellence is not just an end point’ (Nixon Citation2007, 22). But we also add that it is important to study the relations between the elements that frame that process, to grow, develop and flourish. Nixon (Citation2007) proposed a definition of teaching excellence as a developmental concept in relation to authenticity as part of striving for excellence, arguing that to be authentic means to be compassionate, respectful and courageous, and that it is a process that is learned under conditions of work that are often alienating and inauthentic. Arguably, there are links between such dispositions towards excellence and the work undertaken by the department in our hypothetical example, to strive towards the goal of creating their students’ sense of belonging to the community staff and students. The connections in the networks presented in and below denote steps that the department would need to take in that process, navigating conditions of work that may be prohibitive or inauthentic. What is thus crucial is that the steps undertaken towards striving for excellence are more important than the actual goal of achieving it. This paper champions a methodology that enables institutions to assess this process within the enablers and constraints of their epistemic frames, which differ across institutions.
Figure 1. A graphical representation of a network analysis. Nodes include: Course = The teaching on my course. Opp = Learning opportunities. Feed = Assessment and feedback. Supp = Academic support. Org = Organisation and management. Res = Learning resources. Com = Learning community. Voice = Student voice. Satisfaction = Summative question.
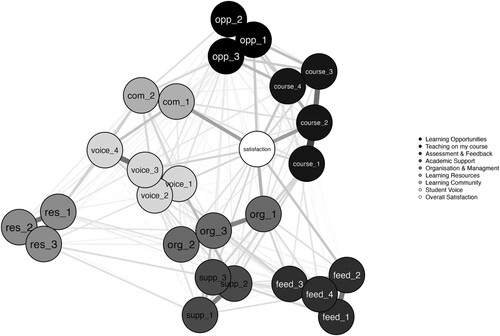
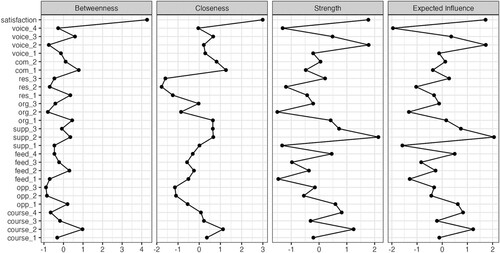
Figure 2. centrality plots, associated with the network in .
Thus, the real innovation of the applications of our methodology to teaching excellence metrics is that the process of assessment is inner-facing, rather than top-down and performative, as is the case with, for instance, current TEF assessments. Unlike many other metrics, our methodology does not assess teaching excellence as a ‘one off’, through some kind of competency-based assessment that can just ‘be applied’. Frameworks based on such assessments elide the context, disciplinarity, students’ backgrounds, the socio-political circumstances in which universities operate and the process undertaken by the teaching teams to mediate all these factors, in the process of striving for excellence. Our methodology, on the other hand, is grounded in statistical ways that highlight nuance and the emergent nature of the process. In the profiled example below, we focus on the process towards establishing a sense of belonging to the staff and students’ community and highlight how the goal of achieving it is formed by the structure of connections between pedagogic and other institutional factors from our example (which are described by variables in Table 1, from the sample NSS dataset). We highlight in our analysis how together, all these factors and entanglements make up what it means to be excellent in establishing a sense of community, and how this meaning changes, as the relationships between factors change. That change is possible to capture because we chose methodological ways that emphasise trans-action between the various elements of this process. This is different from the current ‘thresholds’ approach or predictive models such as regression-based analysisFootnote1, applied, for instance, in the TEF. We reject them because we are more interested in showing how the variables interact with each other and influence through this interaction the process of striving for excellence. In expressing that transaction, we move beyond simply showing the individual effects of these variables on the outcome.
Expressing trans-action
Demonstrating, methodologically, trans-action in the context of this paper means showing how the process of striving towards excellence in creating a sense of belonging to a classroom community only functions as excellence because of how people and other elements involved in it constitute the relevant context for it to function as such (Selg and Ventsel Citation2020). Such a relational view on teaching excellence distinguishes it from definitions that position excellence as a concept of characteristics that simply co-exist alongside one another. Our approach positions people and other elements of the institutional environment (e.g. facilities, support for teaching, pedagogies of a discipline) as constitutive parts of the meaning of teaching excellence; it conceptualises it as a trans-acted process (ibid). Without these elements, teaching excellence would not exist, or would not be what it is if all these people and elements were not involved in it, and if they did not interact with one another in the ways they do. To evidence this, a methodological approach that recognises these relations is required, one which can help focus on how institutions perform to their own specifications, according to how their internal elements make up teaching excellence (Hayes and Cheng Citation2020). As shown in the review of teaching excellence above, most analyses agree that excellence is a relative concept; we thus need to find methodologically rigorous ways that help us express it as such. To have absolutes against which it could be assessed makes educational ranking largely invalid, from a research and conceptual point of view, as benchmarks are based on institutional resources and reputational dimensions that have only minimal relevance to what we know, for example, about the impacts of teaching on the students (Pascarella Citation2001). The work by Selg and Ventsel (Citation2020), despite not originally developed with respect to educational rankings, on the other hand, offers a framing for shifting attention to how factors inside the institution interact to create these impacts.
Selg and Ventsel (Citation2020), as well as others (see, for instance, the encyclopaedia of relational sociology edited by Dépelteau Citation2018) argue that what sets the relational turn apart from other epistemological approaches to measurement is the desire to move beyond the analysis of individual attributes or aggregates of factors, to approaches that emphasise their constitutive nature. As Selg and Ventsel (Citation2020, 18) explain, ‘to relate is to constitute, not just cause’ and that ‘it is not just relations per se that are important, but that these relations are seen as reciprocal, multi-polar, inter-dependent and processual’; the focus is therefore on how they make up things and that things emerge from relationships (as also emphasised by the epistemic frame theory – Shaffer, Collier, and Ruis Citation2016) without which they would not be what they are:
A’s relation to B is always B’s relation to A and vice versa. From the relational perspective A is A only due to its relation to B and B is B only due to its relation to A. In other words, neither A or B would be what they are outside the reciprocal, multi-polar, interdependent and processual relation of A and B’.
(Selg and Ventsel Citation2020, 18)
Selg and Ventsel (Citation2020) offer a useful everyday analogy of a sense of humour to help us understand how the relational philosophy may be applied to teaching excellence. They posit that there is no universal understanding of a sense of humour, as it is not possible to have universal jokes that are funny in all settings. People therefore need to find ways of telling jokes that are relevant to the cultural and institutional context in which they are telling them. If people in that context cannot acknowledge an individual’s sense of humour, they will be considered not to have one. The same applies to finding new ways of expressing teaching excellence that tether to the values of the institutions in the process of striving for excellence.
In our methodology, there are therefore no institutional benchmarks; rather the focus is on how institutions ‘perform’ according to their own specifications, and how the notion of teaching excellence is formed, and how it changes, because of the constitutive relations of these specifications to one another. In our methodology, the analysis starts with the trans-actions between these specifications.
Methodology
We analysed National Student Survey (NSS) data (based on approx 12,000 responses), using network analysis, informed by the analytical philosophy of the epistemic network analysis (ENA) and its associated theory of epistemic frames (Shaffer, Collier, and Ruis Citation2016) but applied to survey data. The case study institution gave us permission to use the sample data and that no official ethical approval was required as we were working with anonymised, secondary data, for illustrative purposes. We use the data in the context of a hypothetical scenario of a department which seeks to create a sense of belonging for its students as part of striving for teaching excellence. This is expressed in the dataset by a variable ‘I feel part of a community of staff and students’ and abbreviated in our analysis as ‘comm’ (learning community). We fully acknowledge the limitations of the use of this variable in the NSS, however, this variable was the closest in meaning for our purposes, given the limitations of the dataset. For those readers who are not familiar with the National Student Survey used across the UK (although the English survey only is used below), the survey questions are presented in Appendix 1.
Network analysis
Network analysis is an approach that is variable centred (as opposed to model focussed), that establishes how groups of items (known as ‘nodes’) are arranged as distinct clusters, the (usually correlational) relationships between nodes (known as ‘edges’), and the organisation of nodes within the complete network. It can be driven by the variables themselves and the relationships. In other words, it is mostly used in an exploratory context and is not an approach that ‘tests’ a model, rather it shows how variables and relations constitute something. In the context of the relational research ontology that frames this paper, we applied the philosophical underpinnings of the epistemic network analysis (ENA) network analysis (Shaffer, Collier, and Ruis Citation2016) to survey data (Shaffer and colleagues originally developed their approach to the analysis of discourse). Working with philosophical assumptions of ENA enabled us to show that a phenomenon, such as teaching excellence, is constructed through the shifting web of relations and that it is the product of relations (Bradbury and Lichtenstein Citation2000). Network analysis, thus, became for us a means for studying the interactions, transactions, exchange, predispositions and affectual relations’ (Erikson Citation2018, 273). Erikson (Citation2018) argued that network analysis and relational analysis are a ‘match made in heaven!’ (ibid, 271). This is because network analysis enables:
a type of analysis that is not controlling for relational interlinkages but instead is explicitly focused on analysing the interlinkages and their effects. The analysis of interlinkages is of course one of the distinctive contributions of social networks to methods in the social sciences. And this analysis may also be performed in a descriptive mode that allows relationalists to directly observe the changing pattern of relationships that for many do not just produce but in fact constitute social life.
(Erikson Citation2018, 273)
Network analysis does require some user expertise, and we present an overview of the necessary considerations and signpost information in which the analyst can find detailed information regarding each decision point. It is important to be clear whether the analyses departments or institutions are undertaking are exploratory or confirmatory and be aware that network analysis is not a panacea for understanding teaching in a university. This paper should not be the sole source of information an analyst refers to when undertaking a network analysis, we provide some additional information and reading in endnotes.Footnote2
There are a variety of approaches that can be used in network analysis, most of which are based on conditional associations that define the network structure. These conditional associations are maintained when variables are probabilistically dependent, they are conditional on all other variables in the data set. In other words, it considers all relationships between variables in the dataset in concert. Within the network structure, variables are represented by nodes (also known as vetices) and the relationships between them are known as edges (also called links). Edges can be positive or negative which tells the analyst about the strength and direction of the relationship between nodes (one might think of this as a correlation). Nodes can also be known as bridges (or bridging nodes), which are links between clusters or nodes within the network, e.g. you can only get from A to C by going through B. Networks can take two forms – directed, in which the direction of effects (edges) are represented by an arrow, or undirected, in which the directionality of effect is not considered. These can also be cyclic (i.e. a path can be traced from a node back to the node) or acyclic (i.e. a path cannot be traced back to a node following the directed edges). The analyst should consider the nature of the network, in the context of the social life (epistemic frame) of institutional networks the network will likely have reinforcing elements that make the network acyclic. For example, in , the student voice being ‘heard’ feeds into a sense of community, i.e. representing a positive feedback loop.
The current paper takes a quantitative approach and presents a cross-sectional ‘flat’ network; in other words, one which does not account for hierarchical structures and how the network may evolve over time. We decided that this was most appropriate as this is the most accessible way to introduce readers to the utility of network analysis in understanding the relationality of teaching excellence within higher education institutions (for a primer on how network analysis can be applied to both hierarchical and time series structures see Borsboom et al. (Citation2021)).
In presenting the analysis below, we offer a brief introduction of the key considerations to make when evaluating a statistical network analysis. As the purpose of this paper is both conceptual and practical, some discussion is given on the network graph and the conceptual possibilities it presents. Analysts must remember that statistical network analyses should be understood using both numerical and graphical outputs.
The network analysis we describe below was conducted within JASP (Jeffreys’s Amazing Statistics Program) (https://jasp-stats.org/). The alternative free open-source software that readers could explore might be Gephi (https://gephi.org/) or R Studio (RStudio Team Citation2020) and the ‘Networktools’ Package (Jones Citation2017) as a starting point (there are multiple packages within R that support network analysis).
Worked example
The first consideration should be what type of estimator to use, which depends on the type of data that is being analysed. If data are multivariate (i.e. involving analysis of more than one outcome simultaneously) and normally distributed (i.e. being more frequently close to the mean, rather than far from the mean), the Gaussian Graphical Model (GGM), Correlation, or Partial Correlation should be considered. Should continuous data not be normally distributed, then transformations should be applied (e.g. nonparanormal transformation). Should data be ordinal (representing an order but without a specific distance, like satisfaction ratings), a GGM estimator can be applied also. With binary data (i.e. where the outcome has two possibilities, ‘Yes’ or ‘No’, ‘satisfied’ or ‘not satisfied’), the Isling Model can be used. For combination data in which there are categorical and continuous data then the Mixed Graphical Model can be used. In the example profiled below the estimator used was Extended Bayesian Information Criterion & Graphical Least Absolute Shrinkage and Selection Operator (EBICglasso). It is worth taking a moment to explain how EBICglasso functions, as it is (to our minds) the estimator that is probably most applicable across most situations when utilising network analysis with higher education data such as these.
When estimating networks it is important to select only variables which produce a parsimonious network representing the areas under consideration. This is because networks with a greater number of nodes will also have a greater number of edges, which can make the network much more challenging to interpret. To address this, there are mechanisms to shrink small edge weights to zero, so only influential (i.e. important) edges remain in the model. In the context of our example, the target of EBICglasso is to utilise Extended Bayesian Criterion in assessing the models that have been ‘shrunk’ by the GLASSO function into the most parsimonious model. The analyst can modify the tuning parameter (λ) with higher values, removing more edges, however, it is important to note that this can influence the structure of the model. The tuning parameter does not know what a true edge is (i.e. what is signal and what is noise), so it is recommended to apply caution and ideally produce several models and compare the effect of modulating the tuning parameter.
There are a few other final considerations when specifying analysis options. Firstly, the analyst can split networks by groups, e.g. by control and experimental conditions. Nodes are usually positioned using the Fruchterman-Reingold algorithm which organises nodes within the network based on the strength of connections between nodes. This is usually called a ‘spring’ layout, in which the analyst can specify a ‘repulsion’ setting, i.e. how ‘sparse’ the resultant graph will be by making nodes more or less sensitive to other nodes they differ from. The analyst might consider different graph classes (or layouts) for the network, generally speaking, these are spring (shaped by data also known as force-directed), circle (nodes are placed in a circle), and data (in which you can specify the x and y coordinates).
The network in our example below was produced using the following parameters:
Estimator – EBICglasso.
Correlation method – Correlation.
Centrality Measures – Normalized.
Tuning Parameter – 0.5.
Bootstrap samples – 1000.
Bootstrap type – nonparametric.
Plotting layout – spring with repulson set to 1.5.
shows that the items coalesce in nodes under the sub-sections of the main survey, which are: ‘Course’: The teaching on my course, ‘Opp’: Learning opportunities, ‘Feed’: Assessment and feedback, ‘Supp’: Academic support, ‘Org’: Organisation and management, ‘Res’: Learning resources, ‘Com’: Learning community, ‘Voice’: Student voice and the summative question ‘Satisfaction’ which is related to overall student satisfaction. The absence of a line between items means that there is no meaningful relationship between two items, and the intensity of the line denotes the strength of the relationship between items. shows that even within nodes, not all variables substantively interact with each other, e.g. the first and fourth ‘course’ items. This analysis provides additional depth to our understanding of the relationality within the hypothetical department as it can help understand which variables are ‘driving’ others.
If we consider ‘com_2’ which is the question ‘I have had the right opportunities to work with other students as part of my course’, this has the strongest relationship with ‘voice_1’ (‘I have had the right opportunities to provide feedback on my course’) and ‘voice_4’ (‘The students’ union (association or guild) effectively represents students’ academic interests’), alongside opp_2 (‘My course has provided me with opportunities to bring information and ideas together from different topics’) (denoted by the thickest lines). This starts to help build a picture of what influences the developmental process towards the goal of community belonging in our hypothetical department and which elements constitute the meaning of teaching excellence associated with it, and how the configurations between them prevent it and enable it – that is, the data suggests that it is a sense of value of the students’ voices, empowered by an effective union, and interdisciplinary teaching. Collectively, this is very strongly (the strongest relationship in the network) related to com_1 (‘I feel part of a community of staff and students’), which in turn has the strongest relationship with student satisfaction. If we plot the interactions between elements of our department’s epistemic frame in such a way, we can see how the analysis can be used to also plot steps to be undertaken in the process of growth towards the goal of creating a sense of belonging.
We can also see the (although somewhat weaker) relationships that are driving students’ sense of community belonging: elements of student's voice, and ‘course’ items relating to staff. We could at this point argue that once organisational issues are taken care of (the ‘org’ items), the sense of community driven by students who feel respected in this community and empowered will result in student satisfaction. We consider an important reflection on this type of analysis to be that whatever constitutes the nodes, the analysis will allow mapping of the relationships that are situated. In other words, as surveys change, and as students change (what might be ‘important’ one year, may not be important the next), the network and the structure of relationships will reflect this. The data will demonstrate how those changing relationships with respect to one another (which will always be relative to the specifications of an institution/ department at any given time) may make up a different developmental process towards teaching excellence, in which different elements will be seen as constitutive parts.
It is a definite strength that network analysis produces a graphical representation of complex data, but these should only be considered in concert with the statistical indices. As we highlighted above, there are many parameters that can be adjusted which can dramatically change the graphical and statistical outputs of the analysis. It is also important to not fall into the trap of thinking about placing too much emphasis on where the nodes are in relation to one another. For example, if a single node was closer one cluster than the one in which they ‘belonged’ to that they would be ‘more’ of the other cluster. Or it would be easy to (erroneously) assume that nodes in the middle of the graph are ‘central’ (i.e. important). To understand this, let us explore the centrality plots from our example:
shows the four main statistical outputs displayed by JASP as standard which describe the paths within the network and the relative importance of nodes. These are z scores (they do provide the relative importance of nodes) and the analyst should consider them carefully in concerts.
Betweenness (illustrated in the first column in ) tells the analyst the number of shortest paths that transect the node of interest. As satisfaction (‘Overall, I am satisfied with the quality of the course.’) has a greater betweenness score compared to voice_4 (‘The students’ union (association or guild) effectively represents students’ academic interests.’) we can understand that it is easier to traverse from other nodes to satisfaction than to voice_4 (it is also easy to appreciate this in the network diagram, in , where there are more direct lines to satisfaction and there is not a direct line from voice_4).
Closeness (second column in ) considers the relationship to all other nodes within the network by accounting for the indirect connections from that node. The higher the index the shorter the average distance to all other nodes, e.g. a more central node with higher closeness will be influenced by and provide influence to the network more than one with lower closeness. Take for example, res_2 (‘The library resources (e.g. books, online services and learning spaces) have supported my learning well’.) which has a low (actually negative) closeness score, you can see this in too – res_1 through res_3 are physically separate from the rest of the network. This means that we can understand that they have ‘longer’ paths to follow to assert influence over the network.
Strength (third column in ) is how strongly the node is connected to others and is calculated from the sum of the weighted number and strength of connections. Often, variables reporting strong strength (negative or positive) are considered ‘important’ It is important to balance quantity against strength however, and a high value on Strength does not necessarily equal importance in the network (quantity vs quality of connectedness). For example, voice_2 (‘Staff value students’ views and opinions about the course.’) will be influenced heavily by other nodes because students will feedback to staff about them, but it is unlikely this is the other way around.
Expected Influence tells us which are highly influential nodes, i.e. those with multiple strong edges with other nodes – as it is the sum of the edges shared with other nodes. As it is dependent on the edges, the direction of these relationships is accounted for within this statistic. A positive Expected Influence value shows that the positive edges (relationships) outweigh the negative and vice versa. It is important to note that betweenness and closeness are susceptible to inaccurate estimates when there are positive and negative edge weights within the network, whereas expected influence is not. In our example, consider supp_1 (‘I have been able to contact staff when I needed to.’) has a strong negative expected influence, it is easy to see how getting this ‘wrong’ in a university would damage other outcomes in the network. However, and importantly, this node does not have a direct edge with satisfaction and is bridged through supp_2 (‘I have received sufficient advice and guidance in relation to my course.’) from which we can start to understand the underlying mechanism.
There are a few additional considerations that are worth highlighting when considering utilising network analysis, these are nothing beyond ‘usual’ quantitative research considerations. Network analysis is susceptible to the effects of multicollinearity (i.e. inter-dependency between variables), therefore, the analyst should consider selecting a parsimonious set of theoretically informed variables to enter into the network – that is those that have theoretical and analytical importance (for example, for a practical purpose of improving something). On the point of quantity of nodes – sample size does matter, a general rule of thumb for a lower bound of sample size is 3 participants per parameter. Finally, skewed data will (as with regression-based analyses) provide spurious results and it is important to check for this along with estimator-specific elements such as normal distribution. Whilst we are not offering an example of it within this article, network analysis can also compare network through network structure invariance, specific edge invariance, and global strength invariance (see Van Borkulo et al. Citation2023). It can also handle time series data and multi-level structured data.Footnote3
Conclusion
The aim of this paper was to offer an approach to analysis that could extend the frontiers of methodologies in ‘measurement’ of teaching excellence; one that responds to the shortcomings of the current methodologies, critiqued for being reductive, performative, alienating, and promoting closure and convergence in the ways institutions are assessed. We have profiled instead an alternative methodology that makes two key contributions: firstly, it offers an extension of key theoretical and methodological work about relations in measurement, to frame teaching excellence as a concept of relation; and secondly, it offers a statistical approach to ‘measure’ it as such, in practice. In these concluding remarks, we summarise epistemological and methodological shifts that are required to work with our methodology and propose how it could be scaled up, in methodologically robust ways, to constitute metrics of teaching excellence used in national/ international assessments.
The first epistemological shift must be in working with the understanding of teaching excellence as a concept of relations. This means placing the structures and trans-actions between elements of a departmental epistemic frame as key, in the process of striving towards a specific educational goal (in the paper we used an example of striving towards creating a sense of belonging for the students). Viewing teaching excellence as such represents a necessary departure from the ways current (performative) frameworks position teaching excellence – that is, as a concept that can be reduced to proxies and benchmarks. The second epistemological shift therefore must take place in the ways in which measurement of teaching excellence is designed. In our methodology, this measurement is developmental, processual and as ‘part of the teaching/learning process in which the whole process is greater than the sum of its parts’ (Colling, 1989, cited in Sanders, Moore, and Mountiford-Zimdars Citation2020, 75). It provides a more complete description of everything that constitutes a specific understanding of teaching excellence at an institution, what is involved in achieving that specific excellence goal and how to progress towards it. Thus, it is a methodology that is inner facing, focused on how institutions perform to their own specifications; this does not mean that it cannot be scaled up to methodologically robust metrics with a potential for use in national or international frameworks.
The network analysis that we have used makes it possible to compare a number of different networks simultaneously because it compares them to centroids. Centroids are centres of clusters of connections (i.e. where the strongest connections in the network occur) that account for the structure of connections in a network. Thus, when compared, they could produce a picture of institutions with a similar pattern of connection (i.e. with centroids located close together) and with different patterns of connections (with centroids far apart). The primary focus however still remains on what happens in the process of striving for excellence in an institution and how this is shaped by their epistemic frames. Comparison of centroids therefore (a) removes the need to create benchmarks for external comparisons and instead (b) enables comparisons that capture the diversity of institutions, using common data (such as the NSS) but (c) with a recognition of the situated nature of connections created in these data at each institution.
Appendix_1_NSS_questions_used_in_the_profiled_example.docx
Download MS Word (18 KB)Disclosure statement
No potential conflict of interest was reported by the authors.
Notes
1 Of the groupings of variables in the sample NSS data, after conducting simple regression, it is not a stretch to conclude that an optimal learning environment for students is driven by a sense of belonging to a learning community of empowered individuals (staff and students) who are respected, and by proxy, this is realised in recognition of the importance of their time through quality organisation and communication. However, this more ‘traditional’ form of analysis only considers the influence of all variables on the outcome and not between each other. A more appropriate analysis method that allows the relational structure of variables to be revealed is captured in the decision-tree analysis that we profile.
2 Across the social sciences, network analysis has a rich and varied history, from origins in ‘Sociometry’ of the 1930s which mapped the social connectedness of child to contemporary analytical applications within machine learning exploring physical science phenomena (see Freeman Citation2004). It is important to highlight that we are advocating for the use of network analysis as a statistical approach for understanding data which universities may already be collecting (e.g., National Student Survey in the UK), rather than creating their own data (e.g. like in the ENA). There is also a tradition of mixed-methods social network analysis, in which the advantages of quantitative approaches to understand the structures of networks are combined with the nuanced understanding of content in interactions gained from qualitative research are both realised. For a recent systematic review exploring the application in the field of educational research and recommendations to analysts, please see Froehlich, Van Waes, and Schäfer (Citation2020).
3 As we stated above this article is an attempt to highlight to higher education researchers, practitioners, and decision makers the conceptual and practical utility of network analysis. We hope that we have whetted your whistle. However, as we also stressed above, there is much more to read before undertaking a network analysis and we would recommend the following additional readings – Hevey (Citation2018) for an excellent and detailed overview. Jones, Mair, and McNally (Citation2018) for a paper that puts forwards a tutorial in the R programming language. Putwain and Daumiller (Citation2023) is a good example of the utility of network analysis in concert with other analytic techniques (exploratory structural equation modelling). Borsboom et al. is another great contemporary overview of the state of the art including the application of network analysis to time series and multi-level data and highlights some of the areas of development for the field. Miele et al. (Citation2019) lay out nine quick (although detailed!) tips that the analyst should consider reading before beginning and when developing network analyses.
References
- Altbach, P.G. 2015. “AHELO: the myth of measurement and comparability.” International Higher Education 82: 2–3. doi:10.6017/ihe.2015.82.8861.
- Bahia, S., I.P. Freire, M.T. Estrela, A. Amaral, and J.A.E. Santo. 2017. The Bologna process and the search for excellence: between rhetoric and reality, the emotional reactions of teachers. Teaching in Higher Education 22 (4), 467–82, doi:10.1080/13562517.2017.1303471.
- Behari-Leak, K., and S. McKenna. 2017. Generic gold standard or contextualised public good? Teaching excellence awards in post-colonial South Africa. Teaching in Higher Education 22, no. 4: 408–22. doi:10.1080/13562517.2017.1301910.
- Borsboom, D., M.K. Deserno, M. Rhemtulla, S. Epskamp, E.I. Fried, R.J. McNally, and L.J. Waldorp. 2021. Network analysis of multivariate data in psychological science. Nature Reviews Methods Primers 1, no. 1: 58. doi:10.1038/s43586-021-00055-w.
- Bradbury, H., and B.M.B. Lichtenstein. 2000. Relationality in organizational research: exploring The space between. Organization Science 11, no. 5: 551–64. doi:10.1287/orsc.11.5.551.15203.
- Bradley, S., E. Kirby, and M. Madriaga. 2015. What students value as inspirational and transformative teaching. Innovations in Education and Teaching International 52, no. 3: 231–42. doi:10.1080/14703297.2014.880363.
- Broughan, C, Steventon, G and Clouder, L. (eds). 2018. Global perspectives on teaching excellence: A new era for higher education. London: Routledge
- Canning, J. 2019. The UK Teaching Excellence Framework (TEF) as an illustration of Baudrillard’s hyperreality. Discourse: Studies in the Cultural Politics of Education 40, no. 3: 319–30. doi:10.1080/01596306.2017.1315054.
- Crosling, G. 2018. “Teaching excellence and transnational education: enhancement through a focus on student diversity and context”, In Global perspectives on teaching excellence: A new era for higher education. Edited by Christine Broughan, Graham Stevenson and Lynn Clouder, 52-63, London: Routledge.
- Dépelteau, F. 2018. The Palgrave handbook of relational sociology. London: Springer.
- Dixon, F.J. and Pilkington, R.2017. Poor relations? tensions and torment; a view of excellence in teaching and learning from the cinderella sector. Teaching in Higher Education 22, no. 4: 437–50. doi:10.1080/13562517.2017.1301912.
- Dunkin, M.J. 1995. Concepts of teaching and teaching excellence in higher education. Higher Education Research & Development 14, no. 1: 21–33. doi:10.1080/0729436950140103.
- Erikson, E. 2018. “Relationalism and social networks”. In The Palgrave handbook of relational sociology. Edited by François Dépelteau, 271-88, London, Palgrave McMillan.
- Fitzmaurice, M. 2010. Considering teaching in higher education as a practice. Teaching in Higher Education 15, no. 1: 45–55. doi:10.1080/13562510903487941.
- Førland, O., and T. Roxå. 2023. Establishing reward systems for excellence in teaching – the experience of academics pioneering a reward system. European Journal of Higher Education, 1-19. doi:10.1080/21568235.2023.2214713.
- Freeman, L. 2004. The development of social network analysis. A study in the sociology of science, Vancouver, Empirical Press.
- Froehlich, D.E., S. Van Waes, and H. Schäfer. 2020. Linking quantitative and qualitative network approaches: a review of mixed methods social network analysis in education research. Review of Research in Education 44, no. 1: 244–68. doi:10.3102/0091732X20903311.
- Gourlay, L., and J. Stevenson. 2017. Teaching excellence in higher education: critical perspectives. Teaching in Higher Education 22, no. 4: 391–5. doi:10.1080/13562517.2017.1304632.
- Gunn, V. and Fisk, A. 2013. Considering teaching excellence in higher education: 2007-2013: A literature review since the CHERI report 2007.
- Hayes, A. 2019. Inclusion, epistemic democracy and international students: the teaching excellence framework and educational policy. London: Springer.
- Hayes, A., and J. Cheng. 2020. “Datafication of episteic equality: advancing understandings of teaching excellence beyond benchmarked performativity.” Teaching in Higher Education 25 (4): 493–509.
- Hevey, D. 2018. Network analysis: a brief overview and tutorial. Health Psychology and Behavioral Medicine 6, no. 1: 301–28. doi:10.1080/21642850.2018.1521283.
- Hunt, L. and Hicks, O. 2018. “Bounded excellence”. In Global perspectives on teaching excellence: A new era for higher education. Edited by Christine Broughan, Graham Stevenson and Lynn Clouder, 40-52, London: Routledge.
- Jones, P.J. 2017. Networktools: Tools for Identifying Important Nodes in Networks. R Package Version 1.1.0. Available online: https://CRAN.R-project.org/package=networktools.
- Jones, P.J., P. Mair, and R.J. McNally. 2018. Visualizing psychological networks: A tutorial in R. Frontiers in Psychology 9, no. 1742, doi:10.3389/fpsyg.2018.01742.
- Madriaga, M., and K. Morley. 2016. Awarding teaching excellence: ‘what is it supposed to achieve?’ Teacher perceptions of student-led awards. Teaching in Higher Education 21, no. 2: 166–74. doi:10.1080/13562517.2015.1136277.
- Malcolm, J., and M. Zukas. 2001. “Bridging pedagogic gaps: Conceptual discontinuities in higher education.” Teaching in Higher Education 6: 33–42.
- Miele, V., C. Matias, S. Robin, and S. Dray. 2019. Nine quick tips for analyzing network data. PLOS Computational Biology 15, no. 12: e1007434.
- Nixon, J. 2007. Excellence and the good society. In International perspectives on teaching excellence in higher education. improving knowledge and practice, edited by A. Skelton, 15-31. Abingdon: Routledge.
- O’Leary, M., and P. Wood. 2019. Reimagining teaching excellence: why collaboration, rather than competition, holds the key to improving teaching and learning in higher education. Educational Review 71, no. 1: 122–39. doi:10.1080/00131911.2019.1524203.
- O’Mahony, J. 2014. “Enhancing student learning and teacher development in transnational education.” Higher education academy: York, UK: 8-10.
- Pascarella, E.T. 2001. Identifying excellence in undergraduate education are we even close?. Change: The Magazine of Higher Learning 33, no. 3: 18–23. doi:10.1080/00091380109601796.
- Pusser, B., and S. Marginson. 2013. University rankings in critical perspective. The Journal of Higher Education 84, no. 4: 544–68. doi:10.1353/jhe.2013.0022.
- Putwain, D.W., and M. Daumiller. 2023. A network analysis of control–value appraisals and classroom-related enjoyment, boredom, and pride. Education Sciences 13, no. 3: 239. doi:10.3390/educsci13030239.
- Race, P. 2017. The teaching excellence framework (TEF): yet more competition – and on the wrong things!. Compass: Journal of Learning and Teaching 10, no. 2.
- RStudio Team. 2020. Rstudio: integrated development for R. RStudio, PBC, Boston, MA. http://www.rstudio.com
- Runté, M. and Runté, R. 2018. “Excellence for what? policy development and the discourse on the purpose of higher education”. In Global perspectives on teaching excellence: A new era for higher education. Edited by Christine Broughan, Graham Stevenson and Lynn Clouder, 66-78, London: Routledge.
- Salmi, J. 2023. “ Equity and inclusion in higher education”. International Higher Education, 113:5-6. https://ejournals.bc.edu/index.php/ihe/article/view/16089.
- Sanders, J. Moore, J. and Mountiford-Zimdars, A. 2020. “Operationalising teaching excellence in higher education: from ‘sheep-dipping’ to ‘virtuous practice’”. In Challenging the teaching excellence framework: diversity deficits in higher education evaluations. Edited by Amanda French and Kate Carruthers Thomas, 47-94, Bingley: Emerald Publishing Limited.
- Saunders, D.B., and G.B. Ramírez. 2017. Against ‘teaching excellence’: ideology, commodification, and enabling the neoliberalization of postsecondary education. Teaching in Higher Education 22, no. 4: 396–407. doi:10.1080/13562517.2017.1301913.
- Selg, P., and A. Ventsel. 2020. Introducing relational political analysis political semiotics as a theory and method. Cham: Palgrave Macmillan
- Shaffer, D.W. 2017. Quantitative ethnography. Madison, Wisconsin: Cathcart Press.
- Shaffer, D.W., W. Collier, and A.R. Ruis. 2016. A tutorial on epistemic network analysis: analyzing the structure of connections in cognitive, social, and interaction data. Journal of Learning Analytics 3, no. 3: 9–45. doi:10.18608/jla.2016.33.3.
- Shaffer, D., and Ruis, A. 2017. Epistemic network analysis: A worked example of theory-based learning analytics. Handbook of Learning Analytics 175–187. doi:10.18608/hla17.015.
- Shattock, M. 2018. Better informing the market? The teaching excellence framework (TEF). International Higher Education 92: 21–2. doi:10.6017/ihe.2018.92.10283.
- Skelton, A. 2005. Understanding teaching excellence in higher education. London: Routledge.
- Spence, C. 2019. ‘Judgement’ versus ‘metrics’ in higher education management. Higher Education 77, no. 5: 761–75. doi:10.1007/s10734-018-0300-z.
- Su, F., and M. Wood. 2019. Reinterpreting teaching excellence. International Journal of Comparative Education and Development 21, no. 2: 78–82. doi:10.1108/IJCED-05-2019-052.
- Van Borkulo, C.D., R. van Bork, L. Boschloo, J.J. Kossakowski, P. Tio, R.A. Schoevers, D. Borsboom, and L.J. Waldorp. 2023. Comparing network structures on three aspects: A permutation test. Psychological Methods 28, no. 6: 1273–85. doi:10.1037/met0000476.
- Wilcox, K. 2021. Interrogating the discourses of ‘teaching excellence’ in higher education. European Educational Research Journal 20, no. 1: 42–58. doi:10.1177/1474904120944783.
- Wood, M., and F. Su. 2017. What makes an excellent lecturer? Academics’ perspectives on the discourse of ‘teaching excellence’ in higher education. Teaching in Higher Education 22, no. 4: 451–66.