
 ?Mathematical formulae have been encoded as MathML and are displayed in this HTML version using MathJax in order to improve their display. Uncheck the box to turn MathJax off. This feature requires Javascript. Click on a formula to zoom.
Abstract
This paper investigates the impact of the rent tax announcement and implementation in Norway in sea-based salmonid aquaculture on stock returns of affected companies. Our sample period ranges from August 2, 2022 to February 1, 2023, covering both the announcement and implementation day. By applying a difference-in-differences approach, we measure the causal effect that the rent tax had on the returns of the affected companies (companies that operate in Norway) relative to the non-affected companies (those that operate outside of Norway). Our findings reveal a statistically significant, large negative return in the affected companies on the announcement day. Return on implementation day was close to zero. This result is consistent with the efficient market hypothesis, where only new information should move stock prices.
Introduction
During the most recent decade, salmon aquaculture has been very profitable (Misund & Nygård, Citation2018; Sikveland et al., Citation2022), making the industry a candidate for special taxation. Extraordinary profitability in this industry has, however, not always been the case. In the industry’s first four decades from the early 1970s, it mostly resembled a competitive industry. Productivity growth led to reduced production costs and increased competitiveness (Asche, Citation2008; Asche et al., Citation2022a; Kumar & Engle, Citation2016). The productivity growth resulted in double-digit production growth rates that lasted until around 2010. Sallowed the same downward trend as costs, indicating that supply growth outpaced demand growth ().
Figure 1. Real price of farmed salmon and unit production cost 1986–2022 (NOK per kilo whole fish equivalent, WFE). Data was collected from The Norwegian Directorate of Fisheries, with interest costs replaced with capital costs calculated as eight percent multiplied by total assets. Prices and costs deflated with the Norwegian consumer price index from Statistics Norway (2022 = 1).
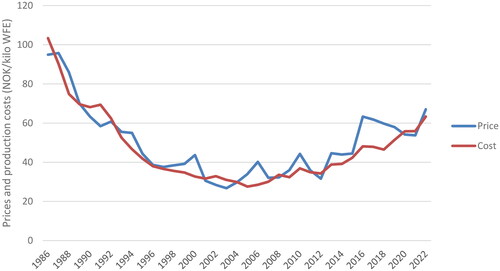
However, this development was not smooth due to substantial variation in demand as well as production shocks (Asche et al., Citation2017; Brækkan et al., Citation2018; Brækkan & Thyholdt, Citation2014). Consequently, like other biological production processes, salmon aquaculture profitability is highly cyclical (Andersen et al., Citation2008; Asche et al., Citation2018). During the years 1970–2010, periods of deficits could be observed as a part of these cycles, leading to increases in bankruptcy (Asche, Citation1997; Misund, Citation2017; Zhang & Tveterås, Citation2022), and the low salmon prices also resulted in numerous dumping allegations against Norwegian salmon farmers in the 1990s and 2000s (Asche, Citation2001; Kinnucan & Myrland, Citation2006). While production until the mid-2000s was unresponsive to price changes in the short run due to the constraints in the biological production process, the long-run supply was elastic (Andersen et al., Citation2008), and the difference between prices and costs was relatively small on average ().
Since 2005, the average economic profit per kilo has more than quadrupled measured in Norwegian kronerFootnote1. The reasons behind this dramatic change in profitability are not well studied in the literature, but there several possible explanations that are not mutually exclusive such as such as a substantial depreciation of the Norwegian krone, stricter environmental regulation (Hersoug et al., Citation2021a, Citation2021b; Jensen et al., Citation2024; Larsen & Vormedal, Citation2021), limited access to new production sites (Hersoug et al., Citation2021a; Young et al., Citation2019) and biological shocks (Asche et al., Citation2009, Citation2017, Citation2018). The high extraordinary profits combined with high market prices for farming licenses suggest that there are economic rents in salmon aquaculture (Misund & Tveterås, Citation2020; Osmundsen et al., Citation2022) since it can be argued that without the existence of rents, farming licenses should have no market value.
The nature of the economic rents in aquaculture is not well described but is likely to include regulatory rents arising from environmental regulation (Estay & Stranlund, Citation2022; Oglend et al., Citation2024; Oglend & Soini, Citation2020), as well as quasiFootnote2 and inframarginal rentsFootnote3. Characterization of the composition of economic rent is essential since this information has implications for policy decisions. Some rents are desired from the perspective of policymakers as a source of government revenues through taxation. In contrast, other types of rents are desired but should not be taxed (e.g. returns on innovation and research) (Schwerhoff et al., Citation2020). Resource and regulatory rents are good candidates for taxation, especially if they can be collected without creating efficiency losses, i.e. using neutral taxes (Garnaut & Ross, Citation1977).
Independently of the explanation of the rents in salmon aquaculture, since the late 1990s, policymakers have been trying to figure out how to collect rents from the Norwegian salmon industry. In 2002, a fixed fee for new licenses was introduced, with mixed success, as several licenses were left unsold in Northern Norway even though the fixed price was lower than that of southern Norwegian farming licenses (Hersoug, Citation2022). Other ways of rent collection have also been considered, such as an area fee (Sandersen & Kvalvik, Citation2015) an export fee, and as a production fee. In 2019, a government-appointed tax commission proposed a tax of 40 percent on profits (NOU 2019:18, 2019), but the government at the time dismissed the proposal (Åm, Citation2021; Hersoug et al., Citation2021a). On September 28, 2022, The Norwegian Ministry of Finance announced the introduction of a rent tax in Norwegian aquaculture (Finansdepartementet, Citation2022). The new tax, effective as of January 1, 2023, is imposed on companies producing Atlantic salmon (Salmo salar), Rainbow trout (Oncorhynchus mykiss) and trout (Salmo trutta). This was met with significant protests from coastal municipalities, the industry, and other stakeholders. A few weeks later, the government implemented the rent tax in Norwegian aquaculture through the National Budget for 2022/2023 (Prop. 1 LS (Citation2022–2023), pp. 128–131). It is worth noting that the specific details of the proposal were not immediately adopted by the Norwegian Parliament, leading to several modifications during the fall of 2022 and the spring of 2023. Consequently, this ongoing revision process is seen to have increased the unpredictability and uncertainty of future cash flows generated in aquaculture, as the tax was implemented several months before its formal adoption by the Norwegian Parliament on May 31, 2023. During this period, the stock market frequently reacted to interviews and statements by ruling politicians, and the lack of organized communication on the details of the tax was lamented in the press, with one editor calling the process “an open seminar on a secret rent tax.”Footnote4
Timely and accurate provision of credible information to all shareholders simultaneously is crucial for the functioning of stock markets, with the latter also being an important facilitator of economic growth (Black, Citation2001). Hence, this is an aspect that is strongly regulated, with fines for companies not adhering to policies. Market efficiency implies that new information is rapidly incorporated in stock market prices, which is often the case with tax changes. Fiscal policy actions typically have significant short-run effects (Mbanga & Darrat, Citation2016). While exchange-listed companies must follow strict information protocols, this is not always the case for politicians discussing potential changes to a tax where the details have not yet been laid down in law. This latter situation has been observed in the recent implementation of rent taxation on salmon aquaculture in Norway and provides a case study on the market impact of governmental information disclosures.
This paper investigates the impact on the stock price of the salmon producing companies listed at the Oslo stock exchange following the announcement of the rent tax in 2022, as well as the implementation of the rent tax in Norwegian aquaculture. The tax announcement should impact stock prices since these reflect information on future cash flows after tax and thus provide information on the expected economic effects of the tax. We apply a difference-in-differences approach as the listed companies into a treatment group and a control group, allowing for a comparison of the differences in returns since foreign companies listed is not impacted by the tax. We find that the tax announcement had a significant effect on the returns and that the effect occurred immediately on the day of the announcement. We do not find any significant abnormal returns on the implementation day, implying that the market had already adjusted for the rent tax on the announcement day.
The rest of the paper is structured as follows: Section “Background” provides the background of salmon farming in Norway and describes important aspects of the government proposal. Section “Data” contains a detailed description of the dataset utilized in the paper. Section “Methodology” presents the methodology employed, while Section “Results” provides the results, discussion, and limitations of the analysis. Finally, Section “Concluding remarks” offers a summary of and concludes the paper.
Background
Stagnating supply growth and strong demand are important factors behind improved profitability in salmon aquaculture
Since its commercial success in the early 1970s, salmonid aquaculture has demonstrated strong production growth driven by productivity improvements (Aponte, Citation2020; Asche et al., Citation2022b; Roll, Citation2013) caused by factors such as innovations (Afewerki et al., Citation2023), industry consolidation (Asche et al., Citation2013; Pandey et al., Citation2023). Today, Norway is the leading global producer of salmon (Luthman et al., Citation2019; Pandey et al., Citation2023), and the industry has become one of Norway’s most important export sectors (Hersoug, Citation2021).
Establishing a salmon farm in Norway requires two licenses: a production license (Maximum Allowable Biomass, MAB) and a site license (site MAB) (Hersoug, Citation2021). The overall biomass for each company across all of their sites (the company MAB) is the sum of the MAB allowed by the production licenses, and the sum of all production licenses limits total production. In recent decades, changes to the regulatory system have increasingly been motivated by environmental and fish welfare concerns (Hersoug Citation2021, Citation2022), an important reason for falling supply growth both in Norway and globally (Bjørndal & Tusvik, Citation2019). Other reasons for reduced supply growth from Norway include exhaustion of economies of scale and sales to an increasingly sophisticated and complex downstream supply chain often involving third countries demanding stable supplies (Asche et al., Citation2019; Citation2022c; Oglend et al., Citation2022; Straume et al., Citation2024).
While production for many years was responsive to price signals (Andersen et al., Citation2008), this is no longer so due to the tight production regulations, resulting in increased price levels and volatility (Asche et al., Citation2019; Bloznelis, Citation2016; Dahl et al., Citation2021; Dahl & Yahya, Citation2019; Oglend, Citation2013; Zitti, Citation2023), and profitability (Asche et al., Citation2018; Misund & Nygård, Citation2018) as demand growth has continued to be strong (Brækkan et al., Citation2018; Brækkan & Thyholdt, Citation2014).
The rent tax
The discussion of extraordinary taxation of Norwegian aquaculture goes back to the late 1990s. Following very low prices in the late 1980s and early 1990s, several companies were in dire financial straits and were acquired by other farming companies. While previous regulations prohibited companies from owning more than one license, these rules were relaxed in 1991, leading to a substantial industry consolidation over the following decade (Asche et al., Citation2013). Concurrently, the authorities also issued a moratorium on new licensing rounds, making acquisitions the primary option for companies to grow and one could observe that licenses or the right to produce salmon became valuable. Consequently, the market prices of farming licenses soared, possibly exacerbated by one large company’s willingness to pay very high license prices (Berge, Citation2004). Observing this development, policymakers started discussing how society could benefit from the high market valuation of farming licenses. After some deliberations, including discussing “oil taxes,” “license fees” and “area fees,” the Norwegian Parliament decided in 2002 to capture economic rents by selling farming licenses at fixed fees. The Parliament explicitly stated that the buyers of the licenses took on full financial risk from future market prices deviating from the fixed fee (Od.Prop. 65, Citation2000), suggesting that the level of pricing used by the authorities reflected this risk element.
The fixed license fee was the main vehicle for capturing a share of the extraordinary profits (in addition to ordinary corporate taxation) over the next 20 years. Often, the ownership of the licenses was linked to some specific requirements and expectations related to competence, ownership, contribution to local value-creation, linked to specific municipalities, gender, ethnicity, and environmental emissions (Hersoug, Citation2022), and thus would arguably have a lower market value than if the licenses were allocated without these constraints. However, in 2014 a handful of licenses was also auctioned out, revealing a much higher willingness to pay than the fixed fee (Hersoug et al., Citation2021b).
At the same time, local municipalities were arguing for an area fee. They asserted that more of the revenues from the industry should also benefit the municipalities where aquaculture production takes placeFootnote5. Several proposals for an area fee were launched, and in different forms. In 2008, a fee on sea area use was evaluated, but it was concluded that an area fee would be too difficult to implement in practice, and instead a special property tax was introduced (Meld. St. 16, Citation2014). In an attempt to provide local municipalities with more revenues from aquaculture, a later government instead created a special fund called “Havbruksfondet” (The Aquaculture Fund) in 2015, which was tasked with collecting the revenues from the sales of new licenses and subsequently sharing the funds between municipalities with aquaculture activities (80 percent) and the state (20 percent). Although the fund increased payments to aquaculture municipalities, local policymakers argued that the stream of fund payments were uncertain and erratic and that they would prefer more stable payments. In 2019, a salmon aquaculture tax commission suggested a rent tax of 40 percent (NOU 2019:18, 2019). While this was rejected, a production fee of 0.4 NOK/kg was implemented as of January 2021 (Meld. St. 2 (Citation2019–2020), pp. 73–74). Simultaneously, there were efforts to introduce an alternative rent capture mechanism, a special profit tax.
On September 28, 2022 a new rent tax was proposed. In the original proposal the tax rate would be 40 percent. The initial proposal of September 28th also included a tax allowance of 54 or 67.5 MNOK after tax per license to shield the smallest companies from paying the special tax (The Norwegian Ministry of Finance, 2022). After several sets of negotiations the rent tax was set at 25 percent and introduced from January 1, 2023.
Data
The sample period spans from August 2, 2022 to February 1, 2023, and the daily returns for each company were collected from Yahoo Finance, and the empirical studies were carried out in R Studio. We employ the difference-in-differences approach to investigate the impact of the rent tax announcement and implementation on Norwegian aquaculture. This methodology requires us to categorize companies into either a treatment group or a control group.
Our sample is salmon farming companies are listed on the Oslo Stock Exchange or Euronext Growth Oslo, as they match our other criteria.Footnote6 We exclude companies that primarily are engaged in land-based farming, as they differ from our treatment group in several dimensions with their technological novelty and challenges among the main challenges. Finally, Austevoll Seafood ASA was excluded from the study due to its majority ownership of Lerøy Seafood Group, which is already included in the analysis. As such, our sample comprises eight salmon-producing companies. The treatment group consists of four large Norwegian companies affected by the rent tax. These companies are Mowi, Salmar, Lerøy Seafood Group and Grieg Seafood. They are all well-known among the largest producers of salmon in Norway as well as in the world (Pandey et al., Citation2023), and the impact of the tax may vary as their exposure to the tax is impacted by the share of their production in other countries.
The control group consist of companies operating outside of Norway and should, therefore, be unaffected by the implementation of the rent tax in Norwegian aquaculture. These companies include Bakkafrost, Ice Fish Farm, Icelandic Salmon and Arctic Fish Holding. Bakkafrost is the largest producer of salmon in the Faroe Islands and is the only company within our control group listed on the Oslo Stock Exchange. Both Ice Fish Farm and Icelandic Salmon are holding companies. Ice Fish Farm is one of the leading salmon farmers in Iceland, while Icelandic Salmon holds exclusive ownership of Arnarlax, the largest farmer and producer of salmon in Iceland. Arctic Fish Holding is the sole owner of Arctic Fish, one of Iceland’s leading salmon farmers. It is worth mentioning that Salmar owns the majority stake in Icelandic Salmon, and Mowi has the majority stake in Arctic fish.
presents an overview and descriptive statistics for the companies included in our paper.
Table 1. Descriptive statistics of the returns of the companies.
After choosing the companies and the length of the sample period, we are left with a total of 1048 observations (131 observations for each of the eight companies) in . The spread between minimum and maximum values shows that stock prices for the treatment group fell more than the control group during the sample period. The median, mean, and standard deviation (SD) for both groups show similar values. The skewness (SKEW) for the treatment group is negative and high compared to the control group. As for the kurtosis (KURT), the treatment group have relatively high values here as well. These findings indicate that there are more extreme and negative returns found within the treatment group, possibly indicating that the tax announcement had an effect. However, this is just an initial observation based on the descriptive statistics. Section “Results” will further analyze the treatment effect by applying difference-in-differences regression models.
Cumulative returns
We calculate cumulative returns for the companies individually over the sample period. The equation to calculate cumulative returns is composed as follows:
(1)
(1)
Where Rci,t is the cumulative return of company i at time t. The subscript, i, denotes different companies, and t is indexing time (trading days). The variable Pi,t represents the price of company i at day t. Finally, Pi,0, represents the price of company i at time 0, the starting point of the period in which we calculate the cumulative returns.
presents the plot of the cumulative returns for each company in our paper based on EquationEquation (1)(1)
(1) . The companies are separated into treatment and control groups. The two vertical dashed lines indicate respectively the date of the tax announcement in red and the tax implementation date in purple.
Figure 2. Plot of cumulative returns for treatment and control groups.
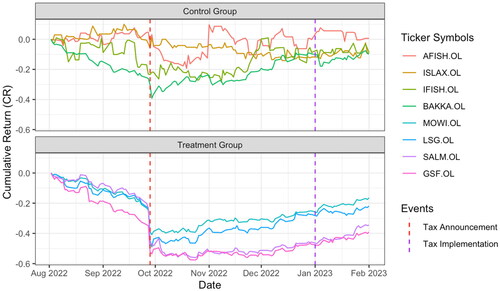
shows a downward trend in the stock prices before the announcement date, indicating that the market is declining prior to the announcement. Moreover, the market shows a negative reaction on the announcement day in the lower panel. In the upper panel, the control companies appear to be affected much less. Additionally, there are signs of recovery for cumulative returns in most companies after the announcement date.
Methodology
The difference-in-differences approach is a commonly known econometrics technique used to estimate the impact of policy changes by comparing a group that is affected by the change (treatment group) with a group that is not (control group) (Fredriksson & Oliveira, Citation2019; Lechner, Citation2010). The approach is a suitable method for our paper as we have a treatment group affected by the rent tax in Norway and a control group unaffected by this tax. We apply the difference-in-differences approach to measure the impact that the announcement and implementation day had on the companies in our paper. The first model is given as:
(5)
(5)
Where Yi,t is the returns of the companies in our paper. Treati and Announcementt are dummy variables that have values equal to 1 for companies within the treatment group and equal to 0 for companies in the control group. A regression is run for each event window. The interaction term, Treati * Announcementt, shows the difference in returns for the treatment group relative to the control group, as it captures the causal effect of the treatment.
The second regression is given as:
(6)
(6)
The difference between EquationEquations (5)
(5)
(5) and Equation(6)
(6)
(6) is that Announcementt has been changed to Implementationt as we there investigate the impact of the implementation day. In both cases, we consider two event windows. To capture the impact of the rent tax, the first window only includes the relevant (announcement/implementation) day, and the second window includes the relevant day plus the following trading day.
Results
presents the results from the first two regression models. In regression (0), the variable Announcementt is equal to 1 for only the announcement day while in regression (0,1), the variable Announcementt is equal to 1 for announcement day and the following trading day.Footnote7
Table 2. Difference-in-differences model for returns on announcement day with robust standard errors.
In regression (0) the coefficient of the Announcementt variable is negative, statistically significant at the 1 percent level, and shows negative daily return by an estimated 4.2 percent on the announcement day. This implies that the daily returns for the control group were, on average −4.2 percent on the announcement day. Thus, the news surrounding the rent tax may have influenced the market and had a negative impact on the Norwegian industry’s return because of the uncertainty around the tax.
Our main variable of interest is Treati * Announcementt (interaction term) as this measures the effect that the treatment had on the treatment group relatively to the control group. We observe that the interaction term yields a negative return, as the treatment group’s daily return is −21.6 percent relative to the control group, and it is statistically significant at the 1 percent level. This implies that there is strong evidence that the rent tax announcement had a negative impact on the returns of the affected companies.
In regression (0,1), we investigate the announcement, assuming that announcement has impact on the announcement day and the following trading day. First, we observe that regression (0) has higher explanatory power than regression (0,1). The interaction term, Treati * Announcementt, is still significant at the 1 percent level. It yields a return 13.2 percent lower for the treatment group relative to the control group. The magnitude of the treatment effect is approximately twice as large when only considering the exact day of the tax announcement compared to adding another trading day to the regression. This implies that the most significant part of the effect occurs immediately on the announcement day. In , the greatest drop in returns is observable on the announcement day for the treated companies. Specification (0,1) spread the announcement effect over two days, and therefore the estimated impact per trading day is approximately one half.
The rent tax was implemented as of January 1, 2023. As the first trading day on the Oslo Børs All Share Index was January 2, we consider this as the implementation day in our regression analysis ().
Table 3. Difference-in-differences model for returns on implementation day with robust standard errors.
The interaction term, Treati * Implementationt is statistically significant at the 5 percent level in regression (0) while it is not statistically significant in regression (0.1). Hence, a minor decrease was observed for the treatment group, consistent with , which shows a small decline at the implementation date. The effect found on the announcement day is economically minimal and indicates that the market already mostly adjusted for the rent tax on the announcement day, as shown in . This result is consistent with the efficient market hypothesis, where only new information will move stock prices (Fama, Citation1970).
There is very little research on the stock market implications of the introduction of rent taxation simply because this form of taxation is very uncommon, especially in the food production industry. There is, however, a more extensive literature on the effects of changes in corporate tax rates on the stock market, concluding that, in line with economic theory, announcements of tax changes will impact stock price returns. However, a recent study finds that the financial impact of this information may not be incorporated in stock returns immediately, and investors might not even fully or quickly integrate tax change information (Wang & Macy, Citation2021). Hence, the market reaction in our study may not have fully incorporated the effects of the tax announcement but may do so over time as more information on the effects on the firm’s cash flows of the rent tax is revealed.
Concluding remarks
In September 2022, the Norwegian government announced it wanted to implement a rent tax in Norwegian aquaculture as of January 2023. This paper investigates the impact of the rent tax announcement and its implementation on Norwegian salmon farming companies. Our data sample consists of eight salmon-producing companies, and our sample period spans from August 2, 2022 to February 1, 2023, covering both the day of announcement and implementation.
According to our findings, the treatment group experienced a significant negative effect on their stock price due to the announcement of the rent tax during our sample period. Our analysis reveals that there was an estimated 21.6 percent decrease in stock price for the treatment group relative to the control group on the announcement day. On the other hand, we find weak or no effect (depending on the model specification) on the implementation day. This implies that the market already adjusted to the rent tax in the days following the announcement, which is in line with the efficient market hypothesis.
The process of implementing the rent tax in Norwegian aquaculture can be characterized as an untidy process. Since the announcement in September 2022 and up until the Parliament adopted the revised proposal in May 2023, many companies in the Norwegian salmon industry voiced confusion and frustration with the implementation process. It is well known from the literature that uncertainty about future tax changes can have an adverse impact on corporate investments (Kydland & Prescott, Citation1977). Shortly after the government announcement in 2022, planned investments were put on hold, as a direct consequence of the proposal, and a survey released in February 2024 showed that around 75 percent of the postponed investment values were still on hold nearly one and a half years later (NHHSC, Citation2024). According to our findings, there was a sudden decrease in stock prices of affected companies on the day of the announcement. This could imply that investors might look elsewhere for better investment opportunities. One might argue that a more thorough investigation before the announcement could have led to less uncertainty within the industry and possibly prevented some of the investment from being pulled or held back.
The industry’s production growth had already begun to stagnate in 2012 despite an increase in margins. The current license system limits the industry’s ability to grow production, even though their margins and the salmon price kept increasing (Hersoug, Citation2021; Misund & Nygård, Citation2018). While fewer new licenses and sites are made available to the industry than in previous years, it has been possible to grow along the intensive margin for some time (Oglend & Soini, Citation2020). Still, this option appears to have been reduced, and since 2021, production has remained fairly constant. The growth limitations in inshore aquaculture using conventional open cage technology have motivated interest in alternative production technologies, such as sea-based semi-closed containment systems (Nilsen et al., Citation2020; Bjørndal & Tusvik, Citation2020), offshore farming (Føre et al., Citation2022) and land-based plants (Bjørndal & Tusvik, Citation2019). Although alternative production technologies are more expensive than conventional open cages, the exemption from the special tax for land-based and offshore aquaculture will reduce the gaps in investment profitability between alternative and conventional technologies, which could stimulate investmentsFootnote8. On the other hand, the industry has argued that a special tax could be introduced in the future after the investments have been made, increasing the expected effective tax rate above the marginal tax rate and that this uncertainty around future tax changes will in itself give investments disincentives. This latter line of argument is consistent with the conclusions of Kydland and Prescott (Citation1977).
Since the implementation of the rent tax has been ongoing up until May 2023 (and some details will not be finalized before the end of 2024), our research offers insight to into the impact of tax announcement on stock returns on both the announcement date and the time until implementation. Our analysis shows that the tax announcement had a significant negative impact on the value of the affected companies. Even though some salmon farming companies have generated large profit margins and can handle the impact and losses in the short term, this might not be the case for smaller companies, especially if the effect is sustained over a longer period since small companies are subject to a larger proportion of distortive taxes such as the production fee and payment for licenses. Moreover, a complicated tax system will favor those companies that can acquire specialized knowledge and competence on reporting to tax authorities, since larger companies can more easily make adaptations (e.g. through transfer pricing) which can reduce their tax burden compared to smaller companiesFootnote9. In the worst case, this could lead to compulsory sales of smaller companies to larger corporations.
On the other hand, smaller companies are partly shielded from the special tax, so their tax burden will likely be lower than that of the largest firms. Since the tax was introduced in 2023, it is too early to conclude on its potentially distortive effects. We leave that up to future empirical research to investigate if there have been efficiency losses due to investment disincentives of the special tax.
Acknowledgments
The authors wish to thank two anonymous reviewers for their useful comments improving the revised manuscript.
Disclosure statement
Bård Misund has during the implementation period of the rent tax participated in unpaid consultation (answering questions related to the tax and held presentations) with Norwegian aquaculture companies, banks, industry interest groups, research institutes, law firms, and local municipalities related to the rent tax. In August and September 2023 Misund participated on a report on price formation in salmon markets funded by the aquaculture industry. The other authors declare no conflict of interests related to this article. He has also previously consulted for Mowi, Salmar, Lerøy, Grieg and Cermaq.
Additional information
Funding
Notes
1 The economic profit between 1986 and 2004 was 1.05 NOK/kilo (WFE) and between 2005 and 2022 it was 4.90 NOK/kilo (WFE). Economic profit is calculated as operating profit less a cost of capital of 8 percent multiplied by total assets, per kilo WFE, and adjusted with inflation (2023 as base year).
2 Temporary rents (see e.g. Marshall, Citation1890).
3 Several studies suggest that existence of inframarginal rents in fisheries, including ‘skipper’ rents which is a form of skill rent (Arnason et al., Citation2018; Coglan & Pascoe, Citation1999; Grainger & Costello, Citation2016).
5 A recent study indicates that equitable share of the profits generated in the salmon industry is an important factor for municipalities’ perceptions of aquaculture (Misund et al., 2023).
6 Several studies examine the relationship between salmon prices and stock prices (Dahl et al., Citation2021; Itemgenova & Sikveland, Citation2020; Misund, Citation2018; Misund & Nygård, Citation2018; Steen & Jacobsen, Citation2020; Zhang et al., Citation2016). Other studies on financial instruments used in the salmon industry focus on futures contracts (Ankamah-Yeboah et al., Citation2017; Asche et al., Citation2015; Asche et al., Citation2016; Ewald et al., Citation2022; Oglend & Straume, Citation2020; Schütz & Westgaard, Citation2018) or reference prices (Oglend et al., 2022).
7 We performed diagnosis checks for both regression models in and to investigate the presence of autocorrelation or heteroskedasticity in the empirical models. The test in our paper checks for heteroskedasticity using the Breusch-Pagan (BP) test and for autocorrelation, the Durbin-Watson (DW) test is used (Evans, 1992). The BP test indicates that heteroskedasticity is present in both models. Similarly, the DW test also suggests that there is evidence of autocorrelation, and the standard errors are therefore made robust using White (Citation1980) correction.
8 A recent study documents investment behaviour in salmon aquaculture documents is sensitive to the levels of cash flows generated (Landazuri-Tveteraas et al., Citation2023).
9 We thank an anonymous reviewer for pointing this out to us.
References
- Afewerki, S., Asche, F., Misund, B., Thorvaldsen, T., & Tveteras, R. (2023). Innovation in the Norwegian aquaculture industry. Reviews in Aquaculture, 15(2), 759–771. https://doi.org/10.1111/raq.12755
- Åm, H. (2021). A critical policy study on why introducing resource rent taxation in Norwegian salmon aquaculture failed. Marine Policy, 131, 104692. https://doi.org/10.1016/j.marpol.2021.104692
- Andersen, T. B., Roll, K. H., & Tveterås, S. (2008). The price responsiveness of salmon supply in the short and long run. Marine Resource Economics, 23(4), 425–437. https://doi.org/10.1086/mre.23.4.42629673
- Ankamah-Yeboah, I., Nielsen, M., & Nielsen, R. (2017). Price formation of the salmon aquaculture futures market. Aquaculture Economics & Management, 21(3), 376–399. https://doi.org/10.1080/13657305.2016.1189014
- Aponte, F. R. (2020). Firm dispersion and total factor productivity: Are Norwegian salmon producers less efficient over time? Aquaculture Economics & Management, 24(2), 161–180. https://doi.org/10.1080/13657305.2019.1677803
- Arnason, R., Bjørndal, T., Gordon, D. V., & Bezabih, M. (2018). Measuring potential rents in the North Sea herring fishery. American Journal of Agricultural Economics, 100(3), 889–905. https://doi.org/10.1093/ajae/aay003
- Asche, F. (1997). Trade disputes and productivity gains: The curse of farmed salmon production. Marine Resource Economics, 12(1), 67–73. https://doi.org/10.1086/mre.12.1.42629183
- Asche, F. (2001). Testing the effect of an anti-dumping duty: The US salmon market. Empirical Economics, 26(2), 343–355. https://doi.org/10.1007/s001810000043
- Asche, F. (2008). Farming the sea. Marine Resource Economics, 23(4), 527–547. https://doi.org/10.1086/mre.23.4.42629678
- Asche, F., Eggert, H., Oglend, A., Roheim, C. A., & Smith, M. D. (2022a). Aquaculture: Externalities and policy options. Review of Environmental Economics and Policy, 16(2), 282–305. https://doi.org/10.1086/721055
- Asche, F., Hansen, H., Tveteras, R., & Tveterås, S. (2009). The salmon disease crisis in Chile. Marine Resource Economics, 24(4), 405–411. https://doi.org/10.1086/mre.24.4.42629664
- Asche, F., Misund, B., & Oglend, A. (2016). The spot-forward relationship in the Atlantic salmon market. Aquaculture Economics & Management, 20(2), 222–234. https://doi.org/10.1080/13657305.2016.1156192
- Asche, F., Misund, B., & Oglend, A. (2019). The case and cause of salmon price volatility. Marine Resource Economics, 34(1), 23–38. https://doi.org/10.1086/701195
- Asche, F., Oglend, A., & Selland Kleppe, T. (2017). Price dynamics in biological production processes exposed to environmental shocks. American Journal of Agricultural Economics, 99(5), 1246–1264. https://doi.org/10.1093/ajae/aax048
- Asche, F., Oglend, A., & Zhang, D. (2015). Hoarding the herd: The convenience of productive stocks. Journal of Futures Markets, 35(7), 679–694. https://doi.org/10.1002/fut.21679
- Asche, F., Pincinato, R. B. M., & Tveteras, R. (2022b). Productivity in global aquaculture. In S. C. Ray, R. G. Chambers, & S. C. Kumbhakar (Eds.), Handbook of production economics (pp. 1525–1561). Springer Nature Singapore.
- Asche, F., Roll, K. H., Sandvold, H. N., Sørvig, A., & Zhang, D. (2013). Salmon aquaculture: Larger companies and increased production. Aquaculture Economics & Management, 17(3), 322–339. https://doi.org/10.1080/13657305.2013.812156
- Asche, F., Sikveland, M., & Zhang, D. (2018). Profitability in Norwegian salmon farming: The impact of firm size and price variability. Aquaculture Economics & Management, 22(3), 306–317. https://doi.org/10.1080/13657305.2018.1385659
- Asche, F., Yang, B., Gephart, J. A., Smith, M. D., Anderson, J. L., Camp, E. V., Garlock, T. M., Love, D. C., Oglend, A., & Straume, H.-M. (2022c). China’s seafood imports: Not for domestic consumption? Science, 375(6579), 386–388. https://doi.org/10.1126/science.abl475
- Berge, A. (2004). Salmon fever. Octavian Publishing.
- Bjørndal, T., & Tusvik, A. (2019). Economic analysis of land based farming of salmon. Aquaculture Economics & Management, 23(4), 449–475. https://doi.org/10.1080/13657305.2019.1654558
- Bjørndal, T., & Tusvik, A. (2020). Economic analysis of on-growing of salmon post-smolts. Aquaculture Economics & Management, 24(4), 355–386. https://doi.org/10.1080/13657305.2020.1737272
- Black, B. S. (2001). The legal and institutional preconditions for strong securities markets. UCLALaw, 48, 781–856.
- Bloznelis, D. (2016). Salmon price volatility: A weight-class-specific multivariate approach. Aquaculture Economics & Management, 20(1), 24–53. https://doi.org/10.1080/13657305.2016.1124936
- Brækkan, E. H., & Thyholdt, S. B. (2014). The bumpy road of demand growth—an application to Atlantic salmon. Marine Resource Economics, 29(4), 339–350. https://doi.org/10.1086/678927
- Brækkan, E. H., Thyholdt, S. B., Asche, F., & Myrland, Ø. (2018). The demands they are a-changin. European Review of Agricultural Economics, 45(4), 531–552. https://doi.org/10.1093/erae/jby003
- Coglan, L., & Pascoe, S. (1999). Separating resource rents from intra-marginal rents in fisheries’ economic survey data. Agricultural and Resource Economics Review, 28(2), 219–228. https://doi.org/10.1017/S1068280500008212
- Dahl, R. E., & Yahya, M. (2019). Price volatility dynamics in aquaculture fish markets. Aquaculture Economics & Management, 23(3), 321–340. https://doi.org/10.1080/13657305.2019.1632390
- Dahl, R. E., Oglend, A., & Yahya, M. (2021). Salmon stock market prices revealing salmon price information. Marine Resource Economics, 36(2), 173–190. https://doi.org/10.1086/713769
- Estay, M., & Stranlund, J. K. (2022). Entry, location, and optimal environmental policies. Resource and Energy Economics, 70, 101326. https://doi.org/10.1016/j.reseneeco.2022.101326
- Evans, M. (1992). Robustness of size of tests of autocorrelation and heteroscedasticity to nonnormality. Journal of Econometrics, 51(1-2), 7–24. https://doi.org/10.1016/0304-4076(92)90027-O
- Ewald, C. O., Haugom, E., Kanthan, L., Lien, G., Salehi, P., & Størdal, S. (2022). Salmon futures and the fish pool market in the context of the CAPM and a three-factor model. Aquaculture Economics & Management, 26(2), 171–191. https://doi.org/10.1080/13657305.2021.1958105
- Fama, E. F. (1970). Efficient capital markets: A review of theory and empirical work. The Journal of Finance, 25(2), 383–417. https://doi.org/10.2307/2325486
- Finansdepartementet. (2022). Høringsnotat—Grunnrenteskatt på havbruk. https://www.regjeringen.no/contentassets/dfe403fd8a8b4d40af2165583e25c747/horingsnotat-grunnrenteskatt-pa-havbruk.pdf.
- Føre, H. M., Thorvaldsen, T., Osmundsen, T. C., Asche, F., Tveterås, R., Fagertun, J. T., & Bjelland, H. V. (2022). Technological innovations promoting sustainable salmon (Salmo salar) aquaculture in Norway. Aquaculture Reports, 24, 101115. https://doi.org/10.1016/j.aqrep.2022.101115
- Fredriksson, A., & Oliveira, G. M. D (2019). Impact evaluation using difference-in-differences. RAUSP Management Journal, 54(4), 519–532. https://doi.org/10.1108/RAUSP-05-2019-0112
- Garnaut, R., & Ross, A. C. (1977). The neutrality of the resource rent tax. Economic Record, 55(3), 193–201. https://doi.org/10.1111/j.1475-4932.1979.tb02221.x
- Grainger, C. A., & Costello, C. (2016). Distributional effects of the transition to property rights for a common-pool resource. Marine Resource Economics, 31(1), 1–26. https://doi.org/10.1086/684132
- Hersoug, B. (2021). Why and how to regulate Norwegian salmon production? – The history of maximum allowable biomass (MAB). Aquaculture, 545, 737144. https://doi.org/10.1016/j.aquaculture.2021.737144
- Hersoug, B. (2022). “One country, ten systems”–The use of different licensing systems in Norwegian aquaculture. Marine Policy, 137, 104902. https://doi.org/10.1016/j.marpol.2021.104902
- Hersoug, B., Mikkelsen, E., & Osmundsen, T. C. (2021a). What’s the clue; better planning, new technology or just more money?-The area challenge in Norwegian salmon farming. Ocean & Coastal Management, 199, 105415. https://doi.org/10.1016/j.ocecoaman.2020.105415
- Hersoug, B., Olsen, M. S., Gauteplass, A. Å., Osmundsen, T. C., & Asche, F. (2021b). Serving the industry or undermining the regulatory system? The use of special purpose licenses in Norwegian salmon aquaculture. Aquaculture, 543, 736918. https://doi.org/10.1016/j.aquaculture.2021.736918
- Itemgenova, A., & Sikveland, M. (2020). The determinants of the price-earnings ratio in the Norwegian aquaculture industry. Journal of Commodity Markets, 17, 100089. https://doi.org/10.1016/j.jcomm.2019.04.001
- Jensen, F., Tveterås, R., & Nielsen, R. (2024). The traffic light system. Is it a solution to a nonpoint pollution problem? Aquaculture Economics & Management, 1–31. https://doi.org/10.1080/13657305.2024.2301993
- Kinnucan, H. W., & Myrland, Ø. (2006). The effectiveness of antidumping measures: some evidence for farmed Atlantic salmon. Journal of Agricultural Economics, 57(3), 459–477. https://doi.org/10.1111/j.1477-9552.2006.00060.x
- Kumar, G., & Engle, C. R. (2016). Technological advances that led to growth of shrimp, salmon, and tilapia farming. Reviews in Fisheries Science & Aquaculture, 24(2), 136–152. https://doi.org/10.1080/23308249.2015.1112357
- Kydland, F. E., & Prescott, E. C. (1977). Rules rather than discretion: The inconsistency of optimal plans. Journal of Political Economy, 85(3), 473–491. https://doi.org/10.1086/260580
- Landazuri-Tveteraas, U., Misund, B., Tveterås, R., & Zhang, D. (2023). Determinants of investment behavior in Norwegian salmon aquaculture. Aquaculture Economics & Management, 27(4), 790–808. https://doi.org/10.1080/13657305.2023.2208541
- Larsen, M. L., & Vormedal, I. (2021). The environmental effectiveness of sea lice regulation: compliance and consequences for farmed and wild salmon. Aquaculture, 532, 736000. https://doi.org/10.1016/j.aquaculture.2020.736000
- Lechner, M. (2010). The estimation of causal effects by difference-in-difference methods. Foundations and Trends® in Econometrics, 4(3), 165–224. https://doi.org/10.1561/0800000014
- Luthman, O., Jonell, M., & Troell, M. (2019). Governing the salmon farming industry: Comparison between national regulations and the ASC salmon standard. Marine Policy, 106, 103534. https://doi.org/10.1016/j.marpol.2019.103534
- Marshall, A. (1890). Principles of Political Economy. Macmillan.
- Mbanga, C. L., & Darrat, A. F. (2016). Fiscal policy and the US stock market. Review of Quantitative Finance and Accounting, 47(4), 987–1002. https://doi.org/10.1007/s11156-015-0528-y
- Meld. St. 16. (2014). Stortingsmelding no. 16 (2014–2015). The Norwegian Ministry of Trade and Fisheries. https://www.regjeringen.no/contentassets/6d27616f18af458aa930f4db9492fbe5/no/pdfs/stm201420150016000dddpdfs.pdf.
- Meld. St. 2. (2019). Stortingsmelding no. 2 (2019–2020). Revidert nasjonalbudsjett 2020. The Norwegian Ministry of Finance. https://www.regjeringen.no/contentassets/f7f31a9baf3e49c1ad1fa72da5585003/no/pdfs/stm201920200002000dddpdfs.pdf.
- Misund, B. (2017). Financial ratios and prediction on corporate bankruptcy in the Atlantic salmon industry. Aquaculture Economics & Management, 21(2), 241–260. https://doi.org/10.1080/13657305.2016.1180646
- Misund, B. (2018). Common and fundamental risk factors in shareholder returns of Norwegian salmon producing companies. Journal of Commodity Markets, 12, 19–30. https://doi.org/10.1016/j.jcomm.2017.12.007
- Misund, B., & Nygård, R. (2018). Big fish: Valuation of the world’s largest salmon farming companies. Marine Resource Economics, 33(3), 245–261. https://doi.org/10.1086/698447
- Misund, B., & Tveterås, R. (2020). Economic rents in Norwegian aquaculture. NORCE Report no. 39 2020. https://norceresearch.brage.unit.no/norceresearch-xmlui/handle/11250/2837743.
- Misund, B., Olsen, M. S., Osmundsen, T. C., & Tveterås, R. (2023). The political economy of salmon aquaculture: Value sharing and societal support for aquaculture in Norway. Marine Resource Economics, 38(4), 365–390. https://doi.org/10.1086/726242
- NHHSC. (2024). Lakseskatten - ett år med tapte muligheter. NHHS Consulting report no.1/2024. https://www.nhhsconsulting.no/_files/ugd/217e2c_29a2ec98eb914681950b0c3245d13ed4.pdf
- Nilsen, A., Nielsen, K. V., & Bergheim, A. (2020). A closer look at closed cages: Growth and mortality rates during production of post-smolt Atlantic salmon in marine closed confinement systems. Aquacultural Engineering, 91, 102124. https://doi.org/10.1016/j.aquaeng.2020.102124
- NOU 2019: 18. (2019). Skattlegging av havbruksvirksomhet. Finansdepartementet. https://www.regjeringen.no/no/dokumenter/nou-2019-18/id2676239/.
- Od.Prop. 65. (2000). Odeltingsproposisjon nr. 65 (2000-2001). https://www.regjeringen.no/no/dokumenter/otprp-nr-65-2000-2001-/id164980/
- Oglend, A. (2013). Recent trends in salmon price volatility. Aquaculture Economics & Management, 17(3), 281–299. https://doi.org/10.1080/13657305.2013.812155
- Oglend, A., & Soini, V. H. (2020). Implications of entry restrictions to address externalities in aquaculture: The case of salmon aquaculture. Environmental and Resource Economics, 77(4), 673–694. https://doi.org/10.1007/s10640-020-00514-0
- Oglend, A., & Straume, H. M. (2020). Futures market hedging efficiency in a new futures exchange: Effects of trade partner diversification. Journal of Futures Markets, 40(4), 617–631. https://doi.org/10.1002/fut.22088
- Oglend, A., Asche, F., & Straume, H.-M. (2022). Estimating pricing rigidities in bilateral transactions markets. American Journal of Agricultural Economics, 104(1), 209–227. https://doi.org/10.1111/ajae.12230
- Oglend, A., Asche, F., & Straume, H.-M. (2024). Rent formation and distortions due to quotas in biological production processes. Resource and Energy Economics, 77, 101438. https://doi.org/10.1016/j.reseneeco.2024.101438
- Osmundsen, T., Olsen, M. S., Gauteplass, A., & Asche, F. (2022). Aquaculture policy: Designing licenses for environmental regulation. Marine Policy, 138, 104978. https://doi.org/10.1016/j.marpol.2022.104978
- Pandey, R., Asche, F., Misund, B., Nygaard, R., Adewumi, O. M., Straume, H. M., & Zhang, D. (2023). Production growth, company size, and concentration: The case of salmon. Aquaculture, 577, 739972. https://doi.org/10.1016/j.aquaculture.2023.739972
- Prop. 1 LS. (2022–2023). For budsjettåret 2023—Skatter, avgifter og toll 2023 (pp. 128–131). Finansdepartementet. https://www.regjeringen.no/no/dokumenter/prop.-1-ls-20222023/id2931482/
- Roll, K. H. (2013). Measuring performance, development and growth when restricting flexibility. Journal of Productivity Analysis, 39(1), 15–25. https://doi.org/10.1007/s11123-012-0265-3
- Sandersen, H. T., & Kvalvik, I. (2015). Access to aquaculture sites: A wicked problem in Norwegian aquaculture development. Maritime Studies, 14(1), 10. https://doi.org/10.1186/s40152-015-0027-8
- Schütz, P., & Westgaard, S. (2018). Optimal hedging strategies for salmon producers. Journal of Commodity Markets, 12, 60–70. https://doi.org/10.1016/j.jcomm.2017.12.009
- Schwerhoff, G., Edenhofer, O., & Fleurbaey, M. (2020). Taxation of economic rents. Journal of Economic Surveys, 34(2), 398–423. https://doi.org/10.1111/joes.12340
- Sikveland, M., Tveterås, R., & Zhang, D. (2022). Profitability differences between public and private firms: The case of Norwegian salmon aquaculture. Aquaculture Economics & Management, 26(4), 414–438. https://doi.org/10.1080/13657305.2021.1970856
- Steen, M., & Jacobsen, F. (2020). Modeling the return distribution of salmon farming companies: A quantile regression approach. Aquaculture Economics & Management, 24(3), 310–337. https://doi.org/10.1080/13657305.2020.1765896
- Straume, H.-M., Asche, F., & Oglend, A. (2024). Intermediaries in Norwegian salmon exports. Aquaculture, 581, 740437. https://doi.org/10.1016/j.aquaculture.2023.740437
- Wang, H., & Macy, A. (2021). Statutory corporate tax change and the stock market returns: The global experience. Applied Economics Letters, 28(6), 464–469. https://doi.org/10.1080/13504851.2020.1761523
- White, H. (1980). A heteroskedasticity-consistent covariance matrix estimator and a direct test for heteroskedasticity. Econometrica, 48(4), 817–838. https://doi.org/10.2307/1912934
- Young, N., Brattland, C., Digiovanni, C., Hersoug, B., Johnsen, J. P., Karlsen, K. M., Kvalvik, I., Olofsson, E., Simonsen, K., Solås, A.-M., & Thorarensen, H. (2019). Limitations to growth: Social-ecological challenges to aquaculture development in five wealthy nations. Marine Policy, 104, 216–224. https://doi.org/10.1016/j.marpol.2019.02.022
- Zhang, D., & Tveterås, R. (2022). Influence of price variability and financial ratios on business failure in the Atlantic salmon industry. Marine Resource Economics, 37(2), 183–200. https://doi.org/10.1086/718380
- Zhang, D., Myrland, Ø., & Xie, J. (2016). Firm size, commodity price, and interdependence between firm-level stock prices: The case of Norwegian salmon industry. Applied Economics and Finance, 3(4), 179–189.
- Zitti, M. (2023). Forecasting salmon market volatility using long short-term memory (LSTM). Aquaculture Economics & Management, 1–33. https://doi.org/10.1080/13657305.2023.2255346