
Abstract
Objectives: To assess the association between triglyceride (TG)/high density lipoprotein (HDL) ratio and benign prostate hyperplasia/lower urinary tract symptoms (BPH/LUTS).
Methods: Four hundred patients who were admitted to the Urology Clinic between January and December 2014 with complaints of BPH/LUTS were enrolled in this cross-sectional study. Patients were divided into two groups according to their International Prostate Symptom Score and prostate volume (PV). They were compared in terms of age, body mass index (BMI), PV, PSA, post micturional residual volume, uroflowmetry Q max value, fasting blood sugar, TG and high density lipoprotein-cholesterol (HDL-C) level and TG/HDL ratio.
Results: Although univariate analyses reveal that age, BMI, waist circumference (WC), FBS, TG, HDL-C level, and TG/HDL ratio were correlated with PV, only age [1.125 OR (1.088–1.164), p = .00001], BMI [1.119 OR (1.040–1.204), p = .003], TG [(1.043 OR (1.016–1.071), p = .002], HDL-C [(0.923 OR (0.860–0.990), p = .025], and TG/HDL ratio [(1.224 OR (1.130–1.315), p = .014] were statistically significant in multivariate analysis. The calculated area under the curve (AUC) for PV of 30 ml, 40 ml, and 50 ml was 0.668 (0.608–0.727), 0.617 (0.561–0.673), and 0.592 (0.530–0.654), respectively.
Conclusions: Our results indicate that the TG/HDL ratio correlates with enhancement in PV. Further studies are warranted to better evaluate this relationship.
Introduction
Benign prostate hyperplasia (BPH) is a prevalent process in aging men with severe and frequent low urinary symptoms reducing the quality of life [Citation1]. Despite intense research to identify the underlying mechanism of prostatic growth, the cause and effect relationship has not yet been established [Citation2,Citation3]. The etiology of BPH is still unclear, but multiple partially overlapping and complementary systems (nerve, endocrine, immune, and vascular) as well as local factors are likely to be involved [Citation2,Citation4].
It is well known that BPH is a chronic hyperplastic process dependent on androgen stimuli. However, the incidence of BPH increases with age among elderly man whose blood testosterone levels decline with ageing. This is suggestive that other local paracrine, otocrin, and mitogenic factors might play roles in regulating prostate enlargement. Given that BPH is a progressive chronic disorder, chronic inflammation might be implicated in the pathophysiology of prostate enlargement as well as dynamic and static components of LUTS.
Some studies [Citation5,Citation6] suggest that hypertriglyceridemia and lower high density lipoprotein (HDL) levels are associated with prostatic inflammation via IL-8 response indicating that these features might synergistically enhance inflammation and tissue remodeling in patients with BPH/LUTS. Rats fed high-cholesterol diets exhibit histologic changes in their prostates that resemble prostatic hyperplasia and exhibit significantly elevated prostate weights compared to controls [Citation7,Citation8]. Also, epidemiologic data link obesity and dyslipidemia with the rate of benign prostatic growth in humans [Citation9]. Therefore, it is plausible that the approach to the treatment of men with LUTS and BPH might involve simultaneous management of serum lipid levels.
Hypertriglyceridemia and low HDL level are the main individual components of MetS, a chronic systemic condition with chronic inflammation, and many studies demonstrate a positive correlation between MetS and BPH/LUTS [Citation10–14]. However, as individual components, the associations of either hypertriglyceridemia and/or lower HDL level with BPH/LUTS are under debate and literature is sparse in this regard. Furthermore, most studies examining the association of lipid levels with BPH/LUTS investigated the data of patients with metabolic disorders such as diabetes, MetS, obesity, etc. To the best of our knowledge, there is no previous study about the TG/HDL ratio and BPH/LUTS relationship. We aimed to investigate the association between TG/high density lipoprotein-cholesterol (HDL-C) ratio and BPH/LUTS in non-diabetic Turkish males who had the complaints of LUTS due to benign prostatic enlargement (BPE) in order to contribute to better elucidation of BPH pathogenesis in patients without diabetes mellitus.
Material and methods
Patient selection
Four hundred patients who were admitted to the Urology clinic between January and December 2014 with lower urinary tract symptoms (LUTS) due to BPH were enrolled in this cross-sectional study. Institutional review board approval was obtained before the start of the research. All participants signed an informed consent before being enrolled in the study.
Exclusion criteria
Patients with the suspicion of prostate cancer because of high PSA and abnormal digital rectal examination received an ultrasonography guided transrectal biopsy. If prostate cancer was detected they were excluded from the study. Patients with acute or chronic prostatitis, urethral stricture, neurogenic bladder, or previous lower urinary tract surgery were also excluded from the study. Since PSA levels would change, patients taking 5-α reductase inhibitors for BPH were also excluded from the study. Patients with a diagnosis of neuropsychiatric disease or use of medications that may affect the central nervous system or peripheral nervous system; diagnosis of stroke, coronary heart disease, myocardial infarction, malignancy, liver cirrhosis, and chronic renal failure were excluded. The participants with the diagnosis of diabetes were also excluded from the study.
Interventions
Detailed medical history and physical examination were performed for all patients. The weight and height of participants were measured and body mass index (BMI) was calculated as weight in kilograms divided by height in meters squared (kg/m2). Waist circumference (WC) was measured at the narrowest point and at the end of normal exhalation by using a flexible tape without compressing skin and with 0.1 mm precision.
Lower urinary tract symptoms were assessed using the International Prostate Symptom Score (IPSS). The questionnaire based on seven questions was completed during the interview. LUTS was appropriately stratified as none/mild (0–7), moderate (8–19), or severe (20–35) and uroflow test measuring the peak urinary flow rate was also performed to appreciate the complaints of the patients objectively. Digital rectal examination was performed to establish the approximate prostate volume (PV) and patients with suspicious findings were assessed for TRUS guided biopsy. Prostate volume was measured according to the prostate ellipsoid formula, multiplying the largest anteroposterior (height, H), transverse (width, W), and cephalocaudal (length, L) prostate diameters by 0.524 (H×W×L×π/6) using TRUS. Post void residual volume was measured for all patients by ultrasonography. Fasting blood sugar, triglyceride (TG), total cholesterol, HDL cholesterol, and PSA levels were measured from a morning time blood draw. LDL cholesterol was calculated by means of the formula of Friedewald and colleagues. We divided the study population into two groups: mild–moderate symptoms and severe symptoms. We also divided the participants into two groups according to PV: PV <40 ml and PV >40 ml. We compared the anthropometric characteristics (height, weight, and WC), age, BMI, biological parameters (LDL-C, total cholesterol level, TG, HDL-C, TG/HDL ratio, blood glucose level), and BPH/LUTS measurements (PV, IPSS, post void residual volume, Q max value, PSA level) between the two groups.
Statistical analysis
Sample size was estimated to detect a TG/HDL ratio difference of 0.50 between PV groups. The selection of a TG/HDL ratio difference of 0.50 was based on a pilot study conducted in 30 patients (none of the data from the pilot study were included in the analysis). The standard effect size was set at 0.38 with 80% effect (1–β) and 5% standard error (α) margin. According to this calculation, n = 111 cases for each group were found sufficient.
The participants were divided into two groups according to PV (PV greater than 40 ml or not). The patients were also divided into two groups according to symptom score (patients with mild or moderate symptoms and those with severe symptoms). The normality test was performed using the Kolmogorov–Smirnov test. The Mann–Whitney U test was performed comparing continuous variables between the two groups. Chi square test was performed for categorical variables. Univariate and multivariate logistic regression analyses were performed to identify the potential confounders affecting PV. The Hosmer and Lemeshow test was performed to determine the eligibility of logistic regression analysis. The Spearman correlation test was performed between PV and TG/HDL-C ratio. Receiver operating characteristic (ROC) curves were plotted with sensitivity (true-positive fraction) on the y-axis and 1-specificity (false-positive fraction) on the x-axis. ROC curve was plotted for TG/HDL value to predict PV.
All analyses were performed using SPSS ver. 20 (SPSS Inc., Chicago, IL). All demographic values were presented as means with standard deviations. All tests for statistical significance were two-tailed and p < .5 was deemed significant.
Results
A total of 400 participants were eligible based on exclusion/inclusion criteria. Among them, 186 (46.5%) had mild–moderate symptom score, while 214 (53.5%) had severe symptom score. Patients with severe symptoms have been found to have statistically higher BMI and FBS, but lipid profile measurements were not statistically different. Patients with severe symptoms have also larger PV (54.78 ± 27.52 and 42.91 ± 17.43, respectively, p = .0001). The patients, whose clinical and demographic features were stratified by symptom score are presented in .
Table 1. Clinical and demographic features of the patients stratified by symptom score.
Compared with the lower PV group, patients with larger PV were more likely to have higher age (67.26 ± 7.97 vs 62.14 ± 7.69; p = .0001), BMI (27.39 ± 3.67 vs 25.79 ± 3.46; p = .0001), FBS (91.13 ± 10.50 vs 87.09 ± 12.70; p = .0001), WC (99.88 ± 12.52 vs 95.13 ± 9.80; p = .0001), TG (116.66 ± 46.93 vs 101.49 ± 32.54; p = .0001), and TG/HDL (3.18 ± 1.38 vs 2.70 ± 1.16; p = .0001) ratio. summarizes the main characteristics of the patients stratified by PV.
Table 2. Clinical and demographic features of the patients stratified by prostate volume.
Univariate and multivariate logistic regression analyses were conducted to determine the potential confounders for PV. The Hosmer and Lomeshow test was performed and we found that the binary logistic regression model was eligible (p = .082). Although univariate analyses revealed that age, BMI, WC, FBS, TG, HDL-C level, and TG/HDL ratio were correlated with PV, only age [(1.125) OR (1.088–1.164), p = .00001], BMI [(1.119) OR (1.040–1.204), p = .003], TG [(1.043) OR (1.016–1.071), p = .002], HDL-C [(0.923) OR (0.860–0.990), p = .025], and TG/HDL [(1.224) OR (1.130–1.315), p = .014] were statistically significant in multivariate analysis. The details are demonstrated in .
Table 3. Univariate and multivariate analyses of the factors effective on prostate volume.
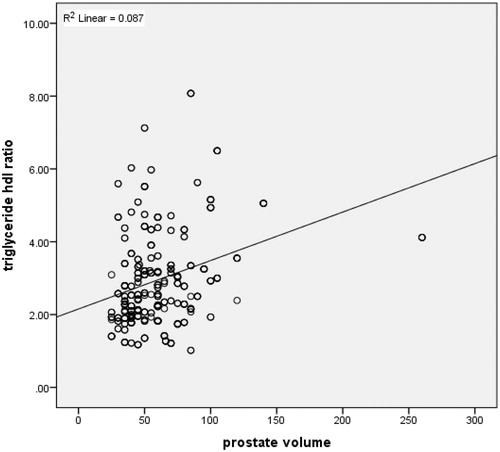
demonstrates the ROC curve for TG/HDL to predict PV. The calculated area under the curve (AUC) with confidence intervals (CI) for PV of 30 ml, 40 ml, and 50 ml were 0.668 (0.608–0.727), 0.617 (0.561–0.673), and 0.592 (0.530–0.654), respectively. A positive correlation was found between TG/HDL ratio and PV in the Spearman correlation test (r = 0.29, p = .00001). demonstrates the dot graph of this association.
Figure 1. ROC curves of serum TG/HDK ratios for prostate volume cut-off level of (A) 30 ml, (B) 40 ml, and (C) 50 ml.
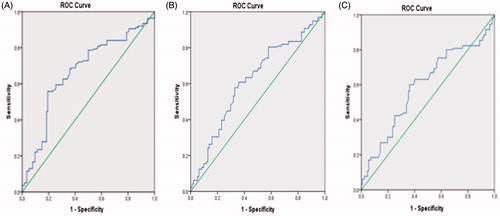
Figure 2. Correlation test between TG/HDL ratio and prostate volume.
Discussion
In this study, we evaluated the relationship between TG/HDL ratio and BPH/LUTS. We detected higher TG/HDL ratio in patients with larger PV, but no association was found with regard to symptom score classification. These results should be interpreted with caution and some important issues should be taken into account. The patients included in our study had no metabolic disorders such as diabetes or MetS and all participants were admitted with the complaints of LUTS. We divided patients according to symptom score classification and PV and no control group (participants with no BPH/LUTS) was available. This kind of sorting also enables us to evaluate the data in terms of LUTS severity. We may conclude from our data that higher TG/HDL ratios in patients with non-diabetic BPH are associated with larger PV, but not with elevated prostate symptom score.
We also evaluated the associations of other lipid measurements and cardiometabolic risk factors with BPH/LUTS. Age, WC, BMI, FBS, HDL-C, TG, and TG/HDL-C ratio were positively correlated with PV in univariate analysis, but among these parameters only age, BMI, TG, HDL-C, and TG/HDL-C ratio were statistically significant in multivariate analysis. There exists a strong multicollinearity among age, BMI, FBS, dyslipidemia, and BPH/LUTS and we adopted the step-wise technique to control this multicollinearity. We performed both forward:LR and backward:LR logistic regression analyses to establish the most prominent confounders among the possible factors. Our forward:LR multivariate logistic regression analysis revealed that age was the most prominent factor on PV. It is plausible to hypothesize from these results that as patients get older, the relationship between TG/HDL-C and PV might be stronger. However, stratification by age (40–49, 50–59, 60–69, >70) and evaluating the outcomes in age groups would enable us to find this relationship more precisely.
Among serum lipid measurements, only TG and HDL levels were correlated with prostate enlargement in our study. In a prospective, community-based cohort study [Citation15] elevated LDL cholesterol level was associated with increased risk of BPH, but this association was observed in diabetic men only, suggesting that dyslipidemia might contribute to prostate enlargement in conjunction with other metabolic abnormalities. Similarly, in a case-control study [Citation16] performed in Taiwan that enrolled 20,152 patients with BPE, dyslipidemia was significantly associated with BPH. Although we found no correlation between dyslipidemia and LUTS, some studies have contrary results. The Florey Adelaide Male Ageing Study [Citation17] on 1620 randomly selected men investigating the main social, lifestyle, and biomedical determinants of incident storage and voiding LUTS demonstrated that men with hypertriglyceridemia had decreased likelihood of storage LUTS improvement during the 5-year follow-up period, and greater abdominal fat mass was associated with storage LUTS progression. In the same study, lower HDL cholesterol levels were also associated with worsening of voiding LUTS. Many factors such as ethnicity and the differences of clinical and demographic data of these studies might be the possible causes of contrary results but it is obvious that further research is warranted on this complicated topic.
Many studies demonstrate that TG/HDL ratio is independently associated with various metabolic disorders such as obesity, type-2 diabetes mellitus, and coronary artery disease [Citation18–20]. MetS, which is a constellation of these metabolic disorders, has become an increasing problem world-wide and its definition has been expanded to include male hypogonadism, BPH-LUTS and erectile dysfunction. These conditions are not independent from each other. We should also interpret our results in light of these associations and evaluate the patients with LUTS systematically, rather than only focusing on the genitourinary system, including all risk factors that could facilitate the development of metabolic disorders.
We also demonstrated a positive relationship (via correlation test) between TG/HDL and PV. However, the correlation between these features was not very strong indicating that many other factors play major roles in prostate enlargement. The individualized approach is likely to be plausible as in the tumor biology field, since all persons have unique metabolisms.
We have identified the ROC curve for the TG/HDL ratio to PV and AUC was calculated. Although the result of this association was statistically significant, the AUC was not very large for all PV (30 ml, 40 ml, and 50 ml) and it was not plausible to provide different TG/HDL cutoff values. However, we may conclude from these curves that TG/HDL ratio is more indicative for PV of 30 ml compared to others (40 ml and 50 ml).
Our results might also have useful implications for lipid-lowering drug strategies in patients with BPH. While a randomized clinical trial of 319 patients showed no differences in IPSS, PV, urinary flow rate, or PSA among BPH patients treated for six months with atorvastatin compared to controls [Citation21], in a randomized-prospective study, Zhang et al. [Citation22] demonstrated that simvastatin and atorvastatin significantly reduced PV, improved LUTS, and slowed the clinical progression of BPH in patients with benign prostatic hyperplasia (BPH) accompanied by metabolic syndrome (MetS). A retrospective, population-based cohort study [Citation23] including 2447 men found that, across all age groups, those taking statins had a lower cumulative incidence of moderate–severe LUTS (HR 0.39, 95%CI 0.31–0.49), a decreased maximum flow rate (HR 0.53, 95%CI 0.34–0.82), and a lower cumulative incidence of BPE (HR 0.40, 95%CI 0.23–0.69) compared with those not taking statins. Additionally, this study demonstrated a protective association between statin use and each of the outcomes regardless of whether a metabolic condition (diabetes mellitus, hypertension, coronary heart disease, obesity, smoking) was present or not. Although our results are likely to support statin use in BPE, we may not propose that lipid lowering drugs might alleviate LUTS in non-diabetic patients and we are in need of further studies to reach a precise decision on this issue.
The average age of our data was 65 years old implying that male hypogonadism is another important topic for this population. Male hypogonadism which is defined as a clinical and biochemical syndrome associated with advancing age and characterized by symptoms and a deficiency in serum testosterone levels is also associated with clinically related features and comorbidities including obesity, MetS, diabetes mellitus, ED, and LUTS [Citation24]. Additionally, several studies demonstrated that androgen replasman therapy provided alleviation in LUTS as well as improvement in the features associated with hypogonadism including erectile dysfunction, obesity, and MetS parameters [Citation24–28]. Our data do not provide us reliable results on this topic, but we may have some inferences when taking into account some common metabolic pathways of erectile dysfunction and BPH/LUTS. Pelvic atherosclerosis, which is associated with increased BMI, hyperinsulinemia, aging and physical inactivity is likely to be an important pathway in dyslipidemic patients and all these features are common in aging hypogonadic men. These mechanisms should be researched in further well designed studies to elucidate the common pathways and interactions of diseases in clinical settings.
Several potential limitations to our study must also be considered when interpreting these results. Being a cross-sectional study, this study does not provide us with information regarding temporal associations between BPH/LUTS measures and TG/HDL ratio and longitudinal studies could perhaps help determine the temporal sequence of these and help our understanding of the causal links. Furthermore, our study lacks the analysis of insulin resistance and hypogonadism status of the participants, which could be related to dyslipidemia. Similar to these measures, we cannot rule out the possibility that other unmeasured characteristics might have confounded the association between dyslipidemia and reduced risk of BPE. Additionally, we did not assess IPSS as storage and voiding symptoms separately, thus we were not able to interpret the results in this regard. Finally, our study included only Turkish men and the results may not be generalizable to men of other races or ethnicities if the effects of the disease processes that lead to the development of LUTS and BPE differ among these groups.
Despite these limitations, we think our data provide some useful findings. In summary, these results suggest that higher TG/HDC ratio might be a risk factor for prostate enlargement among non-diabetic men. This observation is consistent with the concept that cardiac risk factors are involved with BPH pathogenesis, and raises the possibility that modulation of TG and HDL cholesterol may possibly delay the development of BPH. These results should be tested with well-designed longitudinal studies with larger cohorts and it is obvious that these studies will enhance our understanding regarding the implication of dyslipidemia in BPH/LUTS pathogenesis.
Conclusions
This study has demonstrated that TG/HDL ratio is associated with PV, but not with symptom score. Although several studies have shown that disturbances in lipid metabolism might be associated with BPH, ours is the first to report on the TG/HDL and BPH/LUTS association. Further well designed studies with larger sample size are warranted to better understand the implication of dyslipidemia in BPH/LUTS pathogenesis.
Ethical approval
All procedures performed in studies involving human participants were in accordance with the ethical standards of the institutional and/or national research committee and with the 1964 Helsinki declaration and its later amendments or comparable ethical standards. All applicable international, national, and/or institutional guidelines for the care and use of animals were followed.
Informed consent
Informed consent was obtained from all individual participants included in the study.
Acknowledgements
No research support or funding was received in connection with this study. The authors have no significant affiliation or involvement, either direct or indirect, with any organization or entity with a direct financial interest in the subject matter or materials discussed.
Disclosure statement
The authors report no conflicts of interest.
References
- Berry SJ, Coffey DS, Walsh PC, et al. The development of human benign prostatic hyperplasia with age. J Urol. 1984;132:474–479.
- Lee C, Kozlowski JM, Grayhack JT. Etiology of benign prostatic hyperplasia. Urol Clin N Am. 1995;22:237–246.
- Donnell RF. Benign prostate hyperplasia: a review of the year's progress from bench to clinic. Curr Opin Urol. 2011;21:22–26.
- Partin AW, Oesterling JE, Epstein JI, et al. Influence of age and endocrine factors on the volume of benign prostatic hyperplasia. J Urol. 1991;145:405–409.
- Vanella L, Russo GI, Cimino S, et al. Correlation between lipid profile and heme oxygenase system in patients with benign prostatic hyperplasia. Urology. 2014;83:7–13.
- Gacci M, Vignozzi L, Sebastianelli A, et al. Metabolic syndrome and lower urinary tract symptoms: the role of inflammation. Prostate Cancer Prostatic Dis. 2013;16:101–116.
- Ploumidou K, Kyroudi-Voulgari A, Perea D, et al. Effect of a hypercholesterolemic diet on serum lipid profile, plasma sex steroid levels, and prostate structure in rats. Urology. 2010;76:1–5.
- Vikram A, Jena GB, Ramarao P. Increased cell proliferation and contractility of prostate in insulin resistant rats: linking hyper-insulinemia with benign prostate hyperplasia. Prostate. 2010;70:79–89.
- Hammarsten J, Hogstedt B. Hyperinsulinaemia as a risk factor for developing benign prostatic hyperplasia. Eur Urol. 2001;39:151–158.
- Zou C, Gong D, Fang N, et al. Meta-analysis of metabolic syndrome and benign prostatic hyperplasia in Chinese patients. World J Urol. 2016;34:281–289.
- Pashootan P, Ploussard G, Cocaul A, et al. Association between metabolic syndrome and severity of lower urinary tract symptoms (LUTS): an observational study in a 4666 European men cohort. BJU Int. 2015;116:124–130.
- Russo GI, Castelli T, Urzì D, et al. Connections between lower urinary tract symptoms related to benign prostatic enlargement and metabolic syndrome with its components: a systematic review and meta-analysis. Aging Male. 2015;18:207–216.
- Demir O, Akgul K, Akar Z, et al. Association between severity of lower urinary tract symptoms, erectile dysfunction and metabolic syndrome. Aging Male. 2009;12:29–34.
- Yeh HC, Liu CC, Lee YC, et al. Associations of the lower urinary tract symptoms with the lifestyle, prostate volume, and metabolic syndrome in the elderly males. Aging Male. 2012;15:166–172.
- Parsons JK, Bergstrom J, Barrett-Connor E. Lipids, lipoproteins and the risk of benign prostatic hyperplasia in community-dwelling men. BJU Int. 2008;101:313–318.
- Chiu YL, Kao S, Lin HC, et al. Benign prostatic enlargement is not associated with diabetes: a population-based study. Andrology. 2015;3:933–936.
- Martin S, Lange K, Haren MT, et al. Risk factors for progression or improvement of lower urinary tract symptoms in a prospective cohort of men. J Urol. 2014;191:130–137.
- Eeg-Olofsson K, Gudbjörnsdottir S, Eliasson B, et al. The triglycerides-to-HDL-cholesterol ratio and cardiovascular disease risk in obese patients with type 2 diabetes: an observational study from the Swedish National Diabetes Register (NDR). Diabetes Res Clin Pract. 2014;106:136–144.
- Hadaegh F, Khalili D, Ghasemi A, et al. Triglyceride/HDL cholesterol ratio is an independent predictor for coronary heart disease in a population of Iranian men. Nutr Metab Cardiovasc Dis. 2009;19:401–408.
- Soška V, Jarkovský J, Ravčuková B, et al. The logarithm of the triglyceride/HDL-cholesterol ratio is related to the history of cardiovascular disease inpatients with familial hypercholesterolemia. Clin Biochem. 2012;45:96–100.
- Mills IW, Crossland A, Patel A, et al. Atorvastatin treatment for men with lower urinary tract symptoms and benign prostatic enlargement. Eur Urol. 2007;52:503–509.
- Zhang X, Zeng X, Dong L, et al. The effects of statins on benign prostatic hyperplasia in elderly patients with metabolic syndrome. World J Urol. 2015;33:2071–2077.
- St Sauver JL, Jacobsen SJ, Jacobson DJ, et al. Statin use and decreased risk of benign prostatic enlargement and lower urinary tract symptoms. BJU Int. 2011;107:443–450.
- Yassin A, Nettleship JE, Talib RA, et al. Effects of testosterone replacement therapy withdrawal and re-treatment in hypogonadal elderly men upon obesity, voiding function and prostate safety parameters. Aging Male. 2016;19:64–69.
- Meuleman EJ, Legros JJ, Bouloux PM, et al. Effects of long-term oral testosterone undecanoate therapy on urinary symptoms: data from a 1-year, placebo-controlled, dose-ranging trial in aging men with symptomatic hypogonadism. Aging Male. 2015;18:157–163.
- Yassin DJ, Doros G, Hammerer PG, et al. Long-term testosterone treatment in elderly men with hypogonadism and erectile dysfunction reduces obesity parameters and improves metabolic syndrome and health-related quality of life. J Sex Med. 2014;11:1567–1576.
- Karazindiyanoğlu S, Cayan S. The effect of testosterone therapy on lower urinary tract symptoms/bladder and sexual functions in men with symptomatic late-onset hypogonadism. Aging Male. 2008;11:146–149.
- Kalinchenko S, Vishnevskiy EL, Koval AN, et al. Beneficial effects of testosterone administration on symptoms of the lower urinary tract in men with late-onset hypogonadism: a pilot study. Aging Male. 2008;11:57–61.