
Abstract
Introduction: Prediabetes (PD) leads to reduced testosterone (T) in males, but the association between the anabolic hormones and bone mineral density (BMD) remains unknown.
Objectives: We investigated an association between the anabolic hormones and BMD in middle-aged and elderly men with PD.
Methods: We investigated 84 prediabetic and 56 control men. Total T (TT), calculated free T (cFT), and dehydroepiandrosterone sulfate (DHEAS) were measured, and BMD was assessed using DXA methods.
Results: Patients with PD had lower TT (p < .001), cFT (p < .005), and DHEAS (p < .02) than control group. BMD values of the lower lumbar spine (p < .02) and total body (p < .05) in prediabetic men were lower than in control group. Lumbar spine BMD correlated with TT (r = 0.376), cFT (r = 0.235), and HbA1c (r = −0.368); femoral neck BMD correlated with TT (r = 0.412) and cFT (r = 0.421). The high lumbar spine and femur neck BMD was associated with high TT, cFT, and low HbA1c, while the high total body BMD with high TT, cFT, and low HbA1c.
Conclusion: The anabolic hormones significantly affect BMD in male with PD, and screening for low BMD is necessary in these patients.
Introduction
Low bone mineral density (BMD) is one of the main factors affecting the risk of osteoporosis and a propensity to bone fracture. With the increasing male age, the incidence of osteoporosis and prevalence of osteoporotic fractures is similar to the respective rates in females. Approximately 4–6% of the men older than 50 years have osteoporosis. However, men have greater bone mass than women and suffer from osteoporotic fractures roughly 10 years later. Although osteoporosis is often asymptomatic until a fracture occurs, the disease have a negative impact on patient's lifestyle and causes morbidity and mortality [Citation1,2].
A multitude of factors determine BMD levels: genetic, nutritional, hormonal, vitamin D, physical activity, and comorbidities. Hence, identifying the factors related to lower BMD in men is critical to its prevention and management. Anabolic hormones from the androgenic group, such as testosterone (T) or dehydroepiandrosterone sulfate (DHEAS), and anabolic hormone, like insulin-like growth factor 1 (IGF-1), are pivotal for the acquisition and the maintenance of bone mass in men, and the low levels of anabolic hormones are associated with reduced BMD [Citation3]. However, it is not yet precisely clear what role anabolic hormones play in the maintenance of bone mass in men with glucose metabolism disorders.
Type 2 diabetes mellitus (T2DM) is also highly prevalent in aging men, and the demographic trends with longer life expectancy and a lifestyle characterized by low physical activity and high-energy food intake contribute to the increasing incidence of T2DM and osteoporosis [Citation4]. Some studies have reported the effects of T2DM on bone metabolism in men [Citation5,6]. However, the mechanism of this influence is still unclear. Insulin may exert synergistic effects together with anabolic hormones [Citation7]. Therefore, BMD may be altered not only in diabetic men but also in men with prediabetes (PD). PD is a condition in which the patients have blood glucose concentrations that are slightly increased above the normal levels, but they are still not diabetic. The diagnostic criteria of PD according to the American Diabetes Association (ADA) are as follows: impaired fasting glucose (IFG), impaired glucose tolerance (IGT), and/or glycated hemoglobin (HbA1c) levels from 5.7 to 6.4% [Citation8]. The prevalence of PD in Poland is highest in the world, and ∼16% of the population is estimated to have IGT. By the year 2035, the number of patients with IGT is projected to increase to about 19% [Citation9]. The PD status is considered as a risk factor for the further development of T2DM and cardiovascular disease (CVD) [Citation10].
In recent years, several studies have reported a relationship between the reduction in circulating concentrations of T and bone loss in elderly men [Citation11,12]. Furthermore, it was demonstrated that androgens are independent determinants of BMD in men with T2D [Citation13]. In our previous investigation, we described the high prevalence of low T levels among a population of Polish men with PD [Citation14], but the impact of this phenomenon on BMD is unknown. So far, only one publication has concerned the relationships between PD and BMD in men, indicating that there was no significant difference between BMD of healthy and prediabetic men [Citation15]. However, the authors did not evaluate the relationships between BMD and anabolic hormones. Moreover, BMD was measured using ultrasound but not dual-energy X-ray absorptiometry (DXA). Therefore, the current study examined the relationships between the concentrations of anabolic hormones (T, DHEAS, and IGF-1) and BMD in middle-aged and elderly men with PD.
Material and methods
Study population
This study was performed in male patients attending the outpatient clinic for glucose metabolism disorders in the Department of Internal Diseases, Diabetology, and Endocrinology, Medical University of Warsaw, Poland. The inclusion criteria were as follows: (1) PD and (2) age 40–80 years. The exclusion criteria were as follows: (1) diabetes mellitus type 1 or 2; (2) hypercortisolism, thyroid function disturbances; (3) recent or current T replacement, androgen deprivation therapy, or any hormonal treatment, either during the study or in history; (4) recent or current treatment, which may affect bone mineral density, e.g. calcium supplements, vitamin D, heparin, vitamin K antagonists or corticosteroids, as well as impaired renal function; (5) a history of alcohol abuse or a family history of osteoporosis; and (6) lack of informed written consent.
We recruited 196 consecutive patients with PD (aged from 40 to 80 years), and as a control group, 184 men matched by age and with a fasting plasma glucose (FPG) level less than 5.55 mmol/L (100 mg/dL) and HbA1c concentration lower than 5.7%. During the final stage of the investigation, we qualified patients who underwent BMD measurements (84 patients with PD and 58 males as a control group). Fourteen patients had a history of previous bone fracture. In eleven cases, the fractures were posttraumatic (hand and spine), and three patients had a low-energy fracture of the thoracic spine. This study was approved by the Local Research Ethics Committee and was conducted in accordance with the Declaration of Helsinki; and informed consent was obtained from all participants.
PD was diagnosed in patients with IFG from 100 to 125 mg/dL (5.6–6.9 mmol/L) and a two-hour glucose concentration in oral glucose tolerance test (OGTT) <140 mg/dL (<7.8 mmol/L). Patients were also considered to be in PD status when their IGT – two-hour glucose concentration in OGTT – ranged from 140 to 200 mg/dL (7.8–11.0 mmol/L) as well as those with HbA1c levels from 5.7% to 6.4% [Citation8]. Because PD is a transitory state, the repeated testing in many individuals may indicate a normal range of blood glucose levels, FPG and OGTT measurements were repeated after 2–3 weeks and the results were reevaluated. The diagnosis of MetS was based on the following criteria: waist circumference (WC) ≥ 94 cm and any two of the following: triglycerides ≥ 150 mg/dL, HDL cholesterol < 40 mg/dL, blood pressure ≥ 130/85 mmHg, and FPG ≥ 100 mg/dL [Citation16]. Height, weight, and waist circumferences were measured, and the body mass index (BMI) was calculated. Obesity was defined as a body mass index (BMI) of 30 or more. Cardiovascular disease (CVD) was defined as the presence of any of the following: coronary artery disease, congestive heart failure, or arrhythmia.
Bone mineral density measurement
Bone mineral density (BMD) at the lumbar spine (L2–L4), femoral neck, and of the total body was measured by dual-energy X-ray absorptiometry (DXA) scanner (Lunar Prodigy, GE Medical Systems, Madison, WI). The neck of the femur contains more cortical bone, while in the vertebral column the trabecular bone is predominant. Both types of bone tissue react differently to the effects of anabolic hormones. T-scores (the number of SDs above or below the young adult mean BMD) and Z-scores (age-adjusted BMD) were calculated with reference to a local normative population BMD database. The in vivo precision (CV – coefficient of variation) of the BMD measurements was 1.48% for the lumbar spine, 2.68% for femoral neck, and 0.76% for the total body. Least significant changes (LSCs) were calculated using the advanced calculator on the www.pfo.pl recommended by the Polish Foundation of Osteoporosis according to the following formula: LSC = 2.77 × RMS SD (root mean square standard deviation), which represented a statistical difference at the 95% confidence level. Measurement results were presented as either absolute density (g/cm2) or T-score values. All scans were obtained and analyzed by the same physician. DXA equipment was calibrated each day with a standardized phantom and serviced regularly.
Laboratory measurements
Venous blood samples from all patients with PD were obtained between 8.00 and 10.00 a.m. about 12–14 h after the last meal. After centrifugation, the serum was collected and kept frozen at −70 °C until further analysis. FPG was measured by an enzymatic method using BIOSEN 5040 analyzer (EKF-Diagnostic GmbH, Magdeburg, Germany), glycated hemoglobin (HbA1c) by HPLC via a variant analyzer (Bio-Rad Laboratories Inc., Hercules, CA). HbA1c values were expressed in percentage in accordance with the National Glycohemoglobin Standardization Program (NGSP). The serum levels of TT, DHEAS, estradiol (E2), and IGF-1 were measured through immunometric assays (Immulite 2000 and RIA CAC; Siemens Medical Solution, Malvern, PA). The data are expressed in nmol/L for TT, pg/mL for E2, and ng/mL for DHEAS and IGF-1 (to convert the values for DHEAS to μmol/L, multiplication by 0.00271 was carried out; for conversion of IGF-1 values to nmol/L, multiplication by 0.131 was carried out, and for E2 values to pmol/L, multiplication by 3.671 was carried out). To estimate the circulating fraction of FT, we measured the serum level of sex hormone-binding globulin (SHBG) using an immunoassay (Diagnostic Products Corp, San Francisco, CA), and SHBG was expressed in nmol/L. The serum level of calculated FT (cFT) was expressed in nmol/L and was calculated by the validated equation of Vermeulen et al. [Citation17]. Serum intact parathormone (PTH) was analyzed using an IRMA kit (BioSource, Nivelles, Belgium) and 25-hydroxyvitamin D (25-OH D3). Plasma concentrations were measured by an IRMA kit (BioSource, Nivelles, Belgium). The levels of serum and urinary solutes (calcium and inorganic phosphorus), and alkaline phosphatase (ALP) were determined via standard laboratory methods.
Statistical analysis
Statistical analyses were performed using the STATISTICA 9.1 data analysis software system (StatSoft, Tulsa, OK). Most continuous variables had a normal distribution and were expressed as mean ±standard deviation. The intergroup differences were tested using the t-test for unpaired samples. Serum DHEAS values had a skewed distribution; thus, they were log-transformed to normalize their distribution, expressed as a median with lower and upper quartiles, and the intergroup differences were tested using the t-test for unpaired samples for normalized values. Categorized variables were expressed as a number and a percentage, and the intergroup differences were evaluated using the χ2 test. The relationships between BMD and various factors including age, BMI, and HbA1c in men with PD were examined by Pearson’s correlation analysis. All relationships were assessed by linear univariate and multivariate regression analysis to evaluate the associations between BMD and other parameters. In multivariate analysis, statistical data were adjusted for age and BMI. During the construction of multivariable models, we included all variables that had been shown to be significant determinants (p < .05) in the univariate analysis. A p-value less than .05 was considered statistically significant.
Results
A total of 84 patients with PD (mean age 66.5 ± 3.8 years) and 58 control men (mean age 65.7 ± 3.8 years) were enrolled in this study. The characteristics of both groups are shown in . Patients with PD had lower TT (p < .001), cFT (p < .005), and DHEAS levels (p < .02) and higher E2 (p < .05) and SHBG levels (p < .02), when compared with the values of the respective parameters of the control group, whereas IGF-1 concentrations did not differ between groups. LH levels were significantly higher in the patients with PD (p < .05), but FSH levels were similar in both groups. Patients with PD had statistically higher HbA1c, FPG, and glucose levels in two-hour OGTT than those of the patients in the control group. In addition, total cholesterol, LDL cholesterol, and triglyceride levels were significantly higher in patients with PD (). As seen in , obesity, MetS, and CVD were more common in the men with PD than in those in the control group.
Table 1. Characteristics of patients with PD and control group.
We observed statistically significant differences of the prevalence of low T levels between the groups. Low TT levels (<12 nmol/L) were established in 33 men (39%) with PD and in 15 men (25.8%) in the control group (p < .05). Low cFT levels (<0.250 nmol/L) were found in 35 (41.6%) patients with PD and in 18 (31%) men in the control group (p < .01).
The values of biochemical parameters associated with bone metabolism are also presented in . We observed slightly lower serum calcium concentrations and lower 24-h urine calcium excretion in men with PD as compared to the control group, but the differences were not significant. No statistically significant differences were found in phosphatemia levels. 25-OH vitamin D serum concentrations were slightly lower in men with PD, while the mean PTH level was higher in the patients with PD, but both the differences between groups were not significant. The serum concentrations of ALP were also similar in both groups.
Analysis of BMD revealed, that patients with PD had statistically significant lower lumbar spine (p < .02) and total body (p < .05) BMD than the patients in the control group, but femoral neck BMD did not differ between the groups. Among prediabetic patients, 14 men (17%) had lumbar spine or femoral neck T-score below −2.5 SD, while among the men in the control, lumbar spine or femoral neck T-score below −2.5 SD was observed in 6 men (10.3%).
Pearson’s correlation analysis evidenced that lumbar spine BMD was significantly correlated with TT (r = 0.376, p = .023), cFT (r = 0.235, p = .038), and HbA1c (r = −0.368, p = .045). Femoral neck BMD was significantly correlated with TT (r = 0.412, p = .01) and cFT (r = 0.421, p < .001), whereas the total body BMD significantly correlated with TT (r = 0.382, p = .014), cFT (r = 0.327, p = .028), and SHBG (r = −0.329, p = .023) (). In multivariate analysis, these relationships were significant after the adjustment for age and BMI.
Table 2. Univariate correlation between BMD and other variables in patients with PD.
In the multivariable logistic regression models adjusted for confounding factors, the higher lumbar spine BMD was independently associated with high TT (p < .05), high cFT (p < .01), and low HbA1c (p < .05), whereas the higher femur neck BMD was correlated with high TT (p < .01), high cFT (p < .05), and low HbA1c (p < .01). The higher total body BMD was independently associated with high TT (p < .01), high cFT (p < .05), high IGF-1 (p < .05), low SHBG (p < .05), and low HbA1c (p < .05) ().
Table 3. Univariable and multivariable linear regression analysis for putative predictors of BMD in patients with PD.
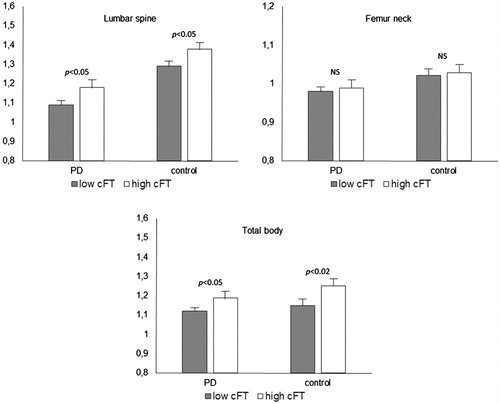
After the division into the two groups according to the cFT levels (below and under 0.250 nmol/L), we discovered that the values of the mean total body BMD and lumbar spine BMD were significantly higher than those of the control group (both p < .02), but did not differ significantly for femur neck BMD ().
Figure 1. BMD in patients with PD after dividing according to cFT levels: low cFT: <0.250 nmol/l, high cFT: > 0.250 nmol/l.
Discussion
In this study, we investigated the relationships between anabolic hormones and BMD in men with PD, aged from 40 to 80 years, and in healthy men. We presume that there are two major findings arising from the present study. Firstly, the patients with PD had significantly lower lumbar spine and total body BMD than the men in the control group, but femoral neck BMD did not differ between groups. Among the patients with PD, 17% had lumbar spine or femur neck T-score below −2.5 SD in comparison with 10.3% in control group. Secondly, we established that femur neck and total body BMD correlated positively with TT and cFT, while lumbar spine BMD correlated positively with TT and cFT, and correlated negatively with HbA1c. These correlations were independent from BMI and age. In multivariable logistic regression models, we observed that the higher lumbar spine and femur neck BMD were independently associated with high TT and cFT, and with low HbA1c, while the higher total body BMD was also correlated with high TT, cFT, and IGF-1 as well as with low SHBG and HbA1c. These relationships were independent from confounding factors. These results indicate that anabolic hormones, especially TT and cFT, have a significant impact on BMD in patients with PD. However, the prediabetic status per se is probably also independently and significantly associated with lower BMD in men with PD, because in our cohort, we observed a significant negative and independent relationship between HbA1c and BMD.
Considering the fact that the prevalence of PD in Poland is highest in the world, any consequences of PD are a serious public health problem. We have shown previously that low T was detected in 30% of prediabetic male patients and was associated with clinical signs and symptoms of hypogonadism, erectile dysfunctions, lower urinary tract symptoms, depression, and a significant deterioration in the quality of life [Citation18,19]. The present observations also draw attention to the negative impact of low levels of anabolic hormones on BMD in men with PD.
Several studies have reported a relationship between anabolic hormones and BMD in men. However, it is not yet precisely clear what role androgens play in the maintenance of bone mass in men. Androgenic hormones may directly influence bone metabolism through the inhibition of osteoclastogenesis and the effect of PTH on osteoblasts, as well as by the decrease in the synthesis of IL-6 by osteoblasts [Citation11,Citation20]. These processes lead to inhibition of bone resorption and stimulation of bone mineralization. On the other hand, androgens may also stimulate bone formation after aromatization to estrogen by the enzyme aromatase, which is present in the bone tissue. Estrogens increase osteoblast differentiation and suppress bone resorption; therefore, they play an important role in maintaining a balance between formation and resorption of bones. Estrogens also stimulate periosteal bone expansion (periosteal apposition) and, in this way, reduce the risk of bone fracture [Citation12]. These mechanisms may in part explain our finding that patients with PD have lower BMD that is associated independently with low androgen levels. Previous studies have also shown that estrogens levels are correlated with BMD in men [Citation21], although in our study we did not observe a correlation between BMD and estradiol levels. Furthermore, the results of the univariate correlation analysis revealed that BMD in all regions was not significantly correlated with total estradiol concentration (r = −0.12, p = .34 for lumbar spine; r = −0.23, p = .08; r = −19, p = .65 for total body). However, we measured total serum estradiol concentrations, which may only in part reflect local bone concentrations, because aromatization of T to estradiol occurs in bone tissues.
Aging is accompanied by a progressive moderate decrease in mean serum concentration of T [Citation22]. A marked age-related increase of serum SHBG level is also found, which results in a decrease in the non-SHBG-bound fractions of T available for biological action, decreased cFT and bioavailable T, as well as a moderate decrease of free and bioavailable estradiol [Citation23]. It was also established that SHBG levels correlated negatively with BMD in middle-aged and aging men [Citation24], because SHBG levels slightly increased with age. However, in our investigation, we observed a negative univariate correlation between SHBG and total body BMD (r = −0.329, p < .05), but there was no significant association between BMD and SHBG, as indicated by multivariate linear regression analysis adjusted for confounding factors.
In previous examinations, it was speculated that low BMD in patients with glucose metabolism disorders, e.g. in prediabetic or diabetic patients, may be associated with long-term poor glycemic control [Citation25]. We discovered that lumbar spine BMD not only correlated positively with TT and cFT, but also negatively with HbA1c. Nevertheless, BMD of femur neck and total body did not correlate with HbA1c. In multivariable logistic regression models, we observed that the high BMD in all three regions was independently associated with low HbA1c, and these relationships were independent from the confounding factors. It seems that our results confirm the hypothesis that even a relatively small glucose metabolism disorder may have a negative impact on BMD in men.
Because there are no studies in men with PD, knowledge concerning the relationships between anabolic hormones and BMD is partially based on studies conducted in diabetic men. Several hypotheses have been proposed to explain the altered BMD in patients with T2DM. The first is that the effect of T2DM on bone through insulin acts as a bone anabolic factor. Insulin has both direct and indirect influence on BMD. For example, rats lacking insulin receptors had impaired bone formation and low bone turnover [Citation26]. In addition, a high level of expression of insulin receptors on osteoblasts was reported, and insulin binding to these receptors led to cell proliferation, collagen synthesis, and glucose uptake [Citation27]. The effect of insulin seems not to be limited only to osteoblasts, because earlier in vitro investigations showed that osteoclasts also have insulin receptors where insulin can act to inhibit their action [Citation28]. In T2DM and in prediabetic men, there is an insulin resistance and hyperinsulinemia. In addition to the direct effect of insulin on osteoblasts and osteoclasts, insulin can indirectly influence BMD by decreasing SHBG [Citation29], thus leading to higher levels of TT and cFT, increasing the sensitivity of osteoblasts to IGF-1, which may modulate the actions of PTH on bone leading to a synergistic effect between insulin and PTH [Citation30]. Since insulin resistance is selective and only restricted to the effect of insulin on glucose transport, the high insulin levels can still act on osteoblasts to increase BMD, but these mechanisms are insufficient when insulin resistance expands to tissues that are not involved in glucose transport such as bone tissues.
In our study, we found not only low BMD in prediabetic patients but also negative correlations between androgen concentrations and BMD, as well as significantly lower TT and cFT in men with PD when compared with the control group. The possible pathophysiological mechanism for the association between PD and low T is probably multifactorial and represented mainly by visceral adiposity and insulin resistance. Low T levels in men are associated with insulin resistance and reduced insulin sensitivity [Citation31] and have been found to predict insulin resistance, obesity, and T2DM [Citation32]. Importantly, in our cohort, ∼15% of the men had a TT of <8 nmol/L, a threshold level that characterizes men with severe hypogonadism, the cases in which T replacement therapy is required [Citation33], but a reduction in TT levels below 12 nmol/L was observed in about 25% of the patients. Whether this moderate reduction in T has implications for the general health remains debated. Evidence derived from clinical studies supports the use of T replacement in hypogonadal patients, although the benefit–risk ratio is uncertain in advanced age. In an elderly population without serious glucose metabolism disorders, the effects of T replacement therapy on BMD have been inconsistent, with the most convincing effects being observed in men with exceedingly low serum T levels [Citation34,35]. Replacement therapy in diabetic men with low T may improve insulin sensitivity, glycemic control, and diabetic complications [Citation36,37], but the long-term influence of T in men with hypogonadism and PD is still unknown.
It should be noted that in our study, PD was diagnosed also in patients with HbA1c (from 5.7 to 6.4%) [Citation2]. Currently, an intermediate HbA1c range is not considered as an indicator of PD according to the World Health Organization. However, ADA definition probably covers a wider range of subjects as a risk group of T2DM development; while an HbA1c value of 5.7–6.4% detects, in part, different individuals with intermediate hyperglycemia compared with IFG and IGT [Citation38]. Some issues can be mentioned as weaknesses of our dataset. The hormone measurements were not repeated in our sample set, and we measured TT, cFT, and total estradiol, but not bioavailable anabolic hormones. Moreover, we did not evaluate markers of bone formation, physical activity, or alcohol consumption. It is also important to note that we focused only on associations between BMD and anabolic hormones in men with PD. Our model in no way established a causal link between hormone levels and PD and between hormone levels and BMD.
In conclusion, we have shown that anabolic hormones significantly and independently affect BMD in male patients with PD, and a screening for low BMD and low androgens is necessary in these patients.
Disclosure statement
No potential conflict of interest was reported by the authors.
References
- Jiang HX, Majumdar SR, Dick DA, et al. Development and initial validation of a risk score for predicting in-hospital and 1-year mortality in patients with hip fractures. J Bone Miner Res. 2005;20:494–500.
- Khosla S, Amin S, Orwoll E. Osteoporosis in men. Endocr Rev. 2006;29:441–464.
- Finkelstein JS, Klibanski A, Neer RM. A longitudinal evaluation of bone mineral density in adult men with histories of delayed puberty. J Clin Endocrinol Metab. 1996;81:1152–1155.
- Lipscombe LL, Jamal SA, Booth GL, et al. The risk of hip fractures in older individuals with diabetes: a population-based study. Diabetes Care. 2007;30:835–841.
- Ahmed LA, Joakimsen RM, Berntsen GK, et al. Diabetes mellitus and the risk of nonvertebral fractures: the Tromsø study. Osteoporos Int. 2006;17:495–500.
- Lunt M, Masaryk P, Scheidt-Nave C. The effects of lifestyle, dietary dairy intake and diabetes on bone density and vertebral deformity prevalence: the EVOS study. Osteoporos Int. 2001;12:688–698.
- Thrailkill KM, Lumpkin CK, Jr, Bunn RC, et al. Is insulin an anabolic agent in bone? Dissecting the diabetic bone for clues. Am J Physiol Endocrinol Metab. 2005;289:E735–E745.
- American Diabetes Association. Diagnosis and classification of diabetes mellitus. Diabetes Care. 2014;37:S81–S90.
- Cho NH, Whiting D, Guariguata L. IDF. Diabetes Atlas. 6th ed. International Diabetes Federation; 2013; p. 39–49.
- Rhee SY, Woo JT. The prediabetic period: review of clinical aspects. Diabetes Metab J. 2011;35:107–116.
- Rochira V, Balestrieri A, Madeo A, et al. Osteoporosis and male age-related hypogonadism: role of sex steroids on bone (patho)physiology. Eur J Endocrinol. 2006;154:175–185.
- Vanderschueren D, Vandenput L, Boonen S, et al. Androgens and bone. Endocr Rev. 2004;25:389–425.
- Vasilkova O, Mokhort T, Sanec I, et al. Testosterone is an independent determinant of bone mineral density in men with type 2 diabetes mellitus. Clin Chem Lab Med. 2011;49:99–103.
- Rabijewski M, Papierska L, Piątkiewicz P. Late-onset hypogonadism among old and middle-aged males with prediabetes in Polish population. Aging Male. 2015;8:16–21.
- Lee JH, Lee YH, Jung KH, et al. Bone mineral density in prediabetic men. Korean Diabetes J. 2010;34:294–302.
- Athyros GV, Ganotakis ES, Elisaf M, et al. The prevalence of the metabolic syndrome using the National Cholesterol Educational Program and International Diabetes Federation definitions. Curr Med Res Opin. 2005;21:1157–1164.
- Vermeulen A, Verdonck L, Kaufman JM. A critical evaluation of simple methods for the estimation of free testosterone in serum. J Clin Endocrinol Metab. 1999;84:3666–3672.
- Rabijewski M, Papierska L, Kuczerowski R, et al. Hormonal determinants of the severity of andropausal and depressive symptoms in middle-aged and elderly men with prediabetes. Clin Interv Aging. 2015;10:1381–1391.
- Rabijewski M, Papierska L, Kuczerowski R, et al. Hormonal determinants of erectile dysfunction and lower urinary tract symptoms in middle-aged and elderly men with prediabetes. Aging Male. 2015;18:256–264.
- Bellido T, Jilka RL, Boyce BF, et al. Regulation of interleukin-6, osteoclastogenesis, and bone mass by androgens. The role of the androgen receptor. J Clin Invest. 1995;95:2886–2895.
- Szulc P, Munoz F, Claustrat B, et al. Bioavailable estradiol may be an important determinant of osteoporosis in men: the MINOS study. J Clin Endocrinol Metab. 2001;86:192–199.
- Araujo AB, O’Donnell AB, Brambilla DJ, et al. Prevalence and incidence of androgen deficiency in middle-aged and older man: estimates from the Massachusetts Male Aging Study. J Clin Endocrinol Metab. 2004;89:5925–5926.
- Amin S, Zhang Y, Sawin CT, et al. Association of hypogonadism and estradiol levels with bone mineral density in elderly men from the Framingham study. Ann Intern Med. 2000;133:951–963.
- Bjornerem A, Emaus N, Berntsen GK, et al. Circulating sex steroids, sex hormone-binding globulin, and longitudinal changes in forearm bone mineral density in postmenopausal women and men: the Tromso study. Calcif Tissue Int. 2007;81:65–72.
- Kayath MJ, Dib SA, Vieira JG. Prevalence and magnitude of osteopenia associated with insulin-dependent diabetes mellitus. J Diabetes Complications. 1994;97: 97–104.
- Ogata N, Chikazu D, Kubota N. Insulin receptor substrate-1 in osteoblast is indispensable for maintaining bone turnover. J Clin Invest. 2000;105:935–943.
- Fulzele K, Riddle RC, Cao X. Insulin receptor signaling in osteoblasts regulates postnatal bone acquisition and body composition. Cell. 2010;142:309–319.
- Thomas DM, Udagawa N, Hards DK. Insulin receptor expression in primary and cultured osteoclast-like cells. Bone. 1998;23:181–186.
- Birkeland KI, Hanssen KF, Torjesen PA, et al. Level of sex hormone-binding globulin is positively correlated with insulin sensitivity in men with type 2 diabetes. J Clin Endocrinol Metab. 1993;76:275–278.
- Conover CA, Lee PDK, Riggs BL, et al. Insulin-like growth factor-binding protein-1 expression in cultured human bone cells: regulation by insulin and glucocorticoid. Endocrinology. 1996;137:3295–3301.
- Grossmann M, Thomas MC, Panagiotopoulos S, et al. Low testosterone levels are common and associated with insulin resistance in men with diabetes. J Clin Endocrinol Metab. 2008;93:1834–1840.
- Selvin E, Feinleib M, Zhang L, et al. Androgens and diabetes in men: results from the Third National Health and Nutrition Examination Survey (NHANES III). Diabetes Care. 2007;30:234–238.
- Lunenfeld B, Mskhalaya G, Zitzmann M, et al. Recommendations on the diagnosis, treatment and monitoring of hypogonadism in men. Aging Male. 2015;18:5–15.
- Katznelson L, Finkelstein J, Schoenfeld D et al. Increase in bone density and lean body mass during testosterone administration in men with acquired hypogonadism. J Clin Endocrinol Metab. 1996;81: 4358–4365.
- Wang C, Swerdloff RS, Iranmanes A, et al. Effects of transdermal testosterone gel on bone turnover markers and bone mineral density in hypogonadal men. Clin Endocrinol (Oxf). 2001;54:739–750.
- Jones TH, Arver S, Behre HM, et al. Testosterone replacement in hypogonadal men with type 2 diabetes and/or metabolic syndrome (the TIMES2 study). Diabetes Care. 2011;34:828–837.
- Haider A, Yassin A, Doros G, et al. Effects of long-term testosterone therapy on patients with “diabesity”: results of observational studies of pooled analyses in obese hypogonadal men with type 2 diabetes. Int J Endocrinol. 2014:683515.
- Saukkonen T, Cederberg H, Jokelainen J, et al. Limited overlap between intermediate hyperglycemia as defined by A1C 5.7–6.4%, impaired fasting glucose, and impaired glucose tolerance. Diabetes Care. 2011;34:2314–2316.