
Abstract
Aim: The aim of this work is to compare the effects of osteoprotegerin (OPG) and testosterone on bone quality in a model of orchidectomised (ORX) rats.
Methods: Three-month-old ORX or SHAM operated groups (n = 15 each group) were used. The SHAM and ORX groups received saline. There were two ORX groups, receiving OPG–Fc (10 mg/kg twice weekly) (ORX + OPG–Fc) or testosterone cypionate (1.7 mg/kg/weekly) for 8 weeks. After sacrifice, bone analysis by femoral and lumbar dual-energy X-ray absorptiometry and micro-computed tomography in femora were performed. Histological sections of vertebrae were dyed with hematoxylin–eosin or safranin. Serum osteocalcin (BGP), total alkaline phosphatase (ALP), and C-terminal telopeptide of type I collagen (CTX) were analyzed.
Results: ORX resulted in femoral and vertebral bone loss and in microarchitectural deterioration. Treatment with OPG–Fc and testosterone recovered lumbar (L) and femoral (F) bone mineral densitometry bone mineral density (BMD) to SHAM levels. Femoral BMD was significantly higher after treatment with OPG–Fc than after testosterone treatment due to the presence of osteopetrotic changes in the metaphyseal region of long bones. Serum levels of ALP and CTX increased, while OPG levels were unchanged in ORX rats. Treatment with OPG–Fc decreased the levels of BGP, ALP, and CTX. Treatment with testosterone maintained biochemical markers of bone turnover at levels similar to or higher than those of ORX rats.
Introduction
Osteoblasts regulate the differentiation and activity of osteoclasts through the RANK/RANKL/OPG system. RANKL, or receptor activator of nuclear factor-кβ, is a potent resorptive agent synthesized by osteoblasts and immune cell lines. It is expressed as a membrane protein and as a free secreted protein [Citation1]. It was discovered by four independent groups of researches [Citation2–5]. The RANKL joins to RANK receptor, placed in the osteoclast surface, promotes proliferation, differentiation survival, and fusion of precursor cells of osteoclast to activate them to mature osteoclasts, and inhibits their apoptosis [Citation2,Citation6,Citation7]. Osteoblasts also synthesize osteoprotegerin (OPG), a decoy receptor of RANK that blocks the effects of RANKL, negatively modulating the activation and development of osteoclasts [Citation8]. In vivo studies have identified interference with RANKL/RANK interaction as a potential therapeutic target in the management of osteoporosis. To date, two agents capable of blocking the binding of RANKL to RANK have been tested in clinical studies, namely OPG (Fc–OPG fusion molecule) and the RANKL antibody denosumab. Both have been found to have profound inhibitory effects on bone resorption [Citation9]. To facilitate the use of OPG in animal models, the Fc portion of the immunoglobulin heavy chain was fused to the amino-terminus of OPG (Fc–OPG) [Citation10]. As denosumab is a human RANKL antibody, it cannot be used in animal models.
The androgens testosterone and dihydrotestosterone (DHT) modulate bone cell activity and are important for the acquisition and maintenance of bone mass. In patients with prostate cancer, androgen deprivation therapy (ADT) increases biochemical indices of bone resorption and bone formation [Citation11] and has been associated with a twofold greater incidence of osteoporosis and a 50% increase in fracture incidence [Citation12]. Another common cause of male osteoporosis is hypogonadism, a condition associated with bone loss, the deterioration of trabecular architecture, and increased fracture risk [Citation13]. Many of the deleterious skeletal changes observed in men with androgen deficiency can be recapitulated by castration (orchidectomy; ORX) in rats [Citation14–16]. While the molecular basis of the ORX-related increase of bone resorption is unclear, previous studies have suggested the possible involvement of the OPG/RANKL axis [Citation17].
Fc–OPG and testosterone act on bone quality through the OPG/RANKL system, and both are capable of restoring bone quality in orchidectomized rats, but no research published to date has compared the effects of both compounds on a model of castrated rats. This study aims to compare the effects of OPG and testosterone on bone quality in a model of orchidectomised rats, analyzing bone mineral density (BMD), bone microarchitecture, bone remodeling (through the study of biochemical markers of bone turnover), and vertebrae histology.
Materials and methods
Animals
Sixty 3-month-old male Wistar rats weighing 340 ± 38 g (mean ± SD) were used. The animals were kept under constant living conditions (22 °C, 12 h per day of light–dark cycles), and food (standard laboratory chow) and water were available ad libitum.
The animals were randomized into the following groups: one sham-operated group (SHAM, n = 15) and three castrated groups (ORX), one of which was untreated and two receiving treatment (n = 45). ORX was performed in each animal belonging to the three castrated groups using ketamine (40 mg/kg, Ketolar; Bayer, Leverkusen, Germany) and xylazine (8 mg/kg, Rompun, Parke-Davis; Pfizer, NY, USA). The SHAM and untreated ORX groups received saline; the two treated ORX groups received OPG–Fc (10 mg/kg/twice a week) (ORX + OPG, n = 15) or testosterone cypionate (1.7 mg/kg/once a week) (ORX + testosterone, n = 15), respectively. OPG–Fc is a fusion protein composed of OPG and the Fc portion of the heavy chain of human IgG1. Within this molecule, 173 amino acids belong to human OPG (amino acids 22–194) and the rest to the Fc protein of the human IgG1.
Treatment began 1 day after surgery and was maintained for 8 weeks. Both OPG–Fc and saline were administered subcutaneously, while testosterone was administered intramuscularly. OPG–Fc was kindly supplied by Amgen (One Amgen Center Drive, Thousand Oaks, CA, USA). On the day following the last treatment, the experimental animals were weighed and sacrificed by exsanguination under ether anesthesia.
Blood samples were obtained by cardiac puncture, and serum samples were immediately frozen at –80 °C as aliquots until determination of biochemical markers of bone turnover. After exsanguination, the lumbar vertebra L4 was extracted from two rats of each group to perform histological studies. Once the blood was collected, the animals were frozen at –20 °C until determination of BMD in previously thawed animals. Prior to BMD analyses, the left femurs were excised and cleaned of adjacent tissue. The right femur was also excised and cleaned for computerized microtomographic analysis (µCT). Lumbar spine BMD was determined in situ except in those rats in which the L4 had been extracted. Repeated freeze-thaw cycles have been shown to have no influence on the mechanical properties of bone [Citation18]. All procedures were carried out in accordance with European Community Standards on the Care and Use of Laboratory Animals and after approval of the Ethics Committee of Instituto de Investigación Sanitaria Fundación Jiménez Díaz.
Bone mineral density
BMD was determined in situ in the lumbar spine (L2, L3, and L4) and in the entire left femur by double energy X-ray densitometry (DEXA) using a HOLOGIC QDR-1000 TM scanner (S/N 277) (Hologic, Inc., Waltham, MA, USA) with small-animal software [Citation19]. Intra- and inter-assay coefficients of variation were <0.53 and <1.2%, respectively. The scans of the femur were analyzed to determine the BMD of the entire femur. The scans of the L2, L3, and L4 vertebrae were analyzed for the BMD of the whole three vertebrae and the results were expressed as the mean of the values obtained.
Trabecular and cortical microarchitecture analysis of the femur by microCT
The distal region of the right femur was analyzed by µCT (Skyscan 1172; Brucker microCT NV, Kontich, Belgium), imaged with an X-ray tube voltage of 70 kV and a current of 142 µA, and a 1.0-mm aluminum filter. The rotation angle used was 185°, and the angle increment was 0.4°. The voxel size was 11.0 and 13.0 µm. Data sets were reconstructed using a modified Feldkamp algorithm [Citation20]. For the analysis of the microarchitectural properties of trabecular and cortical bone regions, femora specimens were evaluated within a conforming volume of interest (VOI). Both trabecular and cortical bone regions were obtained by free drawing regions of interest and analyzed using the commercial software provided with the equipment (SkyScan™ CT-analyzer software, version 1.7.0).
In the case of the trabecular bone in the region of the femur, a VOI was selected starting at a distance of 1.00 mm from the growth plate and extending a further longitudinal distance of 4 mm in the proximal direction, excluding cortical bone from the analysis. In the case of the cortical bone in the femoral region, a VOI was selected starting at a distance of 7.00 mm from the growth plate and extending a further longitudinal distance of 2 mm in the proximal direction and excluding the trabecular bone. Morphometric indices of the trabecular bone region were determined using the microtomographic data sets (integrated over a VOI) using direct 3D morphometry. Tissue volume of VOI (TV; mm3) and trabecular bone volume (BV; mm3) were calculated based on the hexahedral marching cubes volume model of the VOI. Trabecular BV/TV (%) was calculated directly. Trabecular thickness (TbTh; mm), trabecular separation (TbSp; mm), and trabecular number (TbN; 1/mm) were measured directly on 3D images using methods previously described [Citation21,Citation22]. Measurements of TbTh were calibrated by scanning and analyzing three aluminum foils with thicknesses of 50, 125, and 250 µm. The nonmetric indices, structure model index (SMI), and trabecular bone pattern factor (TbPf; 1/mm) were also calculated using the direct 3 D model. The SMI parameter indicates the relative prevalence of rods and plates in a 3D structure [Citation23]. The TbPf (1/mm) measures the relative convexity or concavity of the total bone surface (BS) [Citation24]. The degree of anisotropy (DA) represents trabecular anisotropy, defined as the ratio between the maximal and minimal radius of the mean intercept length [Citation25].
Cortical bone parameters were measured in two different ways. First, analyzing quantitative parameters from the values got analyzing each one of the transverse sections (analysis 2D). It is also possible interpolate the sections, taking into account the space between adjacent sections, making the 3D analysis. The parameters obtained by 3D analysis included cortical thickness (CtTh), an indicator of the thickness of the cortical wall in the volume analyzed; cortical volume (CtV), the volume of cortical bone in the volume analyzed; medullary volume (MV), calculated by subtracting the analyzed volume the CtV. Parameters obtained by 2D analysis included cross-sectional thickness (CsTh), the thickness of the cortical region calculated by excluding the space between cross-sections, and only analyzing the thickness of each section (CsTh is an alternative to CtTh); mean total cross-sectional bone area (BAr), which represents the mean of the bone areas of each one of the transverse sections in the studied region; cortical endosteal perimeter (CtEnPm), or the perimeter of the internal face of the cortical wall; cortical periostal perimeter (CtPePm), the perimeter of the external face; mean polar moment of inertia (MMI), which indicates the resistance to rotation of a cross-section about a chosen axis being the rotational analog of mass for linear motion; mean excentricity (Ecc), a parameter that indicates the difference between the elongation of the cortical region (generally elliptical in shape) with respect to a circular shape.
Representative longitudinal images of the distal femur and cross-sectional µCT images of the distal femur metaphysis were also obtained.
Biochemical markers of bone turnover
Serum bone Gla protein (osteocalcin; BGP) was determined by ELISA for the specific quantitative determination of rat osteocalcin levels (Rat-MID Osteocalcin; Immunodiagnostic Systems, Tyne and Wear, UK). The sensitivity of this assay was 50 ng/ml. Intra- and inter-assay coefficients of variation of the method were <5.0 and <6.6%, respectively.
Total serum alkaline phosphatase was determined in an ADVIA CENTAUR 2400 autoanalyzer by hydrolysis of p-nitrophenil phosphate. The sensitivity of this assay was 5 U/l. Intra- and inter-assay coefficients of variation of the method were <1.9 and <2.4%, respectively.
Serum C-telopeptide of type I collagen (CTX) was measured by an ELISA specific for rat CTX (RatLaps ELISA; IDS). The sensitivity of the assay was 2.0 ng/ml. Intra- and inter-assay variation coefficients of the method were <5.6 and <10.5%, respectively.
Coronal planes of the femur
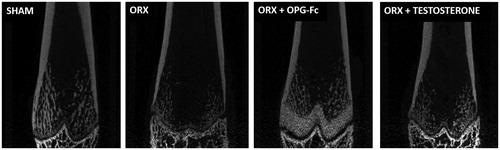
Coronal planes of the femur were analyzed by X-ray.
Vertebral histology
Extracted L4 vertebrae were placed in 4% paraformaldehyde for 24 h and decalcified in 10% EDTA (Ofteosoft). After placement in paraffin, histological sections with a thickness of 5 µm were performed, after which these were dyed with hematoxylin/eosin and safranin fast green.
Statistical analyses
The results of the experiments were expressed as the mean ± SD of the different parameters. A nonparametric method, the Mann–Whitney test (Medcalc Software Program, Belgium), was used to compare the different treatment groups. A p value of <.05 was accepted as denoting a significant difference.
Results
Weights
The initial weight of the rats was 340 ± 38 g. After 8-week treatment, the weights of the different groups were as follows: SHAM 397 ± 40 g, ORX 403 ± 53 g, ORX + OPG–Fc 414 ± 42 g, and ORX + testosterone 408 ± 41 g. No statistically significant differences were found between the four groups, though the weight difference with respect to the start of the study was significant (p < .05).
Bone mineral density
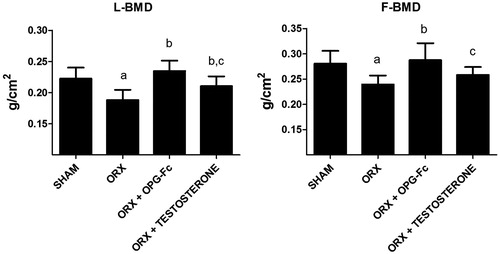
Compared to the SHAM group, the lumbar BMD (LBMD) and femoral BMD (FBMD) of ORX rats were significantly decreased (p < .001 and p < .01, respectively). Administration of OPG restored LBMD (p < .001 vs ORX group) and FBMD (p < .001 vs ORX group), revealing BMD levels similar to those of the SHAM group. Administration of testosterone restored LBMD (p < .05 vs ORX group), with no differences found relative to the SHAM group. The LBMD of rats treated with OPG was significantly higher than that of rats treated with testosterone. Treatment with testosterone recover FBMD loss due to orchidectony without significant differences relative to the SHAM group but also without significant differences as compared to the ORX group; additionally, these values were lower than those of rats treated with OPG–Fc ().
Figure 1. Bone mineral density, BMD (g/cm2) measured in lumbar vertebrae (LBMD) and in femur (FMBD). Three-month-old male Wistar rats: sham-operated rats (SHAM) and orchidectomized rats as baseline and castrated rats treated with 10 mg/kg of OPG–Fc twice weekly (ORX + OPG–Fc) or testosterone cypionate (1.7 mg/kg/once a week) (ORX + testosterone). Data are expressed as mean ± SD of 15 animals/group in the case of FMBD and 23 animals/group in the case of LMBD. Statistical significance: a vs SHAM; b vs ORX; c vs ORX + OPG–Fc. LBMD: ORX vs SHAM p < .001; ORX + OPG–Fc vs ORX p < .001; ORX + testosterone vs ORX p < .05; ORX + testosterone vs ORX + OPG–Fc p < .05. FBMD: ORX vs SHAM p < .01; ORX + OPG–Fc vs ORX p < .001; ORX + testosterone vs ORX + OPG–Fc p < .05.
Trabecular microarchitecture
and show bone trabecular microstructural parameters. Eight weeks after surgery, most of the variables characterizing bone structure (from µ-CT) were significantly different in the ORX group with respect to the SHAM group. ORX rats exhibited a significant decrease in BV/TV and in BS/total volume in the distal femur (p < .01). This is the consequence of an increase in TbSp (p < .01) and a decrease in TbN (p < .01). Treatment with OPG increased BV/TV and BS/TV (p < .05) significantly with respect ORX rats, although without reaching levels recorded in SHAM animals. Treatment with OPG also increased BS/BV values to levels higher than those of the SHAM group (p < .01). Treatment with OPG recovered TbSp in the SHAM group and increased TbN with respect to ORX rats (p < .05), though the TbTh was lower than that of SHAM and ORX rats (p < .01). Treatment with testosterone led to a significant increase (p < .05) in BV/TV and BS/TV with respect ORX rats although without reaching SHAM levels without affecting BS/BV. Treatment with testosterone also maintained the TbTh of rats, increased TbN with respect to the ORX group (p < .05) – although not reaching levels of SHAM group – and decreased TbSp with respect to the ORX group, without reaching SHAM levels ().
Figure 2. Femoral trabecular microarchitecture analysis: bone volume/tissue volume (BV/TV), bone surface/bone volume (BS/BV), bone surface/tissue volume (BS/TV), trabecular thickness (TbTh), trabecular separation (TbSp), trabecular number (TbN). Three-month-old male Wistar rats: Sham-operated rats (SHAM) and orchidectomized rats (ORX) as baseline and castrated rats treated with 10 mg/kg of OPG–Fc twice weekly (ORX + OPG–Fc) or testosterone cypionate (1.7 mg/kg/once a week) (ORX + testosterone). Data are expressed as mean ± SD with 15 animals/group. Statistical significance: a vs SHAM; b vs ORX; c vs ORX + OPG–Fc. BV/TV: ORX vs SHAM p < .01; ORX + OPG–Fc vs SHAM p < .05; ORX + testosterone vs SHAM p < .05; ORX + OPG–Fc vs ORX p < .05; ORX + testosterone vs ORX p < .05. BS/BV: ORX + OPG–Fc vs SHAM p < .01; ORX + OPG–Fc vs ORX p < .01; ORX + testosterone vs ORX + OPG–Fc p < .001. BS/TV: ORX vs SHAM p < .01; ORX + OPG–Fc vs SHAM p < .05; ORX + OPG–Fc vs ORX p < .05; ORX + testosterone vs SHAM p < .05; ORX + testosterone vs ORX p < .05. TbTh: ORX + OPG–Fc vs SHAM p < .01; ORX + OPG–Fc vs ORX p < .01. TbSp: ORX vs SHAM p < .01; ORX + OPG–Fc vs ORX p < .01; ORX + testosterone vs SHAM p < .05; ORX + testosterone vs ORX p < .05; ORX + testosterone vs ORX + OPG–Fc p < .05. TbN: ORX vs SHAM p < .01; ORX + OPG–Fc vs SHAM p < .05; ORX + OPG–Fc vs ORX p < .05; ORX + testosterone vs SHAM p < .05; ORX + testosterone vs ORX p < .05.
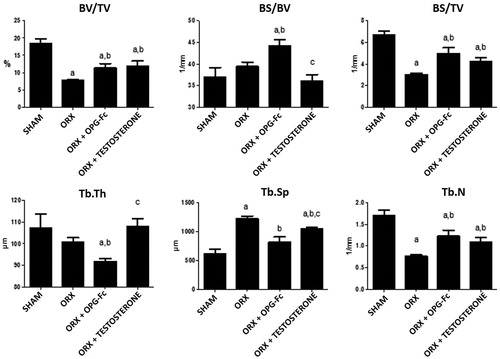
Figure 3. Nonmetric femoral trabecular microarchitecture analysis: trabecular pattern factor (TbPf), structural model index (SMI), and anisotropy degree (DA). Three-month-old male Wistar rats: sham-operated rats (SHAM) and orchidectomized rats (ORX) as baseline and castrated rats treated with 10 mg/kg of OPG–Fc twice weekly (ORX + OPG–Fc) or testosterone cypionate (1.7 mg/kg/once a week) (ORX + testosterone). Data are expressed as mean ± SD of 15 animals/group. Statistical significance: a vs SHAM; b vs ORX; c vs ORX + OPG–Fc. TbPf: ORX vs SHAM p < .05; ORX + OPG–Fc vs SHAM p < .01. SMI: ORX vs SHAM p < .05; ORX + OPG–Fc vs SHAM p < .05.
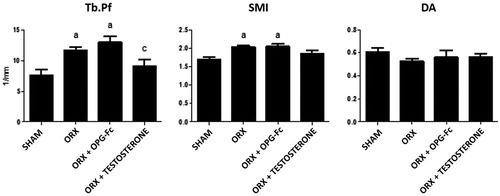
ORX also induced significant changes in nonmetric parameters. TbPf increased in the ORX group (p < .05), indicating a low connectedness of trabeculae. SMI was also significantly increased (p < .01) due to surgery, indicating a transformation of trabecular bone from a plate- to a rod-like structure. This effect observed in ORX rats was not reversed with OPG treatment but was reversed with testosterone treatment. The DA did not reflect any change between the ORX and SHAM groups or between treated rats with respect to the SHAM and ORX groups ().
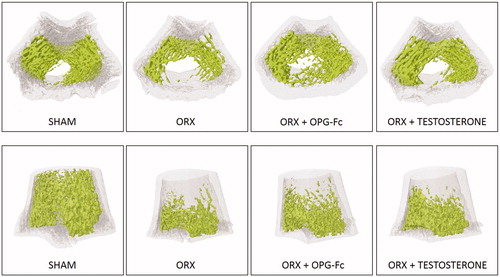
shows a representative image of bone trabecular microarchitecture in the femurs of all the groups studied.
Figure 4. Representative images of bone trabecular 3D microarchitecture in femur sections in groups obtained by computed microtomography. Three-month-old male Wistar rats: Sham-operated rats (SHAM) and orchidectomized rats (ORX) as baseline and castrated rats treated with 10 mg/kg/twice a week of OPG–Fc (ORX + OPG–Fc) or testosterone cypionate (1.7 mg/kg/once a week) (ORX + testosterone).
Cortical microarchitecture
ORX produced a significant decrease in femoral CtV, BAr, CtPePm, MMI, and Ecc with respect to the SHAM group, without differences in the other parameters of cortical microarchitecture studied. Both treatments with OPG and testosterone restored values equal to those of the SHAM group (). shows a representative image of bone trabecular microarchitecture in the femurs of all the groups studied.
Figure 5. Cortical mocroarchitecture analysis: cortical thickness (CtTh), cortical volume (CtV), medullary volume (MV), cross-sectional thickness (CsTh), mean total cross-sectional bone area (BAr), cortical periostal perimeter (CtPePm), cortical endosteal perimeter (CtEnPm), mean polar moment of inertia (MMI), and mean excentricity (Ecc). Three-month-old male Wistar rats: sham-operated rats (SHAM) and orchidectomized rats (ORX) s as baseline and castrated rats treated with 10 mg/kg/twice a week of OPG–Fc (ORX + OPG–Fc) or testosterone cypionate (1.7 mg/kg/once a week) (ORX + testosterone). Data are expressed as mean ± SD of 15 animals/group. Statistical significance: a: p < .05, significant vs SHAM group.
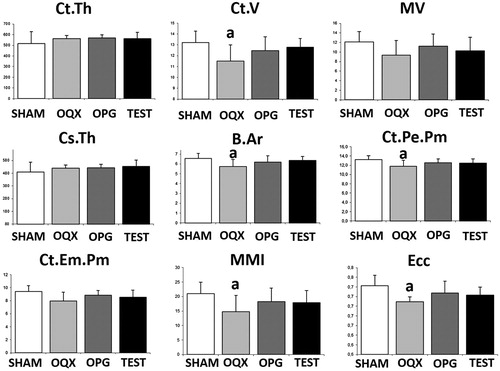
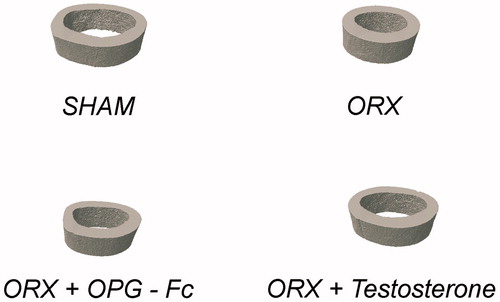
Figure 6. Representative images of bone cortical microarchitecture in femur sections in groups obtained by computed microtomography. Three-month-old male Wistar rats: sham-operated rats (SHAM) and orchidectomized rats (ORX) as baseline and castrated rats treated with 10 mg/kg/twice a week of OPG–Fc (ORX + OPG–Fc) or testosterone cypionate (1.7 mg/kg/once a week) (ORX + testosterone).
Bone remodeling biochemical markers
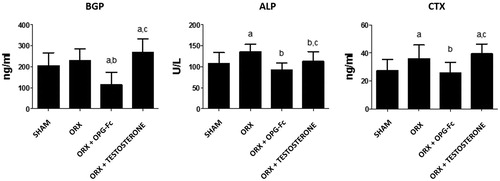
shows levels of biochemical markers of bone turnover. Eight weeks after ORX, untreated ORX rats were observed as having the same levels of BGP as in the SHAM rats, but levels of ALP and CTX (p < .05) were increased with respect to those of SHAM rats. Treatment with OPG decreased levels of BGP, both with respect to the ORX and SHAM groups (p < .01) and decreased levels of ALP with respect to the ORX group (p < .01), recovering levels resembling those of the SHAM group and decreasing levels of CTX with respect to ORX group (p < .05), recovering levels of SHAM group. Treatment with testosterone increased levels of BGP with respect to the SHAM group (p < .05). Treatment with testosterone produced levels of ALP that were lower than those of ORX (p < .05) but higher than those treated with ORX + OPG–Fc. Testosterone did not produce any change in the levels of CTX caused by ORX.
Figure 7. Serum biochemical markers of bone turnover: osteocalcin (BGP), total alkaline phosphatase (ALP), and telopeptide carboxy terminal of collagen I (CTX). Three-month-old male Wistar rats: sham-operated rats (SHAM) and orchidectomized rats (ORX)as baseline and castrated rats treated with 10 mg/kg/twice a week of OPG–Fc (ORX + OPG–Fc) or testosterone cypionate (1.7 mg/kg/once a week) (ORX + testosterone). Data are expressed as mean ± SD of 15 animals/group. Statistical significance: a vs SHAM; b vs ORX; c vs ORX + OPG–Fc. BGP: ORX + OPG–Fc vs SHAM p < .001; ORX + testosterone vs SHAM p < .05; ORX + OPG–Fc vs ORX p < .001; ORX + testosterone vs ORX + OPG–Fc p < .001. ALP: ORX vs SHAM p < .05; ORX + OPG–Fc vs ORX p < .01; ORX + testosterone vs ORX p < .05; ORX + testosterone vs ORX + OPG–Fc p < .05. CTX: ORX vs SHAM p < .05; ORX + OPG–Fc vs ORX p < .05; ORX + testosterone vs SHAM p < .05; ORX + testosterone vs ORX + OPG–Fc p < .05.
Coronal planes of the femur
An analysis of coronal planes of the femur showed osteopetrosis in the metaphyseal region of long bones in rats treated with OPG ().
Figure 8. Coronal planes of femur performed by X-ray. Three-month-old male Wistar rats: sham-operated rats (SHAM) and orchidectomized rats (ORX) as baseline and castrated rats treated with 10 mg/kg/twice a week of OPG–Fc (ORX + OPG–Fc) or testosterone cypionate (1.7 mg/kg/once a week) (ORX + testosterone).
Vertebral histology
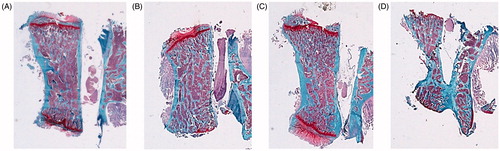
With safranin staining, a decrease in the CtTh of the vertebral body was observed in the ORX group with respect to SHAM group. This parameter was recovered with OPG–Fc treatment. The group treated with testosterone could not be well visualized ().
Figure 9. Safranin staining 4×. Cortical component of the L4 vertebrae. Sham-operated rats (SHAM) (A) and orchidectomized rats (ORX) (B) as baseline and castrated rats with 10 mg/kg/twice a week of OPG–Fc (ORX + OPG–Fc) (C) or testosterone cypionate (1.7 mg/kg/once a week) (ORX + testosterone) (D). Safranin staining. Magnification 4×. Safranin staining let orient the samples in a same plane, because growing palates are identified in red, staying in an upper and lower view.
With hematoxylin/eosin staining, more thin trabeculae were observed in the ORX group with respect to the SHAM group. Treatment with OPG–Fc enabled us to see the thinner trabeculae as well but in a great number, a result similar to that observed in microtomography: lower TbTh and an increase in TbN. Testosterone treatment led to an increase in TbTh without any change in TbN ( and ).
Figure 10. Hematoxylin-eosin staining 4×. Trabecular component of the L4 vertebrae. Sham-operated rats (SHAM) (A) and orchidectomized rats (ORX) (B) as baseline and castrated rats treated with 10 mg/kg of OPG–Fc twice weekly (ORX + OPG–Fc) (C) or testosterone cypionate (1.7 mg/kg/once a week) (ORX + testosterone) (D).
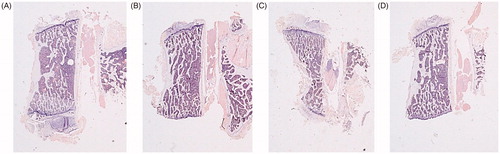
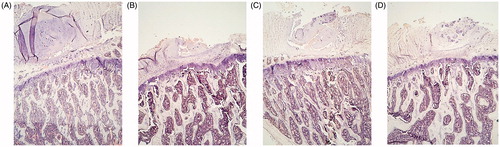
Figure 11. Hematoxylin eosin staining 100×. Trabecular component of the L4 vertebrae. Sham-operated rats (SHAM) (A) and orchidectomized rats (ORX) (B) as baseline and castrated rats treated with 10 mg/kg/twice a week of OPG–Fc (ORX + OPG–Fc) (C) or testosterone cypionate (1.7 mg/kg/once a week) (ORX + testosterone) (D). Greater magnification allowed us to better visualize the increase in trabecular thickness in the group of rats treated with testosterone.
Discussion
Testosterone was reduced by 98% in the serum of ORX rats at days 7 and 14 postsurgery [Citation17]. These changes were evident due to increased bone resorption [Citation26]. The relative balance of OPG and RANKL after ORX has been proposed to be an important determining factor of bone resorption [Citation17]. RANKL in bone marrow plasma and bone marrow cell extracts was significantly increased (by 100%) 1 and 2 weeks after ORX. There was a significant inverse correlation between testosterone and RANKL levels measured in bone marrow cell extracts, while marrow plasma RANKL correlated positively with marrow plasma TRAP, an osteoclast marker [Citation17]. The conditional ablation of androgen receptors in mice causes bone loss associated with increased osteoblast expression of RANKL [Citation27]. Increased skeletal RANKL mRNA expression has also been demonstrated in ORX rats [Citation28]. The inverse correlation between testosterone and RANKL levels in bone marrow cell extracts is consistent with a suppressive effect of testosterone on RANKL production by bone marrow cells [Citation17]. However, direct effects of testosterone on RANKL protein or mRNA expression have not been demonstrated and other mechanisms are possible. For example, aromatases can convert testosterone to estradiol [Citation29–31] and this phenomenon likely accounts for the observed reduction of both testosterone and estradiol within 2 weeks of ORX in rats [Citation16]. Estradiol has been shown to inhibit RANKL expression in bone marrow cells harvested for postmenopausal subjects after hormone replacement therapy [Citation32,Citation33]. At this respect, in an exhaustive review between 2000 and 2017, Wong et al. [Citation34] studied the possibility of the use of selective estrogen receptor modulators (SERMs) on bone health in men, concluding that this review suggested the potential use of SERMs on male skeletal system. Ovariectomized rats have been reported to have significantly greater serum RANKL and osteoclast surface and reduced areal and volumetric BMD [Citation26]. These results are consistent with the possibility that increased RANKL in ORX-rat bone marrow was the direct result of reduced estradiol levels due to a lack of testosterone.
A two-sided physiological problem occurs after ORX, that is, lack of testosterone and an increase in RANKL levels produced by this loss. As a result, we can act against post-ORX problems in two ways: testosterone reposition and blocking of RANKL. To date, two agents capable of blocking the binding of RANKL to RANK have been tested in clinical studies: OPG (Fc–OPG fusion molecule) and the RANKL antibody denosunab [Citation9]. However, denosumab is a human antibody and cannot be used in experimental studies. For this reason, in this work, we have used Fc–OPG as an anti-RANKL agent, comparing the effects produced by testosterone and OPG on the influence of ORX on bone health in male gonadectomised rats.
The World Health Organization (WHO) specifically lists ORX as an appropriate method of inducing bone loss in experimental animals to simulate male osteoporosis [Citation35], and the orchidectomized rat model constitutes a validated experimental model to simulate male osteoporosis [Citation36].
In the present work, we found alterations after ORX in BMD, bone microstructure, bone remodeling, and lumbar histology.
Regarding BMD, in our work, both L and F BMD were significantly decreased in ORX rats as compared to the SHAM group. Both testosterone and OPG–Fc led to the recovery of L and FBMD, though the levels of LBMD and FBMD after OPG–Fc treatment were higher than those observed after testosterone treatment. Li et al. [Citation17] studied 3-month-old male Sprague-Dawley ORX rats treated with vehicle and OPG–Fc (10 mg/kg, twice weekly, a similar dose to that in our work). In their study, femur and tibia BMD were determined. DXA analysis revealed a significant deficit in areal BMD in vehicle-treated rats compared to SHAM controls on day 42. Additionally, ORX rats with OPG–Fc had significantly greater femur/tibia BMD than ORX-vehicle controls, a result that coincides with ours. Ominsky et al. [Citation37] treated gonad-intact cynomolgus monkeys (for up to 6 months) with OPG–Fc (15 mg/kg) weekly for 6 months. Cortical and trabecular BMD at the proximal tibia and distal radius metaphysis were significantly increased by OPG–Fc treatment. Sipos et al. [Citation38] treated growing pigs with OPG–Fc (5 mg/kg) at day 0, and pigs were killed at day 20. Dual X-ray absorptiometry results for the proximal femur did not differ between the two groups, although the authors did find differences in corticostructural parameters. In humans, testosterone replacement in young or adult men with organic causes of hypogonadism increased BMD [Citation39,Citation40]. Basurto et al. [Citation41] administered testosterone enanthate every 3 weeks during 12 months to men over 60 years old with decreased testosterone levels. Testosterone treated group exhibited a significant increment in LBMD in parallel with a significant increment in testosterone concentration although no significant change occurred in femoral neck BMD. In a similar way, Bouloux et al. [Citation42] treated a group of aging men with symptomatic testosterone deficiency with oral testosterone undecanoate therapy. This treatment led to improvement in LBMD and FBMD in these patients. Dutasteride is a five-alpha reductase inhibitor, which blocks the conversion of testosterone to DHT, contributing to an increase of approximately 18% in testosterone level [Citation43]. Due to this fact, this drug is widely used for treatment of prostatic hyperplasia, but it is important to take into account its effect on testosterone levels. ShIgehara et al. [Citation44] treated patients with benign prostate hyperplasia and hypogonadism with dutasteride and found that this drug in addition to improved urinary symptoms in these patients made a positive contribution to their BMD due to its effect on testosterone levels. The same effect of dutasteride on BMD was found by Wada et al. [Citation45] in aging male patients with lower urinary tract symptoms and prostatic enlargement. An association between BMD and testosterone levels was also found in men with prediabetes [Citation46]. According to our results, OPG–Fc appeared to exert a higher effect on BMD than testosterone, because L and FBMf ORX rats treated with OPG–Fc were higher than those of ORX rats treated with testosterone. However, as indicated in the “Results” section, the analysis of coronal planes of the femur shows osteopetrotic changes in the metaphyseal region of long bones treated with OPG–Fc, which could be the cause of this increase of LBMD found in the rats treated with OPG. Along these lines, Yamashita et al. [Citation47] who studied Klotho gene mutant mice (with OPG levels about twofold higher than those in wild type mice) found an osteopetrotic phenotype. Ominsky et al. [Citation48] made transgenic rats (Tg) engineered to continuously overexpress OPG, and they found that femurs from OPG–Tg rats were of normal length but showed mild osteopetrotic changes. In our work, we found that, overall, treatment with OPG–Fc and testosterone led to a recovery of the microstructural parameters of bone. ORX produced an increase in TbSp and a decrease in BV/TV, BS/TV, and TbN. However, there were some differences in the effects produced by OPG–Fc and testosterone: with OPG–Fc treatment, values of BS/BV were higher than after treatment with testosterone, but testosterone treatment caused a recovery of levels of TbTh of OQX rats while OPG–Fc did not. Also, testosterone treatment caused a recovery of the levels of Tb Pf and SMI, though these values were not recovered with OPG–Fc. It is difficult to determine which of these two treatments was better for bone with respect to microstructural pattern, though both were seen to be very positive for bone health.
With respect to microstructural cortical parameters, both treatments with OPG–Fc and testosterone restored values similar to those of the SHAM group that were altered with ORX.
In the work of Li et al. [Citation17], the authors observed that treating ORX Sprague-Dawley rats with OPG–Fc increased trabecular BV to levels that significantly exceeded values for ORX or SHAM controls. Yarrow et al. [Citation49] observed that high doses of testosterone enanthate (TE) might prevent hypogonadism-induced osteopenia. TE administered to 3-month-old male gonadectomised Fisher rats prevented ORX-induced changes in TbN and separation, cancellous BV, and osteoid surface. Filipovic et al. [Citation50] studied 15-month-old Wistar rats that were ORX and treated with 5 mg/kg of testosterone propionate (TP) once a day for 3 weeks. Administration of TP enhanced cancellous bone TbTh and TbN and reduced TbSp through the increase in calcitonin-producing thyroid C cells, which may contribute to the bone protective effects of sex hormones in the rat model of male osteoporosis. With respect to bone remodeling, in our work, we found that ORX did not produce any effect on BGP levels but did produce an increase in the levels of ALP and CTX, showing greater bone remodeling. We found that treatment with OPG–Fc decreased bone remodeling in ORX rats, decreasing BGP, ALP, and CTX. However, and in spite of the benefits observed in bone health in ORX rats treated with testosterone, testosterone did not produce changes in the levels of bone turnover of ORX rats, except in the case of ALP.
In previous works, Yarrow et al. [Citation49] found an increase in deoxypyridinoline/creatinine and De la Piedra et al. [Citation36] found an increase in BGP levels in ORX rats, revealing augmented bone remodeling. Ominsky et al. [Citation37] found that administration of OPG–Fc to cynomolgus monkeys decreased levels of biochemical markers of bone turnover (urine N-telopeptide and serum osteocalcin), and the administration of recombinant OPG–Fc to growing pigs produced an inhibition of bone formation and resorption [Citation38]. In contrast with our findings, previous authors found that the administration of TE [Citation49] and TP [Citation50] decreased bone remodeling, triggering a reduction in biochemical markers of bone turnover.
In an interesting article, Xiong et al. [Citation51], incubated osteoblast cell lines with osteoclast precursor cell lines RAW 264.7 and added OPG–Fc to coculture system. These authors demonstrated that, with the addition of OPG, multinucleated giant cells and cortical bone-pit formation counting decreased significantly compared to the control group, showing the negative effects of OPG–Fc on the differentiation of osteoclast precursors.
The use of OPG–Fc to prevent orthodontic relapse and to stimulate anchorage in orthodontics [Citation52,Citation53] demonstrates the inhibition of osteoclastogenesis produced by this compound.
It has been demonstrated that testosterone causes osteoclastic apoptosis, ultimately decreasing bone resorption [Citation54]. Age-related bone loss is widely accepted as related to decreased serum levels of circulating sex hormones. At this respect, Risto et al. [Citation55] studied a group of men with a history of distal radius fractures. They found that this group presented lower calcaneal bone density, lower free androgen index, and lower bioavailable testosterone than healthy age-matched controls. Previous studies have shown that the BMD of vertebral bones in men with idiopathic osteoporosis can be increased with testosterone replacement therapy [Citation56]. Long-term testosterone replacement therapy with testosterone undecanoate in middle-aged man with late-onset hypogonadism and metabolic syndrome determines a significant increase in both vertebral BMD and FBMD related to increased serum testosterone levels, possibly independently for estradiol modification [Citation57].
In our work, histopathological description of vertebrae confirms the findings of microtomography in ORX rats treated with OPG–Fc and testosterone.
In conclusion, this work confirms the positive effect of OPG–Fc and testosterone on bone quality in orchidectomized rats, a group that exhibits a deleterious bone in terms of BMD and microtomographic parameters. At the dose levels used in this study, OPG–Fc and testosterone displayed actions that were quite similar, because the higher increase in BMD produced by OPG–Fc was due to the development of a certain degree of osteopetrosis.
Disclosure statement
No potential conflict of interest was reported by the authors.
Additional information
Funding
References
- Boyce BF, Xing L. Biology of RANK, RANKL, and osteoprotegerin. Arthritis Res Ther. 2007;9 Suppl 1:S1.
- Lacey DL, Timms E, Tan HL. Osteoprotegerin ligand is a cytokine that regulates osteoclast differentiation and activation. Cell. 1998;93:165–176.
- Yasuda H, Shima N, Nakagawa N. Osteoclast differentiation factor is a ligand for osteoprotegerin/osteoclastogenesis-inhibitory factor and is identical to TRANCE/RANKL. Proc Natl Acad Sci USA. 1998;95:3597–3602.
- Anderson DM, Maraskovsky E, Billingsley WL, et al. A homologue of the TNF receptor and its ligand enhance T-cell growth and dendritic-cell function. Nature. 1997;390:175–179.
- Wong BR, Rho J, Arron J, et al. TRANCE is a novel ligand of the tumor necrosis factor receptor family that activates c-Jun N-terminal kinase in T cells. J Biol Chem. 1997;272:25190–25194.
- Quinn JM, Elliott J, Gillespie MT, et al. A combination of osteoclast differentiation factor and macrophage-colony stimulating factor is sufficient for both human and mouse osteoclast formation in vitro. Endocrinology. 1998;139:4424–4427.
- Arboleya L, Castañeda S. Osteoclastos: mucho más que células remodeladoras del hueso. Rev Osteoporos Metab Miner. 2014;6:109–121.
- Hofbauer LC, Dunstan CR, Spelsberg TC, et al. Osteoprotegerin production by human osteoblast lineage cells is stimulated by vitamin D, bone morphogenetic protein-2, and cytokines. Biochem Biophys Res Commun. 1998;250:776–781.
- Hamdy NA. Osteoprotegerin as a potential therapy for osteoporosis. Curr Rheumatol Rep. 2006;8:50–54.
- Schwarz ED, Ritchlin CT. Clinical development of anti-RANKL teraphy. Arthritis Res Ther. 2007;9:(Suppl. 1):S7.
- Greenspan SI, Coates P, Sereika SM, et al. Bone loss after initiation of androgen deprivation theraphy in patients with prostate cancer. J Clin Endocrinol Metab. 2005;90:6410–6417.
- Shahinian VB, Kuo YF, Freeman JI, et al. Risk of fracture after androgen deprivation for prostate cancer. N Engl J Med. 2005;352:154–164.
- Snyder PJ, Kopperdahl DL, Stephens-Shields AJ, et al. Effect of testosterone treatment on volumetric bone density and strength in older men with low testosterone: a controlled clinical trial. JAMA Intern Med. 2017;177:471–479.
- Turner RT, Hannon KS, Demers LM, et al. Differential effects of gonadal function on bone histomorphometry in male and female rats. J Bone Miner Res. 1989;4:557–563.
- Turner RT, Wakley GK, Hannon KS. Differential effects of androgens on cortical bone histomorphometry in gonadectomized male and female rats. J Orthop Res. 1990;8:612–617.
- Erben RG, Eberle J, Stahr K, et al. Androgen deficiency induced high turnover osteopenia in aged male rats: a sequential histomorphometric study. J Bone Miner Res. 2000;15:1085–1098.
- Li X, Ominsky MS, Stolina M, et al. Increased RANK ligand in bone marrow of orchiectomized rats and prevention of their bone loss by the RANK ligand inhibitor osteoprotegerin. Bone. 2009;45:669–676.
- Borchers RE, Gibson LJ, Burchardt H, et al. Effects of selected thermal variables on the mechanical properties of trabecular bone. Biomaterials. 1995;16:545–551.
- Gala Paniagua J, Díaz-Curiel M, De la Piedra Gordo C, et al. Bone mass assessment in rats by dual energy X-ray absorptiometry. Br J Radiol. 1998;71:754–758.
- Feldkamp LA, Davis LC, Kress JW. Practical cone-beam algorithm. J Opt Soc Am A. 1984;1:612–619.
- Hildebrand T, Ruegsegger P. A new method for the model-independent assessment of thickness in three-dimensional images. J Microsc. 1997;185:67–75.
- Ulrich D, Van Rietbergen B, Laib A, et al. The ability of three-dimensional structural indices to reflect mechanical aspects of trabecular bone. Bone. 1999;25:55–60.
- Hildebrand T, Rüegsegger P. Quantification of bone microarchitecture with the structure model index. Comput Methods Biomech Biomed Eng. 1997;1:15–23.
- Hahn M, Vogel M, Pompesius-Kempa M, et al. Trabecular bone pattern factor – a new parameter for simple quantification of bone microarchitecture. Bone. 1992;13:327–330.
- Harrigan TP, Mann RW. Characterization of microstructural anisotropy in orthotropic materials using a second rank tensor. J Mater Sci. 1984;19:761–767.
- Vanderschueren D, Vandenput I, Boonen S, et al. An aged rat model of partial androgen deficiency: prevention of both loss of bone and lean body mass by low dose androgen replacement. Endocrinology. 2000;141:1642–1647.
- Kawano H, Sato T, Yamada T, et al. Suppressive function of androgen receptor in bone resorption. Proc Natl Acad Sci USA. 2003;100:9416–9421.
- Franklin M, Bu SY, Lerner MR, et al. Dried plum prevents bone loss in a male osteoporosis model via IGF-I and the RANK pathway. Bone. 2006;39:1331–1342.
- Tyagi V, Scordo M, Yoon RS, et al. Revisiting the role of testosterone: are we missing something? Rev Urol. 2017;19:16–24.
- Tuck SP, Francis RM. Testosterone, bone and osteoporosis. Front Horm Res. 2009;37:123–132.
- Hunter I, Hay CW, Esswein B, et al. Tissue control of androgen action: the ups and downs of androgen receptor expression. Mol Cell Endocrinol. 2018;465:27–35.
- Taxel P, Kaneko H, Lee SK, et al. Estradiol rapidly inhibits osteoclastogenesis and RANKL expression in bone marrow cultures in postmenopausal women: a pilot study. Osteoporos Int. 2008;19:193–199.
- Eghbali-Fatourechi G, Khosla S, Sanyal A, et al. Role of RANK ligand in mediating increased bone resorption in early postmenopausal women. J Clin Invest. 2003;111:1221–1230.
- Wong SK, Mohamad NV, Jayusman PA, et al. The use of selective estrogen receptor modulators on bone health in men. Aging Male. 2018 DOI:10.1080/13685538.2018.1448058.
- World Health Organization. Guidelines for preclinical evaluation and clinical trials in osteoporosis. Geneva: WHO; 1998.
- De la Piedra C, Quiroga I, Montero M, et al. Daily or monthly ibandronate prevents or restores deteriorations of bone mass, architecture, biochemical properties and markers of bone turnover in androgen-deficient aged rats. Aging Male. 2011;14:220–230.
- Ominsky MS, Kostenuik PJ, Cranmer P, et al. The RANKL inhibitor OPG-Fc increases cortical and trabecular bone mass in young gond-intact cynomolgus monkeys. Osteoporos Int. 2007;18:1073–1082.
- Sipos W, Zysset P, Kostenuik P, et al. OPG-Fc treatment in growing pigs leads to rapid reductions in bone resorption markers, serum calcium, and bone formation markers. Horm Metab Res. 2011;43:944–949.
- Almeida M, Laurent MR, Dubois V, et al. Estrogens and androgens in skeletal physiology and pathophysiology. Physiol Rev. 2017;97:135–187.
- Shigehara K, Konaka H, Koh E, et al. Effects of testosterone replacement therapy on hypogonadal men with osteopenia or osteoporosis: a subanalysis of a prospective randomized controlled study in Japan (EARTH study). Aging Male. 2017;20:139–145.
- Basurto L, Zarate A, Gomez R, et al. Effect of testosterone therapy on lumbar spine and hip mineral density in elderly men. Aging Male. 2008;11:140–145.
- Bouloux PM, Legros JJ, Elbers JM, et al. Effects of oral testosterone undecanoate therapy on bone mineral density and body composition in 322 aging men with symptomatic testosterone deficiency: a 1-year, randomized, placebo-controlled, dose-ranging study. Aging Male. 2013;16:38–47.
- Rittmaster R, Hahn RG, Ray P, et al. Effect of dutasteride on intraprostatic androgen levels in men with benign prostatic hyperplasia or prostate cancer. Urology. 2008;72:808–812.
- Shigehara K, Koh E, Sakamoto J, et al. Effects of dutasteride on lower urinary tract symptoms and general health in men with benign prostatic hypertroplasia and hypogonadism: a prospective study. Aging Male. 2014;17:51–56.
- Wada N, Hashizume K, Matsumoto S, et al. Dutasteride improves bone mineral density in male patients with lower urinary tract symptoms and prostatic enlargement: a preliminary study. Aging Male. 2016;19:12–14.
- Rabijewski M, Papierska L, Piątkiewicz P. An association between bone mineral density and anabolic hormones in middle-aged and elderly men with prediabetes. Aging Male. 2017;20:205–213.
- Yamashita T, Okada S, Higashio K, et al. Double mutations in klotho and osteoprotegerin gene loci rescued osteopetrotic phenotype. Endocrinology. 2002;143:4711–4717.
- Ominsky MS, Stolina M, Li X, et al. One year of transgenic overexpression of osteoprotegerin in rats suppressed bone resorption and increased vertebral bone volume, density, and strength. J Bone Miner Res. 2009;24:1234–1246.
- Yarrow JF, Conover CF, Purandare AV, et al. Supraphysiological testosterone enanthate administration prevents bone loss and augments bone strength in gonadectomised male and female rats. Am J Physiol Endocrinol Metab. 2008;295:E1213–E1222.
- Filipovic B, Sosic JB, Ajdzanovic V, et al. The effects of sex steroids on thyroid C cells and trabecular bone structure in the rat model of male osteoporosis. J Anat. 2013;222:313–320.
- Xiong Q, Zhang LC, Zhang LH, et al. Effects of recombinant human osteoprotegerin and recombinant RANK protein on the differentiation of osteoclast precursors. Zhongguo Gu Shang. 2013;26:324–327.
- Schneider DA, Smith SM, Campbell C, et al. Locally limited inhibition of bone resorption and orthodontic relapse by recombinant osteoprotegerin protein. Orthod Craniofac Res. 2015;18(Suppl 1):187–195.
- Fernández González FJ, Cañigral A, López-Caballo JL, et al. Recombinant osteoprotegerin effects during orthodontic movement in a rat model. Eortho. 2016;38:379–385.
- Roux S, Orcel P. Bone loss factors that regulate osteoclast differentiation: an update. Arthritis Res. 2000;2:451–456.
- Risto O, Hammar E, Hammar K, et al. Elderly men with a history of distal radius fracture have significantly lower calcaneal bone density and free androgen index than age-matched controls. Aging Male. 2012;15:59–62.
- Francis RM. The effects of testosterone on osteoporosis in men. Clin Endocrinol (Oxf). 1999;50:411–414.
- Aversa A, Bruzziches R, Francomano D, et al. Effects of long-acting testosterone undecanoate on bone mineral density in middle-aged men with late-onset hypogonadism and metabolic syndrome: results from a 36 months controlled study. Aging Male. 2012;15:96–102.