
Abstract
Testosterone is the predominant androgen in men and the lack of it can be a trigger to the development of the metabolic syndrome. Here we review the relationship between testosterone deficiency, metabolic syndrome, and hepatic steatosis reported by studies with men and rodents. The prevalence of metabolic syndrome and testosterone deficiency is higher among older subjects. Low total and free testosterone levels were positively associated with disturbs on energy metabolism, changes in body fat distribution, and body composition. Studies reported visceral fat accumulation in men with hypogonadism and castrated rats. Despite some contradictions, the association between higher adiposity, low testosterone, and metabolic syndrome was a common point among the studies. Few studies evaluated the hepatic steatosis and found an association with hypogonadism. Most of the studies with rodents combined the castration with a high-fat diet to study metabolic disturbs. The importance of proper levels of testosterone for energy metabolism homeostasis in men was also underlined by studies that investigated the metabolic effects of testosterone replacement therapy and androgen deprivation therapy.
Background
Even though human life expectancy has increased in recent years, there are still incident health complications in the older population, some of which are related to age-decline in gonadal hormones. In women, the production of sex steroid hormones by the ovaries stops abruptly at approximately 50 years of age. Consequently, the serum estradiol (E2) level decreases rapidly, menstruation ceases, defining the menopause. Menopause is frequently accompanied by climacteric symptoms such as hot flushes, vaginal dryness, decreased libido, and mood swings [Citation1]. In contrast to women, the reproductive function remains relatively intact in older men. Some of them, however, have similar symptoms to those of climacteric women, including hot flushes, decreased libido, erectile dysfunction (ED), tiredness, and decreased vigor [Citation2]. As a slight decrease in testosterone (T) levels may be responsible for some of these symptoms, the term andropause was suggested for men. However, there is no precise definition for this term [Citation3]. Not all older men have T deficiency and, thus, the analogy between andropause and menopause may belong to clinical manifestations, but not the nature of the hormonal changes [Citation4]. Therefore, the widespread use of T replacement in men, in analogy to estrogen/progesterone replacement therapy in postmenopausal women, is questionable [Citation3].
Physiologically, T is produced in the testicular Leydig cells, stimulated by the pituitary secretion of luteinizing hormone (LH). In serum, T is bound to albumin (50%), sex hormone-binding globulin (SHBG) (44%), and cortisol-binding globulin (4%). Unbounded or free T represents 2% of the total T [Citation5]. In target cells, T is converted to a more bioactive androgen, dihydrotestosterone, via 5α-reductase, and both T and dihydrotestosterone bind to the androgen receptor. T can also be converted to E2 by aromatase, which subsequently activate estrogen receptors ERα and ERβ [Citation6]. The concentration of T is highest in the third decade of life and tends to decline with advancing age by approximately 0.4–1% per year [Citation7–9] resulting in a 20–30% decrease from 20 to 80 years [Citation10]. The diagnosis of male “andropause” requires the presence of not only low T levels, but also clinical symptoms, a condition defined as hypogonadism or late-onset hypogonadism [Citation11]. Wu et al. [Citation12] defined hypogonadism as serum total T levels below 11 nmol/L (320 ng/dL), free T below 220 pmol/L (640 pg/dL) associated with three sexual symptoms [Citation12]. Based on these criteria, overall hypogonadism prevalence was 2.1%, increasing with the age from 0.1% for men aged 40–49, 0.6% for those aged 50–59, 3.2% for 60–69, and 5.1% for men aged 70–79 years [Citation12].
Several lifestyle factors can alter T levels, including alcohol consumption [Citation13] and vigorous physical activity [Citation14]. An association of several age-related diseases with low T levels has been demonstrated, such as obesity, heart disease, type 2 diabetes, sarcopenia, osteoporosis, locomotive syndrome, anemia, mood and cognitive disorders [Citation11,Citation15–20]. It is unclear, however, whether partial androgen deficiency is the main cause of most of this age-related decline in physiological functioning.
The metabolic syndrome (MetS) includes a range of cardiometabolic risk factors consisting of an accumulation of visceral fat, dyslipidemia, insulin resistance and impaired glucose regulation, non-alcoholic fatty liver disease (NAFLD) and hypertension [Citation21,Citation22]. The World Health Organization (WHO) defines MetS by the presence of insulin resistance and other two other factors, which may be elevated triacylglycerol (TG), low high-density lipoprotein cholesterol (HDL-c), elevated blood pressure, type 2 diabetes and obesity. Besides the definition of WHO, several guidelines to define MetS were proposed over the years, including those of National Cholesterol Education Program’s (NCEP), International Diabetes Federation (IDF), European Group for the Study of Insulin Resistance (EGIR), American Association of Clinical Endocrinologists (AACE), American Heart Association (AHA) and even criteria harmonizing the guidelines of these different entities [Citation23,Citation24]. Despite the slight differences in their guidelines, the entities agree that MetS has been increasing worldwide and that the higher prevalence is in the elderly population [Citation25,Citation26]. In people over 50 years of age in the United States, the prevalence of MetS is 24–42%, while in other countries like Iran, the prevalence is as high as 30–45% [Citation27]. Overall present in about 25% of the world population, the MetS doubles the risk of death, and it is estimated that it accounts for 7% of global mortality and 17% of cardiovascular diseases-related (CVD-related) deaths [Citation28].
In general, glucose intolerance and obesity are major sings of MetS. The increased adipose tissue mass, the main characteristic of obesity, is commonly reported by studies evaluating men with hypogonadism, as indicated by altered body mass index (BMI) and elevated waist circumference (WC) [Citation29–34]. Insulin resistance is also a common observation in studies investigating metabolic alterations related to low T levels in men [Citation30,Citation31,Citation33–35]. In experimental models, T deficiency causes metabolic changes in young and adult rodents [Citation36–39]. Besides changes in body weight and adiposity, low T levels can affect the function of several metabolic organs. In the case of the liver, in mice, the surgical induction of T deficiency favored hepatic steatosis induced by a high-fat diet [Citation38,Citation40]. In adult rats, castration induced hepatic TG accumulation [Citation41,Citation42].
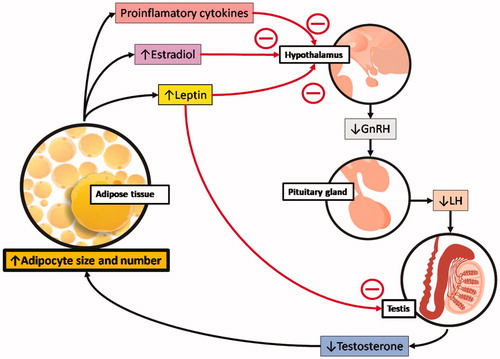
The mechanism behind the metabolic changes under low T condition can be a direct consequence of T production inhibition or the result of a decrease in gonadotropins. The gonadotropin releaser hormone (GnRH) stimulates the pituitary to release the luteinizing hormone (LH), which stimulates Leydig cells to produce T. The inverse relation of T levels with body adiposity may have more than one cause. As shown in , the expansion of adipose tissue originates signals that can act on the hypothalamus and results in decreased LH secretion by the pituitary [Citation43]. Also, is higher the conversion of T into E2 by aromatase in adipose tissue [Citation17,Citation18] and E2 inhibits the hypothalamus stimuli to the pituitary. More than that, T deficiency could be further accentuated by the release of proinflammatory cytokine and leptin by the expanded adipose tissue. Proinflammatory cytokine and the leptin inhibits the hypothalamus, and leptin also has inhibitory effects directly on the testicles, reducing, even more, the T production [Citation44]. It is also known that the inhibition of hepatic SHBG synthesis and release results in a down-regulation of T production via negative feedback [Citation45].
Figure 1. Low testosterone levels and the accumulation of adipose tissue. The expansion of adipose tissue is associated with signals that inhibit the hypothalamic–pituitary–testicular axis and result in decreased androgen levels. Many of these signs target the hypothalamus and reduce gonadotropin-releasing hormone (GnRH) stimulation of the pituitary. This results in lower luteinizing hormone (LH) pulse, decreasing gonadal stimulation, and testosterone release. The signs from adipose tissue that interfere with hypothalamic function include the release of proinflammatory cytokines, higher conversion of testosterone into estradiol (due to the aromatase activity in adipocytes) and the release of the hormone leptin, which directly inhibits the stimulatory action of gonadotropins on the Leydig cells of the testis to decrease testosterone production further. All these signs can accentuate the expansion of fat depots and lead to a state of hypogonadotropic hypogonadism, obesity, and, eventually, metabolic syndrome.
In this review, we explore the literature about the MetS and T, aiming to understand their still controversial cause and effect relationship and summarize new findings to help provide a base for more assertive therapeutic interventions for men with low T levels and MetS. Particular emphasis was given to the hepatic manifestation of the MetS, the NAFLD [Citation46], which is defined as ectopic lipid accumulation (steatosis) in the absence of significant alcohol ingestion. NAFLD is a component of MetS that is frequently neglected, as it may remain benign, being frequently qualified only as reversible steatosis [Citation47]. However, the steatotic liver may become vulnerable to secondary insults as inflammation and fibrosis, causing the NAFLD to evolve to more severe liver diseases as non-alcoholic steatohepatitis (NASH), cirrhosis and even hepatocellular carcinoma [Citation48,Citation49]
Evidences from studies with men on the association between metabolic syndrome and testosterone deficiency
In recent years, many research groups have tried to better understand the relationship between T deficiency and metabolic disturbances in diverse populations of men, of different ages, in different regions of the world. Most of these studies with humans focused on metabolic changes that are detectable by relatively easily measurable anthropometric dimensions and biochemical blood tests. Considering that ED can predict T deficiency, many of the studies also investigated the association with sexual symptoms through specific surveys. When evaluating T, some studies focused on the total levels, while others also calculated free T based on the measurements of total T and SHBG levels. We start our review with those that focused on total T levels, to verify how strong and consistent are the association between total T and MetS componets.
In Australia, a longitudinal study conducted over eight years with 195 men aged 70–92 years (76.2 ± 0.3), Chen et al. [Citation29] aimed to investigate the relationship between metabolic status, obesity, and total T levels. Anthropometric and biochemical measurements were performed at the begging of the study. MetS (NCEP criteria) was found in 17.9% of the population, and low total T (below 8 nmol/L) in 9.2%. Men with MetS had lower total T, HDL-c, and higher BMI, WC, blood pressure, fasting glycemia, and TG. Almost half (42.85%) of the subjects with MetS had type 2 diabetes. When separated by age, men with 80 years or more had lower levels of total T than those aged between 75 and 79 years. Independently of MetS, men with type 2 diabetes had lower total T, LDL-c and HDL-c, but higher fasting glycemia and TG. Lower total T in men older than 80 years was still evident after excluding subjects with MetS and those with diabetes. Besides LDL-c, only WC was related to total T variance. Total T could not predict incident type 2 diabetes and showed to continue declining even in healthy men over the age of 80 years. These results suggested that T deficiency would be a consequence rather than the cause of poor metabolic status [Citation29].
In the retrospective study of Grosman et al. [Citation50] the relationship between total T and MetS was investigated in 2906 Argentine men (45–70 years) with diagnosed prostate cancer. MetS was diagnosed according to the NCEP criteria, and besides BMI, WC, blood pressure, and glycemia, the lipid profile was also determined. According to total T levels, the subjects were divided into four groups, and statistical analyses revealed an inverse association between total T and MetS, in a way that as total T increased the number of subjects with three or more components of the MetS decreased. The most frequent MetS component among the whole population included in this study was hypertension, followed by high TG and WC Total T levels were negatively correlated with BMI, WC, fasting glycemia, and TG. HDL-c was positively associated with total T, but no association with hypertension was found [Citation50].
In Germany, Haring et al. [Citation51] performed a populational-based prospective cohort study with 1004 adults men aged from 20 to 79 years (mean age 51.3 ± 16.6) over a follow-up time of 5 years. They investigated the association between total T and dehydroepiandrosterone sulfate (an adrenal androgen) with MetS components. Sociodemographic and behavioral characteristics were assessed by interviews and biometrical and biochemical parameters were also measured. A total of 47.8% of the men included in the study had MetS and low total T was predictive for MetS, even after adjustment for sociodemographic and behavioral variables, especially among men aged 20–39 years, but also in older ones. There was a trend of increased risk of incident MetS with decreasing levels of dehydroepiandrosterone sulfate, but after adjustment for variables as age, smoking, alcohol consumption, physical activity, and self-related health the association was no longer consistent, indicating that this adrenal androgen is not associated with MetS [Citation51]. In contrast, in the study of Rotter et al. [Citation52], in which the dehydroepiandrosterone sulfate was also verified, a significant negative correlation with WC and dehydroepiandrosterone sulfate was found in a population of 455 Poland men aged between 50 and 75 years (mean age 62.83 ± 6.57), indicating that abdominal obesity may contribute to the reduction of this hormone. T deficiency syndrome (low total T associated with sexual symptoms) was found in 40% of the subjects and all obesity-related measured variables (BMI, waist to hip ratio, visceral adiposity index, lipid accumulation product and WC) were negatively correlated with total T levels, with special emphasis to the visceral adiposity index, which was the strongest predictor of low total T among this population of non-diabetic aging men. SHGB levels were also assessed and did not show significant associations with the obesity indicators, while free T levels were not calculated [Citation52].
The strong association between visceral adiposity and low total T was also evidenced by a cross-sectional study of Blaya et al. [Citation32] with 143 non-diabetic men older than 40 years (mean age 61.4 ± 8.61) in Brazil. The results showed that 47.9% of the subjects had MetS (criteria of AHA), and the proportion of subjects with MetS was higher among those with low total T. WC was the individual component that had the strongest correlation with low total T, reinforcing the complex correlation between androgens, abdominal obesity, and MetS.
In the cross-sectional survey of Ugwu et al. [Citation53], clinical and biochemical analysis were performed in 200 men aged between 32 and 69 years (mean age 57.99 ± 8.76) in Nigeria. The aim was to determine the prevalence of T deficiency and its clinical signs in men with type 2 diabetes. They found that 29.5% of the subjects had hypogonadism (defined as low total T associated with a positive score in the androgen deficiency in aging male (ADAM) questionnaire), of which 76.3% were consistent with hypogonadotropic hypogonadism. LH and FSH levels were significantly lower in hypogonadal than eugonadal subjects, suggesting an association between the anterior pituitary gland and hypothalamus dysfunction on type 2 diabetes-associated hypogonadism. Low total T was associated with ED and low libido. Older age and higher WC were predictors for hypogonadism in this study [Citation53].
Regarding sexual dysfunction and its association with MetS, Tan et al. [Citation54] made a cross-sectional community-based study with 1046 multi-ethnic Asian men aged 40 years and above (mean age 55.8 ± 8.4). By interviewing the subjects and measuring biochemical parameters, the authors aimed to examine the complex association between ED, T deficiency syndrome, and MetS (criteria of IDF). The study showed that 31% of the population had MetS, 16% had low total T and the prevalence of moderate to severe ED was significantly higher among them in a way that ED was associated with MetS and several of its components (high WC, fasting glycemia, dyslipidemia, and hypertension). These findings lead the authors to conclude that there is a strong association between low total T, ED, and MetS. Besides the implications of the ethnicity on the risk to develop these conditions, most of MetS components were independently associated with low T levels. Some components such as high blood pressure and elevated fasting glycemia were found to be good predictors for ED [Citation54]. Similar results were reported by the longitudinal study conducted over five years with 167 men aged from 42 to 78 years (mean age 58.4 ± 6.6) with abdominal obesity in Slovakia by Fillo et al. [Citation55]. The incidence of ED, T deficiency, MetS and the prevalence of morbidity at different levels of circulating T was investigated. Anthropometric, hormonal and urological parameters were collected and MetS was found in 61.7% of the subjects (according to NCEP criteria), while 73.1% had ED, 68.9% had low total T and 46.7% had T deficiency syndrome (association of age over 40 years, decreased libido and at least other three clinical signs of T deficiency). There was a higher prevalence of type 2 diabetes, hypertension, elevated HDL-c and TG levels among the subjects with total T levels below 10 nmol/l when compared with those with total T levels over 14 nmol/l, suggesting that the level of 14 nmol/l is the minimum required for proper energy metabolism in men. Among the comorbidities investigated, three major risk factors for MetS development and cardiovascular disease were elevated TG, low HDL-c, and obesity [Citation55].
In the multicentre cross-sectional study conducted in Spain by García-Cruz et al. [Citation56] with 999 men (61.2 ± 8.1 years old), anthropometric, and biochemical measurements allowed to investigate the association between the presence and the severity of T deficiency symptoms and MetS. About 80% of the subjects had low total T, and 69.6% had MetS (defined according to the harmonized criteria [Citation24]). The percentage of subjects with MetS was even higher (75.3%) among the subjects with moderate and severe aging male symptoms. The ED was found in 97.4% of the subjects and half defined it as moderate or severe, while 35.5% of the population had central obesity. The aging male symptoms were reported by 94.8% of the subjects, mainly sexual symptoms. After adjusting for the severity of aging male symptoms, the central obesity was defined as the main determinant risk factor for MetS, more predictive than severe and moderate ED. Among the aging male symptoms nervousness, physical exhaustion/lacking vitality, and sleep problems mildly increased the probabilities for MetS in multivariate analysis [Citation56].
In the study of Kwon et al. [Citation57] the analysis about total T and metabolic changes were coupled analysis with a variable that can predict cardiovascular disease. They performed a cross-sectional study with 935 Korean men with a mean age of 57 years, with available data about total T levels and carotid duplex ultrasound. MetS (NCEP criteria) was found in 39.4% of the subjects. The mean total T was significantly lower in subjects with MetS, even after adjusting for age. The analysis of the association of total T and MetS with mean carotid intima-media thickness, which is a widely used predictor of cerebral vascular and cardiovascular events, revealed that they were independently associated with each other. This association suggested that carotid artery disease, hypogonadism, and MetS are not separate diseases in aging men. An important factor that could be behind this intricate relationship is inflammation promoted by some cytokines, which are frequently elevated in subjects with obesity and MetS [Citation57,Citation58]. The specific relevance of MetS, but also of age for carotid arterial wall changes was also evidences by the cross-sectional study of Kawada et al. [Citation59], in which the role of C-reactive protein (CRP), components of MetS, and aging in the maximum intima-media thickness was investigated. A total of 761 Japanese men aged between 28 and 87 years were included in the study, and 28% were classified with MetS (according to criteria of Joint Scientific Statement [Citation24]). When compared with men without MetS, the mean age was higher among those with MetS (50.1 ± 9.1 vs. 46.9 ± 8.9 years), as well as the CRP levels and the maximum intima-media thickness. Both the right and the left maximum intima-media thickness increased as the number of MetS components increased, and the age was the most significant predictive variable of the maximum intima-media thickness of carotid arteries. However, MetS components as elevated blood pressure, WC, HDL-c, as well as CRP levels also exerted an impact on early carotid atherosclerosis development. Even though no cause-effect relationship could be concluded from this study, the CRP levels and some components of MetS were highlighted as important markers of early atherosclerosis in men [Citation59]. T levels were not determined in this study.
Concerning the apparent influence of specific inflammatory cytokines, the need for further investigations was underlined by the study performed by Angelova et al. [Citation33] in Bulgaria, which focused on the link between total T, MetS and IL-18. In a population of 218 men with MetS the total T and IL-18 levels were measured, while 33 healthy men were used as controls. Most of the subjects with MetS had type 2 diabetes (87%), hypertension (81.6%), and lipid disorders (75%), while low total T was found in 38.5% of them. Regarding the IL-18 levels, the subjects with MetS had higher IL-18 levels compared to the healthy control group, but no significant difference on IL-18 levels was found between the subjects with MetS associated with low total T compared to those with MetS and normal total T. In this study eight subjects were treated with T for three months and IL-18 levels were not modified [Citation33]. Nevertheless, there are studies showing that T may have anti-inflammatory effects in vivo, once T deficiency was associated with increased inflammatory cytokine levels, and TRT reduced inflammatory cytokine in some cases (reviewed in [Citation60]). Despite this, the significance of the anti-inflammatory effects of T is debatable, because similar to the study of Angelova et al. [Citation33], others showed a non-significant link between T and other inflammatory cytokine and inflammation markers [Citation60–63].
Overall, several evidences support the association between lower total T and MetS. The age of the subjects in the studies showing, as well as their ethnic origin is variable, but total T levels certainly deserves attention when attempting to prevent metabolic disturbs in men. Further multiethnic large studies controlling aspects as eating behavior and sedentarism may help to understand how strong this association is, and if it depends on lifestyle relevant for MetS development. Several studies included free T levels in their analysis, mainly by calculating it from total T and SHBG levels. In what follows, these we review these studies to verify if similar association as those reported for total T are also found for free T.
In the population-based observational cohort study of Kupelian et al. [Citation30], 950 randomly selected American men aging from 40 to 70 years (mean age 52.9 ± 8.3) were observed at three time points over a period of 15 years, to verify the association between T deficiency and the subsequent development of MetS. Free T was determined using Vermeulen’s method [Citation64]. It was found that total T, as well as SHGB levels are inversely associated with the risk of MetS, and this association was dependent on BMI, since stronger association was observed for men with BMI below 25 mg/Kg2. No association between free T and MetS was found. It was suggested that elevated adiposity is a dominant risk factor for developing MetS, although non-obese men with low SHGB or low total T had 2- to 4-fold increased risk of developing MetS. This study also founded that age at baseline was not associated with the incidence of MetS, while a worse self-report health was a good predictive of MetS development [Citation30].
In a population of men within similar age range (40–70 years) in Latvia Erenpreissa et al. [Citation65] investigated, in a prospective study, the prevalence of T deficiency in men with and without different chronic diseases. In this study not only total T, but also free T, were directly measured, both by an immune-fermentative method. A total of 1222 men were included in this study, among which 32.9% were considered healthy and 67.1% had different morbidities, including dyslipidemia (55.7%), obesity (33%), and hypertension (22%). MetS were diagnosed in 11.4% of them, according to the criteria of Joint Scientific Statement [Citation24]. The T deficiency was found in more than half of the population (55%), from which the majority (97.2%) had co-morbidities. Not all the subjects that had low total T also had low free T and vice versa. For example, out of 650 men with co-morbidities and T deficiency, 9.5% had decreased free T (free T ≤ 72pg/mL), but normal total T (total T ≥ 3.46 ng/mL) [Citation65]. Although no explanation in this regard is made in this specific study, it is known that free T concentrations will vary depending on the concentration of SHBG.
In a population of Asian men aged 70–92 years (78.8 ± 4.1), a cross-sectional analysis made by Tang et al. [Citation48] evaluated the relationship between MetS and T levels. The authors also focused on the correlation of T deficiency with clinical characteristics, metabolic disturbs and chronic diseases. MetS (NECP criteria of for Asians) was present in 26% of the subjects. This percentage of MetS was attributed to the high incidence of hypertension and hyperglycemia, more than obesity. Total T levels were inversely correlated with MetS, and among the subjects with low total T (0.69–12.13 nmol/L) the percentage of MetS was 35.3%, against 14.4% in the group with higher total T levels (over 17.33 nmol/L). The same correlation failed to be reproduced with free T results, which were calculated according to Nanjee-Wheeler’s method [Citation66]. Correlation analysis revealed that lower T levels were associated with central obesity markers (high BMI, waist to hip-ratio and body fat percentage), insulin resistance (high fasting glycemia, insulin and glycated hemoglobin levels) and risk for cardiovascular disease (high TG and low HDL-c). Nevertheless, multiple linear regression only showed independent association with total T for the variables BMI and fasting glycemia. It was concluded that total T was a better predictor than free T to estimate the risk to develop MetS in elderly men [Citation48].
Further emphasis on the links between T levels and lipid profiles were given in the epidemiological study of Jiann et al. [Citation67]. They considered the food status in their study by splitting the results in two groups: data collected from subjects who had eating nothing 8–11 h before blood drawn were placed in the fasting group (n = 562, mean age 58.5 ± 11.2 years) and the others were in the non-fasting group (n = 294, mean age 62.7 ± 12.4 years). Blood samples were collected from a total of 856 Taiwanese men, and besides the lipid profile, they measured total T and SHBG while free T and bound T were calculated according to Vermeulen’s method [Citation64]. The fasting and non-fasting groups were not randomized, and some differences existed between them for total T, free T and bound T levels, which were higher in the fasting group, and SHGB was higher in the non-fasting group. This difference in SHGB disappeared after adjusting for age, BMI and albumin levels. SHBG levels were positively correlated with total T and negatively correlated with bound T and free T. The distribution of plasma lipids by quartile total T and free T levels indicated that higher total T and free T levels were related to lower TG, with greater magnitude in the non-fasting group. Such results on postprandial TG were considered a positive effect of T for the cardiovascular system. The plasma lipids were also distributed according to quartiles of SHBG and the TG levels decreased as the SHBG increased in the same magnitude in the fasting and non-fasting groups. The analysis for HDL-c showed that higher total T, free T, and SHBG quartiles were related to higher HDL-c. The magnitude of this positive association was greater in the fasting group for total T and SHBG and in the non-fasting group and for free T. Further statistical adjustments were performed for HDL-c to consider the TG levels and the positive associations were all weakened. When the LDL-c was distributed by quartiles of T, higher total T was related to higher LDL-c in the fasting group. The net effect of T on HDL-c and LDL-c counterbalances each other and was considered neutral for cardiovascular disease [Citation67].
In a cross-sectional study with men aged 40–79 years (mean age 59.15 ± 10.82) Tajar et al. [Citation68] investigated the association between hypogonadism and pertinent metabolic and physiological alterations. Among the 2966 subjects included in this study 2.1% had low total and free T (calculated according to Vermeulen’s method [Citation64]) associated with at least three sexual symptoms (hypogonadism). Irrespective of sexual symptoms about 12.7% of the population had low total T, while the proportion of those with low free T that had less than three or no sexual symptoms was not reported. The subjects with hypogonadism were among the oldest ones and had higher BMI, WC, TG and levels HOMA-IR and lower HDL-c when compared with the eugonadal subjects (normal T levels and less than three sexual symptoms). A considerable part of the men with hypogonadism had type 2 diabetes, cardiovascular disease and MetS (NCEP citeria). The subjects with hypogonadism were divided in to two groups according to total T levels, defined as moderate hypogonadism (total T between 11 and 8 nmol/L) and severe hypogonadism (total T lower than 8 nmol/L) and only men with severe hypogonadism showed significant associations with larger WC, insulin resistance and MetS after adjustments for confounders. The levels of LH and FSH were also measured and they were higher in both groups of subjects with hypogonadism than in eugonadal, while SHBG and E2 levels were lower only in the subjects with severe hypogonadism, indicating that the degree of T deficiency may influence relevant metabolic and biochemical features that influence the MetS development [Citation68].
Regarding the disturbs on glucose homeostasis, Ho et al. [Citation69] performed a cross sectional study in Taiwan with men diagnosed with type 2 diabetes, including 105 men aged 61.2 ± 6.8 years that were newly diagnosed and 81 men aged 57.8 ± 8.8 years that already had type 2 diabetes diagnose for more than 24 months. The aim was to investigate the prevalence and the risk factors of T deficiency in such population. They found that MetS (according to NCEP criteria for Asian men), obesity, elevated TG levels and other metabolic disturbs were common features among individuals with type 2 diabetes. Free T was calculated (Vermeulen’s method [Citation64]) and the values did not differ between the two groups of diabetic men. The percentage of low total T was higher than low free T in both groups, while a better glycemic control was associated with higher levels of total T and a lower prevalence of low total T, but not with free T or SHBG levels. Overall, risk factors for low total T in men with type 2 diabetes were high levels of glycated hemoglobin, TG, uric acid, low SHBG, obesity and MetS and high PSA was associated with lower risk of T deficiency [Citation69].
In a cross-sectional study made by Agarwal et al. [Citation70] with 900 Indian males aged between 30 and 59 years (mean age 45.2 ± 8.14), also with type 2 diabetes, the prevalence of hypogonadism was investigated by surveys and biochemical measurements, but besides measuring LH, FSH and total T, the levels of SHBG and free T were also determined (no details on the technique used to measure free T was provided). The definition of hypogonadism was similar to the study of Ugwu et al. and the percentage was 20.7%, with higher prevalence among the older subjects (50–59 years), but among the subjects with hypogonadism only 7.53% were compatible with hypogonadotropic hypogonadism and 25.8% were considered of the hypergonadotropic type [Citation70]. This difference relies on the fact that in the study of Ugwu et al. the subjects with normal LH and FSH levels were classified as hypogonadotropic [Citation53]. If we consider the 66.67% of the subjects in the study of Agarwal et al. that had normal FSH and LH levels, despite having low total T the percentage of hypogonadotropic hypogonadism is similar between the two studies. Nevertheless, the definition for the hypogonadotropic hypogonadism used by Agarwal et al. seems more accurate [Citation71] than that of Ugwu et al. So, the suggestion that type 2 diabetes-associated hypogonadism is mainly due to anterior pituitary gland and/or hypothalamus dysfunction requires further investigation. In the study of Agarwal et al. the hypogonadism showed important correlation with age and BMI and the authors conclude that the diagnosis for hypogonadism and proper medical assistance is crucial for adequate management of type 2 diabetes [Citation70].
In the retrospective cross-sectional study of Souteiro et al. [Citation34] the prevalence of T deficiency was investigated in a population of obese men (n = 150, mean age of 41.5 ± 10.9 years) in Portugal, and the impact of hyperglycemia and insulin resistance on free T levels (calculated according to Vermeulen’s method [Citation64]) were also considered. The T deficiency was found in 52% of the subjects when total T was considered and when free T was the criteria T deficiency was found in only 17.6% of the subjects. In both cases, most of the subjects (over 95%) had hypogonadotropic dysfunction, but again, here, subjects with low and with normal levels of LH and FSH were considered hypogonadotropic. The difference on the percentages of subjects with low T when total T and free T were considered was attributed to the low SHBG levels in obese subjects (SHBG levels were negatively correlated with BMI). Total T levels were negatively correlated with BMI, weight, WC, TG levels, fasting insulin levels and HOMA-IR, while free T did not correlate. The insulin resistance was a main determinant of T deficiency, suggesting that somehow insulin resistance can supress T production. SHBG levels were positively associated with age, but not with glycemic control and insulin resistance parameters and low SHBG was associated with low free and low total T, even after adjusting to HOMA-IR [Citation34], which challenges the hypothesis that high levels of insulin supresses hepatic SHBG production [Citation72], but instead it would be regulated by other factors usually present in subjects with insulin resistance as hepatic steatosis, proinflammatory cytokines and even the elevated ingestion of some dietary components, including carbohydrates and fatty acids (reviewed in [Citation73]). These factors were not considered in the study of Souteiro et al. [Citation34].
The study of Goncharov et al. [Citation74] tested 60 overweight men, aged between 20 and 40 years to determine whether they would be classified as having MetS using three the criteria: NCEP, WHO and IDF. Even though these criteria overlap in some aspects, they differ in the emphasis given to the different MetS components and consequently on the classification they provide. According to the criteria of NCEP 56.7% of the population of this study had MetS, while according to IDF the percentage was 45% and according to the criteria of the WHO it was 38.6% and 31.6% were not classified with MetS despite being overweight. This study also analyzed the relationship between a positive classification for MetS and total T and calculated free T (according to Vermeulen’s method [Citation64]), which were consistently lower in the subjects with MetS. These results showed that the criteria applied to classify MetS may lead to different results, but low levels of total T and free T were consistent features regardless of which definition that had been applied [Citation74].
Aiming to better understand the association between the free T and MetS, Katabami et al. [Citation75] made a cross-sectional survey with 274 Japanese adult males with mean age of 49.0 ± 11 years. Here free T was not calculated, but instead it was directly measured by immunoassay, while total T and SHGB was not determined. It was found that 25.5% of the subjects had MetS, among which significant decreased free T levels were detected. The authors concluded that among Japanese males free T levels were associated with MetS, independently of other variables, including age, BMI and WC. The higher incidence of low free T levels among the subjects with MetS was partially attributed to a vicious cycle in which T levels may be further reduced by MetS and insulin resistance via primary hypogonadism and/or hypogonadotrophic hypogonadism, as suggested by the lack of significant elevation of the LH and FSH levels in the subjects with low free T [Citation75].
In general, cause and effect relationship of free T and MetS seems more controversial than that of total T and MetS, but still several evidences on free T and metabolic impairments association can be found. The fact that usually the studies perform only single measure of T may be a relevant question for this apparent controversy. Besides, not all studies controlled for potential confounder factors such as eating behavior, physical activity, alcohol drinking, smoking, drug abuse, medical treatments and others. Clinical studies controlling for such variables and performing several T measurements over a considerable period of time may be important to understand and clarify the remaining questions on free T and its importance for the occurrence of metabolic disturbs in men.
The influence of testosterone deficiency on hepatic steatosis in men
The hepatic steatosis not related to abuse of alcohol or NAFLD is often considered as the hepatic component of the MetS. The studies that have focused on the NAFLD in the context of T deficiency in humans mainly used indirect approached to measure the liver lipid content. We review these studies to verify if T deficiency per se is associated with NAFLD, and to understand how possible hepatic lipid accumulation induced by T deficiency relates with MetS and how this hepatic disturb can affect other MetS components. The transversal study of Barbonetti et al. [Citation76] was done with 55 Italian men, aged 46.6 ± 17.3 years, who had chronic spinal cord injury. A total of 49.1% of the subjects had NAFLD, diagnosed by ultrasonography. The subjects with NAFLD were older and exhibited higher BMI, insulinemia, HOMA-IR, TG levels and gamma-glutamyl transpeptidase, and lower total and free T levels when compared with the subjects without NAFLD. Logistical regression analysis indicated that NAFLD was independently associated with low total and free T and the authors suggested a direct link between low T levels and fat accumulation in the liver, considering that the correlation persisted even after statistical adjustment for the effect of BMI, insulin resistance and inflammatory status. A limitation of this work was that although the method for identifying the fat infiltration in the liver the non-invasive, the ultrasonography is not the gold standard for detecting hepatic steatosis [Citation76].
In the study of Hasanain et al. [Citation77] the NAFLD was also diagnosed through ultrasonography, and the possible association with history of alcohol consumption, exposure to steatogenic medications and viral hepatitis B or C were excluded. This study was conducted in Egypt with 192 men (mean age of 42.4 ± 7.7 years), all with NAFLD, and the aim was to investigate the association between ED and NAFLD. Almost half (48.8%) of the subjects had ED. An Arabic version of the International Index of Erectile Function (IIEF-5) was used to detect ED and to determine its severity. From those with ED, 31% had mild to severe grade, 38% mild grade and 22% moderate grade. Univariate analysis comparing the subjects with and without ED and showed that ED in this population of men with NAFLD was associated with age of 40 years or more, smoking, obesity, abdominal obesity, type 2 diabetes, insulin resistance and low total T (below 6.24 nmol/L). Multivariate analysis showed that age of 40 years or more, insulin resistance and low total T were independently associated with ED. The small sample size and the lack of E2 level estimation were the main limitations of this study [Citation77].
Seo et al. [Citation78] also used the ultrasonography to analyze NAFLD and investigated its relationship with total T levels. The results revealed that among the population of 1944 Korean men, 44.3% of subjects were diagnosed with NAFLD (alcohol consumers were excluded from the study). Higher level of total T lowered the prevalence of NAFLD, and lower levels of total T were found in subjects with NAFLD. Longitudinal analyses indicated that higher levels of total T were associated with NAFLD, but after adjusting to influence of body weight, the results indicated that total T did not influence the development or regression of NAFLD at the median 4.2 years follow-up [Citation78]. Also in Korea, ultrasonography associated with computed tomography was also used to analyze the NAFLD in the retrospective observational cross-sectional study of Kim et al. [Citation79]. The study included 495 men who were at least 20 years of age and aimed to investigate the association between total T levels and NAFLD. After adjusting the data for the influence of visceral adiposity and insulin resistance, the results showed higher risk for NAFLD in men in the low total T than men with higher levels of total T [Citation79].
In the study of Yang et al. [Citation80] total T and calculated free T (according to Vermeulen’s method [Citation64]) were analyzed in 218 men in China, and the NAFLD (assessed by ultrasound) and was found in 39.44% of them, which were younger (49.62 ± 7.89 vs. 54.08 ± 10.66 years) and had higher mean BMI and WC than those without hepatic steatosis. Total T and SHBG levels were lower in the subjects with hepatic steatosis, while free T was not different. Logistic regression analysis showed that total T and SHBG were protective factors for hepatic steatosis, but free T was not correlated with NAFLD [Citation80]. The results with SHBG reinforces the knowledge that liver fat accumulation may reduce SHBG synthesis and release [Citation73] and therefore may have important consequences for T levels and metabolic aspects affected by changes in free T.
Regarding the TRT, the randomized placebo-controlled trial of Hoyos et al. [Citation81] investigated its effects on hepatic adiposity and other metabolic parameters in a population of 67 obese men with severe obstructive sleep apnea. The TRT consisted of injections of 1000 mg of TU (n = 33) or placebo (n = 34) for 18 weeks and liver fat was estimated by analysis of computerized tomography slices. Liver fat was reduced by TRT and other parameters as insulin sensitivity and muscle mass were increased in the subjects that received TRT to a greater extent than placebo [Citation81].
Clinical studies screening large number of individuals for NAFLD, also using some emerging non-invasive imaging diagnostic modalities [Citation82], and combining its results with T measurements may enrich our current knowledge on the association between T deficiency and NAFLD.
Studies that investigated the effects of testosterone replacement therapy and metabolic parameters in men
Considering the evidence that T deficiency increases the incidence of MetS, it would be expected that testosterone replacement therapy (TRT) would alleviate MetS. We review the studies that tested TRT in men with low T levels to verify how efficient TRT is to treat or prevent MetS, its possible side effects on metabolic disturbs and to collect further evidences on the cause and effect relationship between T and MetS. Jeong et al. [Citation31] performed an investigation on the effect of TRT in 200 subjects with mean age of 57 years who were diagnosed with T deficiency syndrome (defined here as total T lower than 12 nmol/L) and were undergoing TRT along a period of 3 years. In this study, 71 subjects (39.5%) were diagnosed with MetS (NCEP criteria for Asians) and 129 (160.5%) without Mets. TRT (intramuscular injection of 1000 mg of testosterone undecanoate (TU) at an interval of 10–14 weeks) promoted beneficial effects over WC and fasting glycemia for both groups, while total cholesterol and LDL-c were significantly reduced only in the group without MetS. It was concluded that TRT in subjects without MetS was able to improve fewer more serum variables than TRT in subjects with MetS, suggesting that the correction of MetS-related complications as type 2 diabetes, obesity and hypertension might be important to improve the beneficial effects of TRT over lipid profile, aging male symptoms and sexual dysfunction [Citation31].
In a study done by Saad et al. [Citation83] with 21 subjects aged 54–76 years (mean age 64) with low T levels and diagnose of MetS (IDF criteria) the authors observed that men with sexual disfunction often suffer from MetS. The effects of 12 months administration of 1000 mg of TU (injected at baseline, 6 weeks after and thereafter every 12 weeks) over metabolic parameters were explored and it was found that despite of the modest decline on body weight, there was positive effects over WC, blood pressure, cholesterol and TG levels. Interestingly, SHBG levels felt over the first six months of the treatment with parallel rise of calculated free T (according to Vermeulen’s method [Citation64]) and SHGB raised after, when the hyperinsulinemia was reduced. It was suggested the analysis of SHBG levels as indicator of the degree of hyperinsulinism and of the severity of the MetS [Citation83]. Unfortunately the hepatic lipid content was not evaluated here, which could be a help to explain SHBG changes, as previously discussed [Citation73]. Aspartate aminotransferase, alanine aminotransferase and gamma-glutamil transferase activities were measured but did not show significant difference. The subjects in this study had no changes on diet or exercise routine [Citation83].
The study of Singh et al. [Citation84] investigated T deficiency and the effects of TRT (TU 40 mg twice a day for 3 months) on MetS-related parameters in Indian men. The population of the study was formed by 32 health men with mean age of 34 ± 6.75 years (control group) and 63 men with MetS (IDF criteria for south Asian Indian ethnicity) with mean age of 35.29 ± 8.16 years. The subjects with MetS had higher BMI, WC, blood pressure, fasting glycemia, insulinemia and HOMA-IR. Only HDL-c was significantly lower in the subjects with MetS in comparison with those without. The levels of total T, SHGB and calculated free T (according to Vermeulen’s method [Citation64]) were all significantly lower in the subjects with MetS. Hypogonadism, defined as free T lower than 0.225 nmol/L, was found in 30% of the subjects with MetS while in those without MetS percentage was 3.1%. Multiple regression analysis revealed that free T strongly and directly correlated with total T and inversely correlated with age, HOMA-IR and SHBG levels. The subjects with MetS were further divided in eugonadal (n = 44) and hypogonadal (n = 19) for comparisons and the age, SHBG and insulin levels, and HOMA-IR were all higher in hypogonadal subjects. TU was administered for some of the subjects with hypogonadism and MetS (n = 13) and it was able to reduce not only body weight and WC, but also blood pressure, fasting glycemia, TG, insulinemia, HOMA-IR, and SHBG levels, while total T was increased. It was concluded that restoring T levels to normal range by TRT can ameliorate some of the alterations that favours insulin resistance and has the potential to reverse MetS in men with hypogonadism [Citation84].
Another study that reported beneficial effects of TRT on the components of the MetS was performed by Traish et al. [Citation85] with 255 men with mean age of 58 ± 6.3 years who sought urological consultation due to T deficiency symptoms. Of the total population included in this study, few (n = 11) did not had MetS (“reconciled” definition by IDF and AHA). All 255 subjects were followed up for at least 1 year and 116 for 5 years. TRT (1000 mg of TU injected at baseline and 6 weeks and thereafter every 12 weeks for up to 60 months) increased HDL-c, while body weight, WC, total cholesterol, LDL-c, TG, CRP, fasting glycemia and blood pressure were reduced. The activities of aspartate aminotransferase and alanine aminotransferase were lowered by the treatment, suggesting not only reduced inflammatory response, but also improvements in liver function [Citation85]. These results are in contrast with the study of Saad et al. [Citation83] in which comparable TRT did not modified the activities of these enzymes. The reduction in CRP by the TRT is also interesting, especially considering the study of Kawada et al. [Citation59] in which this indirect inflammation marker was not only associated with MetS, but also with markers of early atherosclerosis. The reduction of the TG, remarkable on the first year of the treatment, and that remained low after 60 months, could help to explain the reduction in body weight and WC after TRT, as the visceral fat storage is determined, among other factors, by the TG availability for accumulation. Also, the TRT led to a sustained reduction on glycemia, probably due to improved insulin sensitivity and glucose utilization. As a conclusion this study indicated that long-term TRT produces important clinical benefits and ameliorates MetS [Citation85]. The same research group performed observational, prospective, cumulative registry studies [Citation86,Citation87] with American men (n = 656, mean age: 60.7 ± 7.2 years) with total T levels ≤12.1 nmol/L and symptoms of hypogonadism to evaluate the effects of long-term TRT on total T levels, body weight, WC, BMI, fasting glycemia, blood pressure, lipid profile and other variables, including prostate volume and prostate specific antigen. They also applied questionnaires about aging related complications and urinary and sexual functions. A total of 360 men received TRT (1000 mg of TU injected at baseline and 6 weeks and thereafter every 12 weeks for up to 10 years) and the control group (n = 296) were formed by the subjects who opted against the treatment. The two groups were compared in terms of changes from baseline and the authors used propensity matching analysis to account for differences in baseline characteristics between groups (n = 82 per group). Their results showed that treatment was able to restore total T levels within the physiological range during the first year, remaining in this range over the follow up years. The analysis of the anthropometric parameters revealed that the TRT led to a sustained weight loss, reduction in WC and in BMI, while the untreated group showed a slight weight gain, increasement in WC and BMI. The treatment also reduced glycemia, blood pressure and improved the lipid profile by increasing the HDL-c and reducing LDL-c and TG, leading to the conclusion that long-term TRT in men with hypogonadism represents an effective approach to improve anthropometric parameters and the cardiometabolic function. In the publication that reported the results regarding the prostate volume and prostate specific antigen, urinary and sexual functions and other age-related complications the results indicated that TRT was also beneficial [Citation87].
Groti et al. [Citation35] studied the effects of TRT on glycemic control and components of MetS, including parameters of insulin resistance and body composition in obese hypogonadal men with type 2 diabetes. They performed a one-year, double-blind, randomized, placebo-controlled study with a total of 55 men (60 ± 7.23 years) who had hypogonadism (total T below 11 nmol/l associated with 3 or more sexual symptoms) and BMI above 30 kg/m2 and who were treated with oral antidiabetic medication. Surprisingly, both placebo and treated groups showed significant reduction on body weight and WC, which the authors attributed to a possible general positive effect on lifestyle by the subjects upon the participation on the study. Nonetheless, the group that received TRT (1000 mg of TU injected at baseline and 6 weeks and thereafter every 10 weeks for 12 months) showed clinical benefits including better glycemic control, less insulin resistance and better endothelial function after one year of TRT [Citation35].
The potential beneficial effects of TRT may not be achievable in all cases of hypogonadism, as indicated by the randomized-controlled trial of Huang et al. [Citation63], which investigated the effect of TRT in subjects that were chronically using opioid for pain and who had a morning total T lower than 12 nmol/L, characterizing the opioid-induced hypogonadism. In these subjects (mostly obese) TRT (5 g of transdermal T gel once daily) was not associated with relevant changes of metabolic parameters (BMI, lipid profile and insulin resistance indicators) after 14 weeks therapy, even though the levels of total and free T were significantly increased [Citation63]. Maybe the period of intervention was also not long enough to see significant changes, and there is still debate on required duration of TRT for aging male with hypogonadism and signs and metabolic disturbs. The study of Yassin et al. [Citation88] investigated the effects of long-term TRT and TRT withdrawal on obesity and prostate-related parameters. A population of 262 hypogonadal subjects (mean age 59.49 ± 8.72) that received TU in 12-week intervals for a maximum of 11 years was divided in two groups: one had TRT interrupted for a mean of 16.9 months and resumed thereafter (n = 147) while the other was treated continuously (n = 115). Despite being an observational study with no placebo-controlled group, their results showed that WC was greatly reduced following TRT in both groups. During the interruption of the TRT the WC was increased but decreased again after TRT was restarted. The same pattern of response was observed for body weight and BMI. Regarding the prostate-related parameters, prior to interruption, TRT resulted in improvements in erectile function and prostate symptoms, while prostate volume and PSA were increased. When the TRT was interrupted erectile function and prostate symptoms score worsened, while PSA decreased [Citation88]. With these results it was showed that long-term TRT improves most of the measured parameters related to obesity and prostate, suggesting that men with hypogonadism may require lifelong treatment to maintain the observed benefits and this treatment should include not only proper TRT, but also attention to indicators of prostate health.
Besides TRT, other strategies have been tested as alternative or complementary therapies to treat metabolic disturbances in men with hypogonadism, as the aromatase inhibitor (anastrozole) investigated by Dias et al. [Citation89] in a randomized double-blind, placebo-controlled, parallel-group, proof-of-concept trial with 29 male with low total T and older than 65 years (mean age 71 ± 3 years). Metabolic variables were assed at baseline and after 12 months of treatment. While TRT (5 g of transdermal T gel) reduced subcutaneous fat, the treatment with aromatase inhibitor reduced subcutaneous and visceral fat compared with placebo, but neither TRT nor aromatase inhibitor were able to affect fasting glucose and insulin levels after 12 months of treatment. It was concluded that more trials are required before the aromatase inhibitor is considered as a treatment option for older men with low T levels [Citation89].
Other alternative treatment that have been considered is the vitamin D. Canguven et al. [Citation90] investigated the effects of a monthly high dose of vitamin D treatment for 12 months in middle-aged men (53.2 ± 10.5 years) with vitamin D deficiency over sexual hormones levels, MetS components and erectile function. A total of 102 subjects were analysed and after determining that the vitamin D doses were working in the expected manner by measuring its serum levels, the authors found that total T was increased, estradiol levels decreased, and erectile function scores improved. Regarding the anthropometric and metabolic parameters, vitamin D treatment decreased the mean BMI, HbA1c, TG, and LDL-c. Despite these apparent beneficial effects, the PSA levels were increased after the vitamin D treatment, which could be related to indications of an elevated risk of overall prostate cancer associated with higher vitamin D levels [Citation91]. Despite the seeming beneficial effects of vitamin D supplementation over total T, sexual function and metabolic parameters, more randomized placebo-controlled interventional trials are needed to better understand the putative roles of vitamin D, and that possible adverse effects, including those over prostate diseases, should be carefully assessed [Citation90]. This is true not only for men receiving vitamin D treatment, but in general, for all men with MetS, considering several studies showing that MetS and its individual components, such as dyslipidemia, are related to prostatic hyperplasia [Citation92–96].
In this context, the study of Cakir et al. [Citation95] compared the efficacy of statins and α-adrenoceptor antagonist drug treatments for men with MetS (defined according to NCEP), lower urinary tract symptoms and benign prostatic hyperplasia. A total of 300 subjects were divided into groups according to the treatment they received: only α-adrenoceptor antagonist (tamsulosin), only statin (atorvastatin), or a combination of both, α-adrenoceptor antagonist plus statin. The results for TG, HDL-c, and prostate volume were not significantly different in the group that received only α-adrenoceptor antagonist, while TG and prostate volume were significantly lower in subjects taking statin and the combined therapy. The combined therapy also showed more improvements in International Prostate Symptom Score value compared with both only statin and only α-adrenoceptor antagonist treatments. This study did not evaluate PSA levels. It was concluded that statins were effective in the treatment of benign prostatic hyperplasia in men with MetS, probably due to its lipid-lowering and anti-inflammatory actions and recommended the use of statins when α-adrenoceptor antagonist is ineffective alone. It was also suggested further large scale and comparative studies to obtain more detailed information on this regard [Citation95].
The metabolic alterations that can be experienced by aging male, which apparently is more incident over those with low total T, may resonate on other aspects of aging male physiology and may eventually further compromise their quality of life. In the cross-sectional study of Goh et al. [Citation97], 472 healthy Asian men were studied to examine the association of MetS components and age with short-term memory and perceptual capacity. Hypertension and HDL-c levels did not show important association with memory-related parameters, but others as high fasting glycemia and high total body fat were associated with poorer perceptual capacity and poorer short-term memory, respectively [Citation97]. This illustrates the importance of a multidisciplinary approach to treat aging men with clinical signs of MetS, who should receive counseling and assessment concerning possible T deficiency, but also with attention to possible chances in cognitive performance and memory capacity as part of a more comprehensive and preventive approach.
Considering these studies that investigated TRT effects on MetS-related parameters, it can be concluded that most of them found it beneficial. Many used injections of TU to replace T, but T gel was also tested and even some combined and alternative therapies. Although these studies contributed a lot to advancing our knowledge about the association between T and metabolic disturbs, TRT still should be used with caution and further large randomized placebo-controlled interventional investigations can further reduce the remaining gaps on our understanding about an optimal TRT. Aspects as duration, specific adaptations for groups of men with different features, and possible undesired side effects merit special attention.
Androgen deprivation therapy and metabolic alterations
Androgen deprivation therapy (ADT) is now standard for men with localized, recurrent, and metastatic prostate cancer, and important insights on the association of T deficiency and metabolic changes could be made from recent studies about ADT reporting on metabolic outcomes. Besides orchiectomy, methods of ADT include treatment with GnRH agonists and antagonists, or even androgen receptor-targeted therapies. Some recent studies using these approaches were reviewed to verify how ADT can affect energy metabolism and to search for possible mechanisms underlying the lack of androgen and MetS development. Important side effects associated with ADT were reviewed by Magee and Singal et al. [Citation98], in which weight gain with increased body fat, insulin resistance, and dyslipidemia were highlighted.
In the randomized clinical study performed by Østergren et al. [Citation99], the metabolic consequences of GnRH agonists versus orchiectomy were investigated. A population of 58 hormone-naive men with advanced prostate cancer was randomly assigned to either subcapsular orchiectomy or depot injections of triptorelin (22.5 mg/24 weeks). By following the subjects over 48 weeks, changes in fasting glycemia, body weight, fat mass, visceral and subcutaneous fats, lean body mass, serum lipid profiles, and insulin resistance were found. The orchiectomy group experienced greater increases in body weight, total fat mass, and subcutaneous adipose tissue than did the triptorelin group. Pooled analyses combining data from both groups indicated ADT increases subcutaneous and visceral fat mass, serum cholesterols (total, HDL-c, and LDL-c), and insulin resistance, while lean body mass decreased as compared with baseline values. Also, by analyzing the within-subject correlation coefficients for repeated-measures data, it was found a moderate association for both methods of ADT between the increase in fat mass and subcutaneous adipose tissue and the increase in insulin resistance, which did not give rise to clinically significant changes in mean fasting glucose. However, leptin and adiponectin levels were increased. It was concluded that orchiectomy caused greater increases in fat accumulation compared with GnRH agonists and that these increments were associated with higher insulin resistance [Citation98]. Both forms of ADT caused adverse changes in body composition and increased insulin resistance and serum cholesterols. The rise in leptin was expected, considering the increased fat mass and T deficiency, but the rise in adiponectin levels was unexpected, once it is usually inversely correlated with fat mass. Further studies focusing on these adipocytokines may help to understand their role on metabolic changes observed in a androgen deficiency condition.
Mangiola et al. [Citation100] performed an integrative study of the molecular and cellular changes in adipose tissue microenvironment by evaluating the transcriptional changes in periprostatic fat tissue induced by ADT in subjects with high-risk tumors (n = 11, median age of 65 years) and comparing to a matching untreated cohort (n = 10, median age of 66 years). The ADT consisted of a “supercastration” regimen with subcutaneous administration of degarelix 240/80 mg every 4 weeks; abiraterone acetate 500 mg orally daily titrating upwards every 2 weeks by 250 mg to a final dose of 1000 mg daily; bicalutamide 50 mg orally daily and prednisolone 5 mg orally twice daily for a total of 6 months. Although this study was limited by the lack of orthogonal validation at the protein level, the results showed that several genes being differentially transcribed, mainly involved with hormonal and fat homeostasis, inflammation and neural plasticity. The differential tissue composition analysis showed that this ADT led to a pro-inflammatory adipose tissue microenvironment, as showed by enriched signatures of macrophages, monocytes and granulocytes within the immune cell population in treated subjects compared to untreated ones. Also, obesity transcriptional signature analysis revealed a positive association with ADT, and most of the genes involved in the obesity signature were linked to inflammation, probably due to the significant infiltrating immune cell types within the periprostatic adipose tissue. It is also important to note that the subjects exposed to ADT experienced a 3.3% increase in body weight and BMI from baseline throughout the treatment [Citation100]. Even though this study evaluated only the periprostatic adipose tissue, it suggests that other body fat depots may also undergo major changes in a T deficiency condition. These changes, i.e. obesity and inflammation, are compatible with a worsening of the homeostasis, not only of the adipose tissue, but of the whole body, which can, at least in part, contribute to a poorer metabolic status, and the development of MetS in men with hypogonadism. Other studies, including similar analysis in other fat depots, or even randomized studies with distinct approaches, also the use of animal models, may help to clarify this issue.
Evidences from studies with rodents on the association between metabolic syndrome and testosterone deficiency
The studies with rodents can important insights on the molecular mechanisms related to the changes observed in humans with T deficiency. They can also help to better differentiate between the direct effects of the lack of T and those related to other factors as age and diet. Nevertheless, many of the studies with castrated animals have associated the T deficiency with other challenges, mainly the high-fat diet (HFD). Others showed that T deficiency might have different metabolic consequences in men and rodents. Some of these studies were reviewed.
By using Sprague-Dawley rats with 16 weeks of age, Christoffersen et al. [Citation101] showed that castration affects few biometrical and metabolic parameters. Computed tomography nine weeks after castration revealed that the subcutaneous fat area was increased by castration, but total abdominal and visceral fat were not affected. The fasting glycemia was higher in castrated rats, measured 2 and 10 weeks after castration. Three weeks after castration, some rats were fed a high-fat, high-sucrose diet, but it did not change the effects of castration. It was discussed that if T deficiency (or castration) had the same metabolic consequences in rats as those observed in humans, these animals would develop increased visceral fat mass, decreased glucose tolerance and insulin sensitivity, among other typical features of human MetS. As these features were not seen, this experimental model was not considered an optimal model for studies on the influence of T deficiency on body fat distribution and MetS [Citation101]. In contrast, Xia et al. [Citation39] castrated Sprague-Dawley rats at 10 weeks of age and found after 10 weeks that glycemia and insulinemia were higher in castrated rats compared to control. The experiments in this study were conducted over 30 weeks when the rats were 40 weeks old. In this time point, the mean body weight in the control rats was higher than those in the castrated rats and was attributed to a possible loss of muscle and bone mass. A group of castrated rats also received testosterone propionate via intraperitoneal injection (25 mg/kg/day) for 30 weeks and still had similar body weight to castrated untreated rats. No further explanation for this fact was given but may be related to the fact that the treatment did not restore T to similar levels of those observed in control rats. Glucose tolerance and insulin sensitivity were also verified 10 weeks after the castration. Fasting glucose levels were not affected, neither glucose tolerance, but castration reduced insulinemia in response to oral glucose administration, despite the higher fasting insulinemia, compared with control rats. Insulin tolerance tests showed that castrated rats had less glucose in circulation after insulin challenge. Next, the possibility that castration induced impairment of gluconeogenesis was tested by pyruvate administration, and castrated rats showed higher glucose production, indicating enhanced hepatic gluconeogenesis under T deficiency condition. Furthermore, a lower muscle glucose uptake was showed, suggesting decreased extra-hepatic insulin sensitivity in castrated rats [Citation39]. These conflicting results, when compared with those of Christoffersen et al. [Citation101] attributed to the difference on the age of the animals. Nevertheless, Xia et al. [Citation39] observed changes in insulinemia in response to oral glucose administration after 10 weeks of castration.
Dubois et al. [Citation38] used a high-fat diet associated with T deficiency to investigate the combined effects on glucose homeostasis in C57BL/6J male mice. Two models of androgen deficiency were used, orchidectomy and androgen receptor knockout. The results showed increased adiposity and serum leptin in both mice models of T deficiency. The fat accumulation in the castrated mice was accompanied by sedentary behavior, white adipocyte hypertrophy, lower mitochondrial content (mitochondrial function was not affected), increased lipogenesis, and decreases lipolysis. Both models of T deficiency showed exacerbated glucose intolerance after receiving a high-fat diet, which impaired hepatic and extra-hepatic insulin sensitivity [Citation38]. It was concluded that T deficiency in combination with a high-fat diet increases body adiposity and insulin resistance. The treatment with T, but not dihydrotestosterone, restored the castration effects on body composition and glucose homeostasis. Even though T deficiency per se had no deleterious effects on metabolic parameters, it was shown that metabolic alterations induced by the high-fat diet were exacerbated under T deficiency condition. When translated to humans, these findings reinforce that untreated T deficiency may accelerate the development of MetS in men, although this may be avoided with a healthy diet.
The relation between the higher susceptibly of T deficient rodents to the metabolic effects of a high-fat diet was also evidenced by the study of Harada et al. [Citation37], which showed that castration of C57BL/6J mice combined with a high-fat diet leads to abdominal obesity. This obesity was not observed when mice were treated with antibiotics that disrupt the intestinal microflora. Interestingly, the castration induced visceral fat mass expansion only in the absence of antibiotics in mice fed a high-fat diet, whereas subcutaneous fat mass was increased by castration irrespective of antibiotics. The finding that elevated fasting glycemia levels and increased liver TG levels were only observed in castrated mice fed a high-fat diet lead to the conclusion that T deficiency can alter the intestinal microbiome, and induce abdominal obesity [Citation37]. However, it depends on the diet. Borbélyova et al. [Citation41] investigated the metabolic effects of long-term androgen deficiency, starting before puberty, in middle-aged (18 months) Lewis rats. Androgen deficiency induced by castration (at 21 days of age) did not induce important metabolic changes (elevated blood pressure, hyperglycemia, hyperinsulinemia). Nevertheless, it affected the liver, as showed by higher hepatic TG content, which correlated with higher AST and ALT activities in blood, suggesting partial liver damage. Hepatic cholesterol content was not affected [Citation41].
Major possible mechanisms for exacerbated hepatic TG accumulation can include increased lipid delivery to the liver, increased de novo hepatic lipogenesis, reduced lipid oxidation, and decreased hepatic lipid export [Citation102]. Some studies with rodents provide pieces of evidence that increased de novo hepatic lipogenesis is particularly important for hepatic steatosis pathogenesis during T deficiency condition. Sakr et al. [Citation36] used castrated Sprague-Dawley rats to investigate the effects of T deficiency and T replacement on the development of hepatic steatosis. After 12 weeks of castration, besides higher body weight and adiposity, elevated fasting glycemia and insulinemia were observed [Citation36]. Different from Borbélyova et al. [Citation41], in which hepatic cholesterol content was not affected, in the study of Sakr et al. [Citation36] the castration increased not only the hepatic TG content, but also hepatic cholesterol, and both were restored to normal levels after 12 weeks of T treatment (subcutaneous injection of 0.5 mg/kg of T propionate three times per week). At the molecular level, it was observed higher expression of transcript factors and enzymes related to fatty acids and cholesterol metabolism. The levels of peroxisome proliferator-activated receptor alpha (PPARα), carnitine palmitoyltransferase 1 (CPT-1), and mitochondrial uncoupling protein-2 (UCP-2) were increased in castrated rats [Citation36]. This effect would result in increased fatty acid oxidation and, therefore, lower hepatic lipid content, which is not what was observed in this study. T treatment reduced the level of these proteins. On the other hand, sterol regulatory element-binding protein-1 (SREBP-1), a major transcript factors that stimulate de novo hepatic lipogenesis, had its mRNA and protein levels increased, as well as its target genes fatty acid synthase (FAS), hydroxymethyl glutaryl Co-A reductase (HMG-CoA reductase), and hydroxymethyl glutaryl Co-A synthase (HMG-CoA synthase), in the livers of castrated rats [Citation36]. These genes may play important roles in exacerbating hepatic lipid synthesis and hepatic steatosis development in T deficiency condition, which was also supported by the reduction in SBREBP-1 observed after T treatment [Citation36].
Indications that T affects the expression of enzymes of de novo fatty acids synthesis was also provided by Kelly et al. [Citation103], that investigated the effects of T on diet-induced hepatic steatosis. By feeding testicular feminised (Tfm) mice, which have a non-functional androgen receptor and low serum T levels. Castrated rats showed hepatic steatosis, but when fed with a high cholesterol diet, the hepatic lipid accumulation was exacerbated. T treatment (intramuscular injection of T propionate + T phenylpropionate + T isocaproate) reduced hepatic lipid accumulation. Expression of enzymes related to fatty acid synthesis, acetyl-CoA carboxylase alpha (ACC-α), and FAS was elevated in Tfm mice receiving normal diet in comparison with control, and T treated mice. Also, T treatment reduced the expression of both enzymes, ACC-α and FAS to wild-type levels [Citation103]. This reinforces the suggestion that T may exert its protective effects on hepatic steatosis by affecting hepatic de novo lipogenesis.
In contrast, Nikolaenko et al. [Citation104] also investigated T effects on the pathogenesis of hepatic steatosis in castrated Sprague-Dawley rats. Castration was performed at 10 weeks of age, some animals were fed a high-fat diet and others received T replacement (subdermal T-filled implants). At 25 weeks of age, the castrated rats receiving a high-fat diet had hepatic microvesicular and macrovesicular steatosis and signs of inflammation, as well as higher hepatocyte apoptosis, all partially reverted by T treatment. Regarding the expression of lipid biosynthesis-related genes, HFD caused some increments in FAS and SREBP1, and to a lower extent in PPARα, in non-castrated rats, and castration or T therapy did not further modify these protein levels [Citation104]. Therefore, these results do not support that a marked increase in fat synthesis is the major cause for hepatic steatosis in T-deficient rats. The same research group, in the study of Jia et al. [Citation40] provided pieces of evidence that the expression of lipid export proteins apolipoprotein B 100 (ApoB100) and microsomal TG transfer protein (MTP) were supressed by a high-fat diet in castrated, but also non-castrated rats. Curiously, these protein levels were restored by T therapy. Also, proteins related to lipid droplets in macrovesicular steatosis (perilipin 1 (PLIN1) and fat-specific protein 27 (FSP27)) and also protein related to endoplasmic reticulum (ER) stress (PKR-like ER kinase (PERK), Inositol requiring-1alpha (IRE-1α), c-Jun N-terminal kinase (JNK), factor nuclear kappa B (NF-κB), and C/EBP homologous protein (CHOP)) were increased by the high-fat diet only in castrated rats and suppressed by T therapy [Citation40]. These suggested that the hepatic lipid accumulation, at least under these experimental conditions, are related to related to decreased hepatic lipid export, higher formation of macrovesicular lipid droplets and enhanced ER stress.
Further studies may help to better distinguish between the effects of T and those that depends on diet and other factors, not only to understand the pathogenesis of NAFLD, but also other metabolic disturbs common to MetS. Also, carefully designed experiments, using even more advanced approaches, perhaps combining physiological parameters with proteomic and metabolomic data, in different organs and tissues, may be a fruitful area to elucidate the complex interaction between T and energy metabolism in different animals, including humans.
Conclusion
In conclusion, metabolic disturbs are associated with low T in men and rodents. T itself seems modulated body fat distribution and lipid profile, thus, a link between T levels and MetS components. This literature review reinforced the current knowledge that older age, sexual symptoms, signs of insulin resistance, dyslipidemia and obesity are important factors associated with hypogonadism. These indicators of metabolic function impairment show that it is crucial to suspect and investigate T deficiency in aging men at any sign of important changes on body weight and body composition. Few studies have investigated the role of T deficiency on the development of hepatic steatosis. The studies that have investigated this question did not use gold standard methods to diagnose NAFLD, which may be related to the fact that biopsies are invasive and only recommended for subjects with signs of severe liver diseases. Nevertheless, some studies pointed the causal relationship between hepatic steatosis and T levels, which suggest that the liver may be more susceptible to accumulate fat during T deficiency condition. These observations were also reinforced by the studies with rodents, which showed evidences that the androgen deficiency per se has some deleterious effects on energy metabolism, and induction of severe conditions as hepatic steatosis was achieved by associating the T deficiency with diet challenges. Conversely, studies have consistently showed that for men with hypogonadism, long-term TRT can lead to significant weight loss and improvements in several metabolic outcomes. This is of special concern among older subjects and those with major risk factors for MetS. In this sense, to be more assertive, therapeutic approaches in this population must include the assessment of hormone profile to serve as an indicator for the risk to develop non-infectious chronic diseases, including cardiovascular disease and MetS. It is not overstated to say then that the maintenance of physiological levels of T has the potential to improve the quality of life and to prolong the life. There are situations, however, in which androgen depravation is desired, as is the case of men with prostate cancer, requiring special attention to metabolic side effects of ADT.
Gaining a clear understanding of the interlinked pathways that mediate the high prevalence of T deficiency in subjects with obesity can help the design of more effective strategies in the management of hypogonadism, which certainly should include a multidisciplinary setting, once the consequences of T deficiency goes beyond sexual and metabolic disturbs. For those with diagnose of T deficiency, hepatic steatosis should be a concern, and besides T replacement, adaptations on diet and lifestyle may represent important preventive approaches to avoid ectopic accumulation of fat in the liver.
Disclosure statement
The authors report no conflict of interest.
Additional information
Funding
References
- Schindler AE. Climacteric symptoms and hormones. Gynecol Endocrinol. 2006;22:151–154.
- Solstad K, Garde K. Middle-aged Danish men’s ideas of a male climacteric–and of the female climacteric. Maturitas. 1992;15:7–16.
- Juul A, Skakkebaek NE. Androgens and the aging male. Hum Reprod Update. 2002;8:423–433.
- Tenover JS. Androgen administration to aging men. Endocrinol Metab Clin North Am. 1994;23:877–892.
- Dunn JF, Nisula BC, Rodbard D. Transport of steroid hormones: binding of 21 endogenous steroids to both testosterone-binding globulin and corticosteroid-binding globulin in human plasma. J Clin Endocrinol Metab. 1981;53:58–68.
- Pardridge WM. Serum bioavailability of sex steroid hormones. Clin Endocrinol Metab. 1986;15:259–278.
- Lapauw B, Goemaere S, Zmierczak H, et al. The decline of serum testosterone levels in community-dwelling men over 70 years of age: descriptive data and predictors of longitudinal changes. Eur J Endocrinol. 2008;159:459–468.
- Wu FC, Tajar A, Pye SR, et al. Hypothalamic-pituitary-testicular axis disruptions in older men are differentially linked to age and modifiable risk factors: the European Male Aging Study. J Clin Endocrinol Metab. 2008;93:2737–2745.
- McBride JA, Carson CC, 3rd, Coward RM. Testosterone deficiency in the aging male. Ther Adv Urol. 2016;8:47–60.
- Samaras N, Samaras D, Lang PO, et al. A view of geriatrics through hormones. What is the relation between andropause and well-known geriatric syndromes? Maturitas. 2013;74:213–219.
- Lunenfeld B, Mskhalaya G, Zitzmann M, et al. Recommendations on the diagnosis, treatment and monitoring of hypogonadism in men. Aging Male. 2015;18:5–15.
- Wu FC, Tajar A, Beynon JM, et al.; EMAS Group. Identification of late-onset hypogonadism in middle-aged and elderly men. N Engl J Med. 2010;363:123–135.
- Maneesh M, Dutta S, Chakrabarti A, et al. Alcohol abuse-duration dependent decrease in plasma testosterone and antioxidants in males. Indian J Physiol Pharmacol. 2006;50:291–296.
- Shiels MS, Rohrmann S, Menke A, et al. Association of cigarette smoking, alcohol consumption, and physical activity with sex steroid hormone levels in US men. Cancer Causes Control. 2009;20:877–886.
- Emmelot-Vonk MH, Verhaar HJ, Nakhai Pour HR, et al. Effect of testosterone supplementation on functional mobility, cognition, and other parameters in older men: a randomized controlled trial. JAMA. 2008;299:39–52.
- Li C, Ford ES, Li B, et al. Association of testosterone and sex hormone-binding globulin with metabolic syndrome and insulin resistance in men. Diabetes Care. 2010;33:1618–1624.
- Suzuki R, Allen NE, Appleby PN, et al. Lifestyle factors and serum androgens among 636 middle aged men from seven countries in the European Prospective Investigation into Cancer and Nutrition (EPIC). Cancer Causes Control. 2009;20:811–821.
- Rohrmann S, Shiels MS, Lopez DS, et al. Body fatness and sex steroid hormone concentrations in US men: results from NHANES III. Cancer Causes Control. 2011;22:1141–1151.
- Fink JE, Hackney AC, Matsumoto M, et al. Mobility and biomechanical functions in the aging male: testosterone and the locomotive syndrome. Aging Male. 2018;29:1–8.
- Harada N. Role of androgens in energy metabolism affecting on body composition, metabolic syndrome, type 2 diabetes, cardiovascular disease, and longevity: lessons from a meta-analysis and rodent studies. Biosci Biotechnol Biochem. 2018;82:1667–1682.
- Grundy SM. Metabolic syndrome pandemic. Arterioscler Thromb Vasc Biol. 2008;28:629–636.
- Kaur J. A comprehensive review on metabolic syndrome. Cardiol Res Pract. 2014;2014:943162.
- Saklayen MG. The global epidemic of the metabolic syndrome. Curr Hypertens Rep. 2018;20:12.
- Alberti KG, Eckel RH, Grundy SM, et al. Harmonizing the metabolic syndrome: a joint interim statement of the International Diabetes Federation Task Force on Epidemiology and Prevention; National Heart, Lung, and Blood Institute; American Heart Association; World Heart Federation; International Atherosclerosis Society; and International Association for the Study of Obesity. Circulation. 2009;120:1640–1645.
- Grover S, Malhotra N, Chakrabarti S, et al. Metabolic syndrome in bipolar disorders. Indian J Psychol Med. 2012;34:110–118.
- O’Neill S, O’Driscoll L. Metabolic syndrome: a closer look at the growing epidemic and its associated pathologies. Obes Rev. 2015;16:1–12.
- Berenji S, Bt Rahmat A, Hanachi P, et al. Metabolic syndrome in Iran. GJHS. 2010;2:6.
- Reaven GM. The metabolic syndrome: time to get off the merry-go-round? J Intern Med. 2011;269:127–136.
- Chen RY, Wittert GA, Andrews GR. Relative androgen deficiency in relation to obesity and metabolic status in older men. Diabetes Obes Metab. 2006;8:429–435.
- Kupelian V, Page ST, Araujo AB, et al. Low sex hormone-binding globulin, total testosterone, and symptomatic androgen deficiency are associated with development of the metabolic syndrome in nonobese men. J Clin Endocrinol Metab. 2006;91:843–850.
- Jeong SM, Ham BK, Park MG, et al. Effect of testosterone replacement treatment in testosterone deficiency syndrome patients with metabolic syndrome. Korean J Urol. 2011;52:566–571.
- Blaya R, Thomaz LD, Guilhermano F, et al. Total testosterone levels are correlated to metabolic syndrome components. Aging Male. 2016;19:85–89.
- Angelova P, Kamenov Z, Tsakova A, et al. Interleukin-18 and testosterone levels in men with metabolic syndrome. Aging Male. 2018;21:130–137.
- Souteiro P, Belo S, Oliveira SC, et al.; AMTCO Group. Insulin resistance and sex hormone-binding globulin are independently correlated with low free testosterone levels in obese males. Andrologia. 2018;50:e13035.
- Groti K, Zuran I, Antonic B, et al. The impact of testosterone replacement therapy on glycemic control, vascular function, and components of the metabolic syndrome in obese hypogonadal men with type 2 diabetes. Aging Male. 2018;21:158–169.
- Sakr HF, Hussein AM, Eid EA, et al. Possible mechanisms underlying fatty liver in a rat model of male hypogonadism: a protective role for testosterone. Steroids. 2018;135:21–30.
- Harada N, Hanaoka R, Horiuchi H, et al. Castration influences intestinal microflora and induces abdominal obesity in high-fat diet-fed mice. Sci Rep. 2016;6:23001.
- Dubois V, Laurent MR, Jardi F, et al. Androgen deficiency exacerbates high-fat diet-induced metabolic alterations in male mice. Endocrinology. 2016;157:648–665.
- Xia F, Xu X, Zhai H, et al. Castration-induced testosterone deficiency increases fasting glucose associated with hepatic and extra-hepatic insulin resistance in adult male rats. Reprod Biol Endocrinol. 2013;11:106.
- Jia Y, Yee JK, Wang C, et al. Testosterone protects high-fat/low-carbohydrate diet-induced nonalcoholic fatty liver disease in castrated male rats mainly via modulating endoplasmic reticulum stress. Am J Physiol Endocrinol Metab. 2018;314:E366–E376.
- Borbelyova V, Domonkos E, Babickova J, et al. Does long-term androgen deficiency lead to metabolic syndrome in middle-aged rats? Exp Gerontol. 2017;98:38–46.
- Michael A, Mederos AMB, Scovell JM, Ramasamy R. Can serum testosterone be used as a marker of overall health? Rev Urol. 2015;17:4.
- Vermeulen A, Kaufman JM, Deslypere JP, et al. Attenuated luteinizing hormone (LH) pulse amplitude but normal LH pulse frequency, and its relation to plasma androgens in hypogonadism of obese men. J Clin Endocrinol Metab. 1993;76:1140–1146.
- Dwyer AA, Quinton R. The metabolic syndrome in central hypogonadotrophic hypogonadism. Front Horm Res. 2018;49:156–169.
- Allen NE, Appleby PN, Davey GK, et al. Lifestyle and nutritional determinants of bioavailable androgens and related hormones in British men. Cancer Causes Control. 2002;13:353–363.
- Moore JB. Non-alcoholic fatty liver disease: the hepatic consequence of obesity and the metabolic syndrome. Proc Nutr Soc. 2010;69:211–220.
- Day CP, James OFW. JO. Steatohepatitis: a tale of two “hits”? Gastroenterology. 1998;114:842–845.
- Tang YJ, Lee WJ, Chen YT, et al. Serum testosterone level and related metabolic factors in men over 70 years old. J Endocrinol Invest. 2007;30:451–458.
- Zou Y, Li J, Lu C, et al. High-fat emulsion-induced rat model of nonalcoholic steatohepatitis. Life Sci. 2006;79:1100–1107.
- Grosman H, Rosales M, Fabre B, et al. Association between testosterone levels and the metabolic syndrome in adult men. Aging Male. 2014;17:161–165.
- Haring R, Volzke H, Felix SB, et al. Prediction of metabolic syndrome by low serum testosterone levels in men: results from the study of health in Pomerania. Diabetes. 2009;58:2027–2031.
- Rotter I, Ryl A, Grzesiak K, et al. Cross-sectional inverse associations of obesity and fat accumulation indicators with testosterone in non-diabetic aging men. Int J Environ Res Public Health. 2018;15:1207.
- Ugwu TE, Ikem RT, Kolawole BA, et al. Clinicopathologic assessment of hypogonadism in men with type 2 diabetes mellitus. Indian J Endocr Metab. 2016;20:667–673.
- Tan WS, Ng CJ, Khoo EM, et al. The triad of erectile dysfunction, testosterone deficiency syndrome and metabolic syndrome: findings from a multi-ethnic Asian men study (The Subang Men’s Health Study). Aging Male. 2011;14:231–236.
- Fillo J, Breza J, Levcikova M, et al. Occurrence of erectile dysfunction, testosterone deficiency syndrome and metabolic syndrome in patients with abdominal obesity. Where is a sufficient level of testosterone? Int Urol Nephrol. 2012;44:1113–1120.
- Garcia-Cruz E, Leibar-Tamayo A, Romero-Otero J, et al. Marked testosterone deficiency-related symptoms may be associated to higher metabolic risk in men with low testosterone levels. J Sex Med. 2014;11:2292–2301.
- Kwon H, Lee DG, Kang HC, et al. The relationship between testosterone, metabolic syndrome, and mean carotid intima-media thickness in aging men. Aging Male. 2014;17:211–215.
- Maiorino MI, Bellastella G, Giugliano D, et al. From inflammation to sexual dysfunctions: a journey through diabetes, obesity, and metabolic syndrome. J Endocrinol Invest. 2018;41:1249–1258.
- Kawada T, Otsuka T, Endo T, et al. Aging, components of metabolic syndrome and serum C-reactive protein showed significant relationship with carotid atherosclerosis. Aging Male. 2012;15:42–47.
- Mohamad NV, Wong SK, Wan Hasan WN, et al. The relationship between circulating testosterone and inflammatory cytokines in men. Aging Male. 2019;22:129–140.
- Maggio M, Blackford A, Taub D, et al. Circulating inflammatory cytokine expression in men with prostate cancer undergoing androgen deprivation therapy. J Androl. 2006;27:725–728.
- Zhao J, Jiang C, Lam TH, et al. Genetically predicted testosterone and systemic inflammation in men: a separate-sample Mendelian randomization analysis in older Chinese men. PLoS One. 2015;10:e0126442.
- Huang G, Travison T, Maggio M, et al. Effects of testosterone replacement on metabolic and inflammatory markers in men with opioid-induced androgen deficiency. Clin Endocrinol. 2016;85:232–238.
- Vermeulen A, Verdonck L, Kaufman JM. A critical evaluation of simple methods for the estimation of free testosterone in serum. J Clin Endocrinol Metab. 1999;84:3666–3672.
- Erenpreiss J, Fodina V, Pozarska R, et al. Prevalence of testosterone deficiency among aging men with and without morbidities. Aging Male. 2019.
- Nanjee MN, Wheeler MJ. Plasma free testosterone–is an index sufficient? Ann Clin Biochem. 1985;22:387–390.
- Jiann BP, Hsieh JT, Liu SP, et al. Associations of endogenous testosterone and lipid profiles in middle-aged to older Taiwanese men. Int J Impot Res. 2011;23:62–69.
- Tajar A, Huhtaniemi IT, O'Neill TW, et al.; EMAS Group. Characteristics of androgen deficiency in late-onset hypogonadism: results from the European Male Aging Study (EMAS). J Clin Endocrinol Metab. 2012;97:1508–1516.
- Ho CH, Jaw FS, Wu CC, et al. The prevalence and the risk factors of testosterone deficiency in newly diagnosed and previously known type 2 diabetic men. J Sex Med. 2015;12:389–397.
- Agarwal PK, Singh P, Chowdhury S, et al. A study to evaluate the prevalence of hypogonadism in Indian males with Type-2 diabetes mellitus. Indian J Endocrinol Metab. 2017;21:64–70.
- Golan R, Scovell JM, Ramasamy R. Age-related testosterone decline is due to waning of both testicular and hypothalamic-pituitary function. Aging Male. 2015;18:201–204.
- Plymate SR, Matej LA, Jones RE, et al. Inhibition of sex hormone-binding globulin production in the human hepatoma (Hep G2) cell line by insulin and prolactin. J Clin Endocrinol Metab. 1988;67:460–464.
- Simo R, Saez-Lopez C, Barbosa-Desongles A, et al. Novel insights in SHBG regulation and clinical implications. Trends Endocrinol Metab. 2015;26:376–383.
- Goncharov NP, Katsya GV, Chagina NA, et al. Three definitions of metabolic syndrome applied to a sample of young obese men and their relation with plasma testosterone. Aging Male. 2008;11:118–122.
- Katabami T, Kato H, Asahina T, et al. Serum free testosterone and metabolic syndrome in Japanese men. Endocr J. 2010;57:533–539.
- Barbonetti A, Vassallo MRC, Cotugno M, et al. Low testosterone and non-alcoholic fatty liver disease: evidence for their independent association in men with chronic spinal cord injury. J Spinal Cord Med. 2016;39:7.
- Hasanain AFA, Mahdy RE, Mahran AMA, et al. Erectile dysfunction in patients with nonalcoholic fatty liver disease. Arab J Gastroenterol. 2017;18:21–24.
- Seo NK, Koo HS, Haam JH, et al. Prediction of prevalent but not incident non-alcoholic fatty liver disease by levels of serum testosterone. J Gastroenterol Hepatol. 2015;30:1211–1216.
- Kim D, Touros A, Kim WR. Nonalcoholic fatty liver disease and metabolic syndrome. Clin Liver Dis. 2018;22:133–140.
- Yang Q, Wu K, Zhuang Y, et al. Association of total testosterone, free testosterone, bioavailable testosterone and sex hormone-binding globulin with hepatic steatosis and the ratio of aspartate aminotransferase to alanine aminotransferase. Endocr J. 2018;65:915–921.
- Hoyos CM, Yee BJ, Phillips CL, et al. Body compositional and cardiometabolic effects of testosterone therapy in obese men with severe obstructive sleep apnoea: a randomised placebo-controlled trial. Eur J Endocrinol. 2012;167:531–541.
- Albhaisi S. Non-invasive imaging modalities in nonalcoholic fatty liver disease: where do we stand? Eur Med J Hepatol. 2019;7:80–85.
- Saad F, Gooren L, Haider A, et al. An exploratory study of the effects of 12 months administration of the novel long-acting testosterone undecanoate on measures of sexual function and the metabolic syndrome. Arch Androl. 2007;53:5.
- Singh SK, Goyal R, Pratyush DD. Is hypoandrogenemia a component of metabolic syndrome in males? Exp Clin Endocrinol Diabetes. 2010;119:30–35.
- Traish AM, Haider A, Doros G, et al. Long-term testosterone therapy in hypogonadal men ameliorates elements of the metabolic syndrome: an observational, long-term registry study. Int J Clin Pract. 2014;68:314–329.
- Traish AM, Haider A, Haider KS, et al. Long-term testosterone therapy improves cardiometabolic function and reduces risk of cardiovascular disease in men with hypogonadism: a real-life observational registry study setting comparing treated and untreated (control) groups. J Cardiovasc Pharmacol Ther. 2017;22:414–433.
- Haider KS, Haider A, Doros G, et al. Long-term testosterone therapy improves urinary and sexual function, and quality of life in men with hypogonadism: results from a propensity matched subgroup of a controlled registry study. J Urol. 2018;199:257–265.
- Yassin A, Nettleship JE, Talib RA, et al. Effects of testosterone replacement therapy withdrawal and re-treatment in hypogonadal elderly men upon obesity, voiding function and prostate safety parameters. Aging Male. 2016;19:64–69.
- Dias JP, Shardell MD, Carlson OD, et al. Testosterone vs. aromatase inhibitor in older men with low testosterone: effects on cardiometabolic parameters. Andrology. 2017;5:31–40.
- Canguven O, Talib RA, El Ansari W, et al. Vitamin D treatment improves levels of sexual hormones, metabolic parameters and erectile function in middle-aged vitamin D deficient men. Aging Male. 2017;20:9–16.
- Xu Y, Shao X, Yao Y, et al. Positive association between circulating 25-hydroxyvitamin D levels and prostate cancer risk: new findings from an updated meta-analysis. J Cancer Res Clin Oncol. 2014;140:1465–1477.
- Abdollah F, Briganti A, Suardi N, et al. Metabolic syndrome and benign prostatic hyperplasia: evidence of a potential relationship, hypothesized etiology, and prevention. Korean J Urol. 2011;52:507–516.
- Zhang X, Zeng X, Liu Y, et al. Impact of metabolic syndrome on benign prostatic hyperplasia in elderly Chinese men. Urol Int. 2014;93:214–219.
- Park YW, Kim SB, Kwon H, et al. The relationship between lower urinary tract symptoms/benign prostatic hyperplasia and the number of components of metabolic syndrome. Urology. 2013;82:674–679.
- Cakir SS, Ozcan L, Polat EC, et al. Statins are effective in the treatment of benign prostatic hyperplasia with metabolic syndrome. Aging Male. 2018.
- Caliskan S, Kaba S, Ozsoy E, et al. The effect of metabolic syndrome on prostate cancer final pathology. J Cancer Res Ther. 2019;15:S47–S50.
- Goh VH, Hart WG. The association of metabolic syndrome and aging with cognition in Asian men. Aging Male. 2014;17:216–222.
- Magee DE, Singal RK. Androgen deprivation therapy: indications, methods of utilization, side effects and their management. Can J Urol. 2020;27:11–16.
- Ostergren PB, Kistorp C, Fode M, et al. Metabolic consequences of gonadotropin-releasing hormone agonists vs orchiectomy: a randomized clinical study. BJU Int. 2019;123:602–611.
- Mangiola S, Stuchbery R, McCoy P, et al. Androgen deprivation therapy promotes an obesity-like microenvironment in periprostatic fat. Endocr Connect. 2019;8:547–558.
- Christoffersen B, Raun K, Svendsen O, et al. Evalution of the castrated male Sprague-Dawley rat as a model of the metabolic syndrome and type 2 diabetes. Int J Obes (Lond). 2006;30:1288–1297.
- Dowman JK, Tomlinson JW, Newsome PN. Pathogenesis of non-alcoholic fatty liver disease. QJM. 2010;103:71–83.
- Kelly DM, Nettleship JE, Akhtar S, et al. Testosterone suppresses the expression of regulatory enzymes of fatty acid synthesis and protects against hepatic steatosis in cholesterol-fed androgen deficient mice. Life Sci. 2014;109:95–103.
- Nikolaenko L, Jia Y, Wang C, et al. Testosterone replacement ameliorates nonalcoholic fatty liver disease in castrated male rats. Endocrinology. 2014;155:417–428.