
Abstract
Objectives
Sarcopenia is very common due to cachexia and presents with a decrease in skeletal muscle mass. In this study, we aimed to investigate the relationship between the T, M category and the erector spinae muscle area (ESMa).
Material and methods
The initial first thorax and high-resolution computed tomography (CT) of patients with lung cancer between 2015 and 2019 were retrospectively screened. After exclusion criterias remaining 226 male patients constituted the study group. ESMa was measured manually in the section taken from the T12 vertebra spinous process level as previously described in the literature and its relationship with the T and M stage were evaluated.
Results
The mean ages of patients were 70 ± 9.57 years. The T stage was T1 in 34 (15%) patients, T2 in 46 (20.4%), T3 in 59 (26.1%), and T4 in 87 (38.5%). Metastasis was detected in 83 (36.7%) patients. The mean ESMa of the patients was 34.15 ± 7.21 mm2 and did not differ according to the T stage (p = .39). ESMa was lower in the metastatic group (mean 30.42 ± 6.38 mm2) than the non-metastatic group (mean 36.32 ± 6.78 mm2) (p = .0001).
Conclusions
ESMa, one of the indicators of sarcopenia, is lower in patients with metastatic lung cancer than in nonmetastatic.
Background
According to the both American Cancer Society 2021 and Global Cancer Statistics 2020, lung cancer was the second most commonly seen cancer and the first leading cause of cancer related deaths worldwide in both sexes [Citation1,Citation2]. Imaging methods have an important place in the lung cancer [Citation2]. Patients with lung cancer are clinically and pathologically staged according to the TNM staging, and TNM 8 has been used since 2017 based on prognostic data [Citation3]. In this abbreviation, T stands for tumor diameter, N refers to lymph node metastasis, and M represents distant metastasis [Citation4]. The diagnosis of metastasis is made by positron emission tomography-computed tomography (PET-CT) and computed tomography (CT) [Citation5–7].
Cachexia is a complex medical syndrome and is usually develops due to an underlying disease and is characterized by muscle wasting. Fat mass loss may or may not be accompanied [Citation8]. Sarcopenia is a progressive syndrome characterized by falls, fractures, physical disability, and mortality, usually as a result of muscle disease [Citation9]. Sarcopenia is a prognostic factor that can be seen in patients with cancer due to cachexia and presents with a decrease in skeletal muscle mass [Citation10,Citation11]. Measurements made from the psoas muscles in the section taken from the L3 vertebra level in CT are one of the most commonly used methods for sarcopenia [Citation12,Citation13]. In cases where the skeletal muscle index is <55 cm2/m2 in men and <39 cm2/m2 in women at the L3 vertebra level, sarcopenia is considered [Citation14]. In addition, relative sarcopenia has been previously calculated using muscle and subcutaneous fat tissue measurements made in the axial section at the T12 vertebra level and compared with clinical data [Citation15]. The erector spinae muscle area (ESMa) measured at the T12 vertebra level has been found to be a determining factor in the prognosis in patients with idiopathic pulmonary fibrosis [Citation16].
The relationship between sarcopenia and lung cancer has been investigated in many stages, [Citation17] and there are studies, albeit few, showing the radiological correlation between sarcopenia and the T and M stage in the TNM staging [Citation18]. The psoas muscle measured at the level of the L3 vertebra is used as a reference in sarcopenia. But the L3 level is not routinely visualized in thorax CT. But ESMa can be measured from thorax CT. ESMa is a parameter that can be used instead of sarcopenia [Citation16], but there is no study in the literature comparing the relationship between ESMa and the T and M stages in lung cancer. Therefore, in this study, we aimed to radiologically investigate the relationship between the T and M stage and ESMa in patients with lung cancer.
Material and methods
Patient population
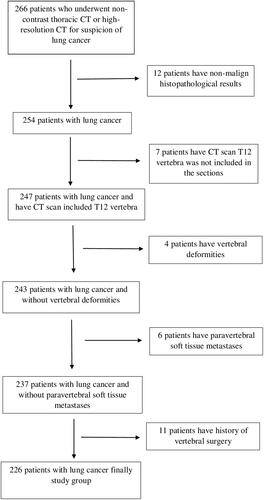
Patients who presented to our hospital with a suspicion of lung cancer between 2015 and 2019 and underwent non-contrast thoracic CT and high-resolution CT (HRCT) were retrospectively screened. The images of 266 patients were evaluated. Only the first examinations of the patients at the diagnosis stage were included in our study, and the follow-up evaluations were not taken into consideration. The diagnoses of the patients were made pathologically by tru- cut biopsy. Patients with a pathologically undiagnosed lung mass, cases in which the T12 vertebra was not included in the sections, and those with vertebral deformities, paraspinal soft tissue metastases, or a history of vertebral surgery were excluded from the study. The patients had no other concomitant diseases. Only male patients were included in the sample since muscle area shows gender-related differences and the number of female patients is low. After excluding 40 patients using these criteria, the remaining 226 male patients constituted the study group. A flowchart for the selection of patients is presented in .
Figure 1. The Flowchart describes that how patients were selected.
Imaging procedure
The CT examinations of the patients were performed between 2015 and 2019 with 64-slice (Toshiba, Aquilion, Tokyo, Japan) CT and 128-slice (GE, Revolution Evo, USA) devices using the following parameters: slice thickness, 0.5–0.625 mm; tube voltage, 120 kV; tube current, 80–300 mA; and pitch, 0.984:1.
Imaging analysis
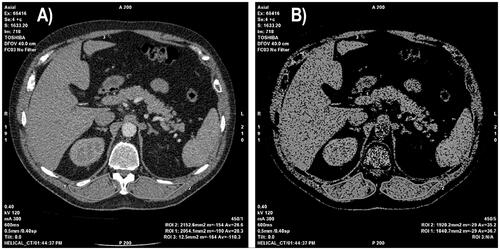
The images of the patients were evaluated on a dedicated workstation (GE, Advantage Workstation 4.7) by two radiologists with seven years (N.A.) and nine years (E.G.) of experience in radiology based on consensus for T staging. In CT, ESMa was measured manually in the section taken from the T12 vertebra spinous process level as previously described in the literature [Citation16]. The CT images were reconstructed by adjusting the window level to 40 and window width to 300 HU on a single axial CT section. The threshold was set at −29 to +150 HU as described in the literature [Citation19]. ESMa was drawn manually on the right and left sides using freehand regions of interest. ESMa was determined as the sum of the areas measured on both sides (). The measurements were separately undertaken by the two radiologists for inter-observer agreement. The first radiologist (N.A.) repeated the measurements one week later from the first for intra-observer agreement. The second measurements of the first radiologist were used for statistical analysis.
Figure 2. Left to right: (A) The axial computed tomography (CT) image was taken from the T12 vertebra spinous process level. (B) Measurement of the erector spinae muscle area (ESMa) on the axial CT section (window length, 40; window width, 300 HU). The threshold was set at −29 to +150 HU. ESMa was manually drawn on both sides using freehand regions of interest.
The T stage was evaluated according to the maximum tumor diameter in CT. The tumor was measured based on maximum mass diameter across three planes (axial, coronal, and sagittal) and the largest was recorded. In the measurements performed using the parenchyma window, T1 was considered if the tumor diameter was ≤3 cm, T2 if 3–5 cm; T3 if 5–7 cm, and T4 if >7 cm. In the presence of tumor invasion of the chest wall, a different tumor nodule in the same lobe, or suspected pericardial invasion, the tumor was accepted as T3 regardless of size and if there was suspected mediastinal invasion, invasion of the trachea, diaphragm, esophagus or spine, or a nodule in a different lobe on the same side as the tumor, it was accepted as T4 regardless of size. In this study, we did not evaluate the N stage. Because we used non-contrast chest CT for image analysis. N staging is should be evaluated from contrast-enhanced CT, PET-CT, and also sometimes biopsy. The M stage was decided according to the patients’ current radiological images and information included in their files. The patients were divided into two groups those with and without metastasis.
The patients were divided into four groups according to their histopathological results. Small cell lung carcinoma, squamous cell lung carcinoma, and adenocarcinoma were evaluated in separate groups. Since large cell lung carcinoma, carcinoid tumors, tumors with mixed pathology, and unclassified carcinomas were few in number, they were evaluated in a single group as “others” [Citation20].
Statistical analysis
SPSS v. 22.0 was used (IBM Corp.) for statistical analyses. The conformance of data to the normal distribution was evaluated using the Shapiro-Wilk test. Descriptive statistics were given as n (%), mean, standard deviation (SD), minimum and maximum. Multivariable analysis was made by Statistical Analysis System (SAS) program. The adjusting for other factors (histopathological subtypes and M stage for T stage; histopathological subtypes, T stage and age for M stage; M and T stage for histopathological subtypes) was made. Whether there was a difference between the groups according to the T stage was evaluated with the ANOVA test. A post hoc analysis (Bonferroni test “t-tests between each possible pair and adjusted p-value for each one”) was used after the analysis of the variance test to determine the group that caused a significant difference.
The comparison of ESMa between the metastatic and non-metastatic groups was undertaken using the independent Student t-test. The receiver operating characteristic (ROC) analysis was conducted to determine the cut-off value of ESMa in the differentiation of the two groups (metastatic and non-metastatic). The area under the curve (AUC) was calculated to determine the cut-off value. The optimal cut-off value was determined according to the Youden J index (sensitivity + specificity − 1). The intraclass correlation coefficient (ICC) (95% confidence interval) was used to assess the intra-observer and inter-observer agreement in ESMa. Based on the 95% confidence interval of the ICC estimates, values less than 0.5, 0.5 to 0.75, 0.75 to 0.9, and greater than 0.90 were accepted to indicate poor, moderate, good, and excellent reliability, respectively. A p value less than .05 was considered statistically significant.
Results
The ages of the patients included in the study varied between 44 and 94 years (mean age 70 ± 9.57 years). The mean age did not differ according to the T stage (p = .32) and histopathological subtypes (p = .488), but the metastatic patient group was significantly older according to the M stage (p = .03). The findings are summarized in .
Table 1. Ages of the patients according to the T and M stage, histopathological subtypes.
The T stage was T1 in 34 (15%) patients, T2 in 46 (20.4%), T3 in 59 (26.1%), and T4 in 87 (38.5%). Metastasis was detected in 83 (36.7%) patients and not detected in 143 (63.3%). The distribution of the patients in histopathological subgroups was as follows: 15 (6.6%) patients had small cell lung carcinoma, 96 (42.5%) had squamous cell carcinoma, and 80 (35.4%) had adenocarcinoma, and 35 (15.5%) had other histopathological types.
The ICC (95% confidence interval) values for the ESMa measurement showed excellent intra-observer agreement for the first radiologist (0.92) and excellent inter-observer agreement (0.90).
Multivariable analysis showed no significant interaction effect (histopathological subtypes-T stage p = .74, M stage-T stage p = .67, histopathological subtypes-M stage p = .33, age-M stage p = .49).
The ESMa of the patients included in the study was measured between 12.76 mm2 and 53.94 mm2 (mean 34.15 ± 7.21 mm2) and did not differ according to the T stage (p = .39). ESMa was lower in the metastatic group with a mean value of 30.42 ± 6.38 mm2 and higher in the non-metastatic group with a mean value of 36.32 ± 6.78 mm2 (p = .0001). ESMa significantly differed according to histopathological subtypes (p = .002), being higher in the squamous cell carcinoma group (mean 36.21 ± 6.97 mm2) than in the other histopathological groups, and this difference was statistically significant compared to the adenocarcinoma group (mean 32.48 ± 6.10 mm2) (p = .003). The results of the ESMa measurements according to the T and M stage, and comparisons of the ESMa values according to histopathological subtypes are shown in and . Post hoc Analysis (Bonferroni) of ESMa measurements for histopathological subtypes are shown in .
Table 2. Erector spinae muscle area values of the patients according to the T and M stage.
Table 3. Erector spinae muscle area values of the patients according to the histopathological subtypes.
Table 4. Post hoc analysis (Bonferroni) of ESMa measurements for histopathological subtypes.
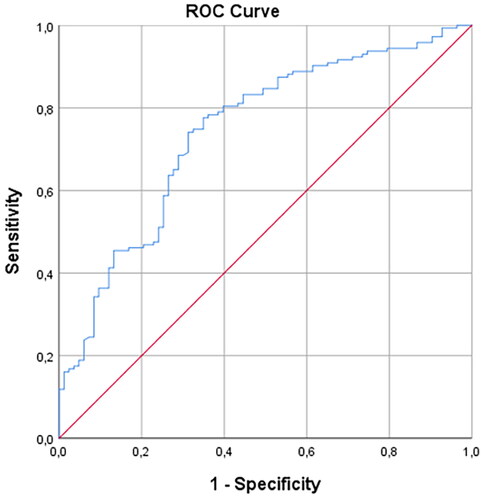
In the ROC analysis of the use of ESMa in the differentiation between the metastatic and non-metastatic groups, AUC was calculated as 0.742 (). When the cut-off value was taken as 31.81 mm2, ESMa was able to distinguish between the metastatic and non-metastatic patients at 77% sensitivity and 65% specificity.
Figure 3. Receiver operating characteristic (ROC) curve of the ESMa for the differentiation between the metastatic and non-metastatic groups.
Discussion
In this study, we found that the ESMa value was not shown a difference with the T stage but it was shown difference with the M stage in lung cancer. The ESMa value was lower in patients with metastatic lung cancer and higher in those with non-metastatic lung cancer. The AUC value was found to be 0.742 in the ROC analysis of this parameter in the differentiation of the metastatic and non-metastatic patients. In addition, at a cut-off value of 31.81 mm2, ESMa had 77% sensitivity and 65% specificity in distinguishing between the two groups. The ESMa value being lower in metastatic patients may be related to the stage of this group starting directly from IV. It can be attributed to the stage being more advanced in metastatic patients and/or the presence of mediators that cause weakening in muscles. We consider that the metastatic patient group being older than the non-metastatic group could be another reason for the lower ESMa of the former.
The T stage is decided based on measurements performed across three planes (axial, coronal, and sagittal) and the largest was recorded. In our study, we did not determine a relationship between the ESMa value and the T stage. Since the evaluation of the T stage in T3 and T4 tumors depends on other factors independent of sizes, such as invasion into surrounding tissues and presence of nodules in the same or a different lobe, more accurate results can be obtained by evaluating the tumor volume which is directly related to tumor burden. Future volumetric studies can shed further light on this issue. In addition, as the T stage increases, the stage of the patient changes in a wide range from IA to IIIA. However, we had 87 patients in the T4 group and 59 patients in the T3 group. The number of patients in the T1 and T2 groups was lower than the number of those in the T3 and T4 groups. There is a need for studies with a larger sample size to clarify this issue.
In this study, ESMa differed according to histological subtypes (between the squamous cell carcinoma and adenocarcinoma groups) in lung cancer. This may be due to the different tumor metabolism of these cancer subtypes [Citation21], but further studies are needed on this subject.
Sarcopenia is a condition that causes loss of skeletal muscles and weakens immunity after surgery [Citation22,Citation23]. Since it is a clinically important parameter, studies have been conducted to investigate its effect on the prognosis of many diseases [Citation24]. In particular, interleukin-6 and tumor necrosis factor-alpha have been found to be associated with sarcopenia, and it has been suggested that the presence of sarcopenia in patients with malignancy may lead to toxicity in the use of chemotherapy [Citation25,Citation26]. In the use of chemotherapy in advanced lung cancer and many other advanced malignancies, it may be important whether the patient is cachectic in terms of adjusting the chemotherapy dose [Citation27]. Therefore, the ESMa parameter is important in evaluating cachexia in thorax examinations used in the staging of cancer cases.
In a previous study, sarcopenia was found to be significantly associated with advanced age, male gender, advanced stage, comorbidity, and low body mass index in lung cancer [Citation17]. In the literature, ESMa measured at the T12 vertebra level in lung tomography has been used to evaluate sarcopenia and cachexia in chronic lung diseases. Tanimura et al. determined ESMa to be an important clinical parameter correlated with disease prognosis in chronic lung diseases [Citation28]. In another study, Canvasser et al. reported that the paraspinous muscle area measured at the T12 level was correlated with the total psoas muscle area measured at the L4 level [Citation29]. Considering the use of ESMa measured at the T12 level in the evaluation of prognosis in lung diseases, we investigated the relationship between the T and M stages of lung cancer and the ESMa value in our study. In a previous study evaluating lung cancer, unlike our study, the authors evaluated adipopenia based on the PET-CT examination of patients with non-small cell lung carcinoma and found a relationship with a reduced five-year survival rate in early-stage cases [Citation30]. Small cell lung carcinoma was also present in our study. As expected, the number of patients with this histological subtype was lower compared to the remaining histopathological groups.
Kinsey et al. reported a correlation between a lower pectoral muscle area at the time of diagnosis and lower overall survival in patients with non-small cell lung carcinoma [Citation31]. In contrast, Kim et al. detected no relationship between sarcopenia and histological subtype in lung cancer [Citation17]. In the current study, the ESMa value was lower in patients with adenocarcinoma than in those with squamous cell lung carcinoma. To the best of our knowledge, there is no other study in the literature showing the relationship between lung cancer and the ESMa value.
According to the results of our study, the ESMa value measured at the T12 level in lung cancer was able to detect metastatic diseases at 77% sensitivity when the cut-off value was accepted as 31.81 mm2. Some metastases are occult and can be detected in later stages. Therefore, values below our cut-off value can be used in the prognosis evaluation of patients with lung cancer. Our findings can serve as a guide in identifying patients with occult metastasis based on a low ESMa value.
This study has certain limitations, including the non-homogeneity of the number of patients according to the histological subtypes of lung cancer. In addition, our study was based on imaging at the time of the diagnosis of lung cancer, and follow-up examinations were not taken into consideration. Although TNM staging is used in non-small cell lung cancers, we think that it has a place in the prognosis of small cell lung cancers as well. Therefore, we included small cell lung cancers in the TNM staging. Maybe this can be considered a limitation. Using free-hand ROI for measurement may be a limitation, but it is a highly reproducible method since the intra and interobserver agreement is excellent. And it is used in this way in many radiological evaluations such as surrenal adenomas. The erector spinae muscle area was not adjusted according to the height of the patients in our study. Lastly, the inclusion of only male patients in the study is also a limitation.
Conclusion
In conclusion, ESMa is a parameter that can be used to evaluate cachexia in non-contrast thoracic CT or HRCT. We found the ESMa value to be lower in patients with metastatic lung cancer. However, there was no difference between ESMa and T stage in our patients. Volumetric studies and those designed with more homogeneous groups in terms of histological subtypes can further shed light on this subject.
Ethical approval
The study was initiated after obtaining approval from the local ethics committee (Eskisehir Osmangazi University decision number and date: 47/26.10.2021). All procedures performed in studies involving human participants were in accordance with the ethical standards of the institutional and/or national research committee and with the 1964 Helsinki declaration and its later amendments or comparable ethical standards. Informed consent was obtained from all individual participants in the study.
Author contributions
Nevin Aydin and Elif Gundogdu designed and performed the experiments and analyzed the data. Nevin Aydin wrote the manuscript in consultation with Elif Gundogdu.
Disclosure statement
No potential conflict of interest was reported by the author(s).
Data availability statement
The data that support the findings of this study are available from the corresponding author upon reasonable request.
Correction Statement
This article has been corrected with minor changes. These changes do not impact the academic content of the article.
Additional information
Funding
References
- Siegel RL, Miller KD, Fuchs HE, et al. Cancer statistics, 2021. CA A Cancer J. Clin. 2021;71(1):7–33.
- Sung H, Ferlay J, Siegel RL, et al. Global cancer statistics 2020: GLOBOCAN estimates of ıncidence and mortality worldwide for 36 cancers in 185 countries. CA Cancer J Clin. 2021;71(3):209–249.
- Kay FU, Kandathil A, Batra K, et al. Revisions to the tumor, node, metastasis staging of lung cancer (8th edition): rationale, radiologic findings and clinical implications. World J Radiol. 2017;9(6):269–279.
- Detterbeck FC, Boffa DJ, Kim AW, et al. The eighth edition lung cancer stage classification. Chest. 2017;151(1):193–203.
- Rami-Porta R, Asamura H, Travis WD, et al. Lung cancer - major changes in the American Joint Committee on Cancer eighth edition cancer staging manual. CA Cancer J Clin. 2017;67(2):138–155.
- Stroobants SG, D'Hoore I, Dooms C, et al. Additional value of whole-body fluorodeoxyglucose positron emission tomography in the detection of distant metastases of non-small-cell lung cancer. Clin Lung Cancer. 2003;4(4):242–247.
- Karatas F, Acat M, Sahin S, et al. The prognostic and predictive significance of serum thiols and disulfide levels in advanced non-small cell lung cancer. Aging Male. 2020;23(5):619–628.
- Evans WJ, Morley JE, Argiles J, et al. Cachexia: a new definition. Clin Nutr. 2008;27(6):793–799.
- Cruz-Jentoft AJ, Bahat G, Bauer J, et al. Sarcopenia: revised european consensus on definition and diagnosis. Age Ageing. 2019;48(1):16–31.
- Martin L, Birdsell L, Macdonald N, et al. Cancer cachexia in the age of obesity: skeletal muscle depletion is a powerful prognostic factor, independent of body mass index. J Clin Oncol. 2013;31(12):1539–1547.
- Collins J, Noble S, Chester J, et al. The assessment and impact of sarcopenia in lung cancer: a systematic literature review. BMJ Open. 2014;4(1):e003697.
- Yang M, Shen Y, Tan L, et al. Prognostic value of sarcopenia in lung cancer: a systematic review and meta-analysis. Chest. 2019;156(1):101–111.
- Ozeki N, Kawaguchi K, Fukui T, et al. Psoas muscle mass in patients undergoing lung cancer surgery: a prognostic difference between squamous cell carcinoma and adenocarcinoma. Int J Clin Oncol. 2020;25(5):876–884.
- Fearon K, Strasser F, Anker SD, et al. Definition and classification of cancer cachexia: an international consensus. Lancet Oncol. 2011;12(5):489–495.
- Cho YH, Do KH, Chae EJ, et al. Association of chest CT-based quantitative measures of muscle and fat with post-lung transplant survival and morbidity: a single ınstitutional retrospective cohort study in korean population. Korean J Radiol. 2019;20(3):522–530.
- Nakano A, Ohkubo H, Taniguchi H, et al. Early decrease in erector spinae muscle area and future risk of mortality in idiopathic pulmonary fibrosis. Sci Rep. 2020;10(1):2312.
- Kim CR, Kim EY, Kim YS, et al. Histologic subtypes are not associated with the presence of sarcopenia in lung cancer. PLoS One. 2018;13(3):e0194626.
- Kim EY, Kim YJ, Kim YS, et al. Prognostic significance of radiodensity-based skeletal muscle quantification using preoperative CT in resected non-small cell lung cancer. J Thorac Dis. 2021;13(2):754–761.
- Tanaka S, Ozeki N, Mizuno Y, et al. Preoperative paraspinous muscle sarcopenia and physical performance as prognostic indicators in non-small-cell lung cancer. J Cachexia Sarcopenia Muscle. 2021;12(3):646–656.
- Travis WD, Brambilla E, Nicholson AG, et al. The 2015 World Health Organization classification of lung tumors: ımpact of genetic, clinical and radiologic advances since the 2004 classification. J Thorac Oncol. 2015;10(9):1243–1260.
- Meijer TW, Schuurbiers OC, Kaanders JH, et al. Differences in metabolism between adeno- and squamous cell non-small cell lung carcinomas: spatial distribution and prognostic value of GLUT1 and MCT4. Lung Cancer. 2012;76(3):316–323.
- Pipek LZ, Baptista CG, Nascimento RFV, et al. The impact of properly diagnosed sarcopenia on postoperative outcomes after gastrointestinal surgery: a systematic review and meta-analysis. PLoS One. 2020;15(8):e0237740.
- Wilson D, Jackson T, Sapey E, et al. Frailty and sarcopenia: the potential role of an aged immune system. Ageing Res Rev. 2017;36:1–10.
- Takahashi Y, Suzuki S, Hamada K, et al. Sarcopenia is poor risk for unfavorable short- and long-term outcomes in stage I non-small cell lung cancer. Ann Transl Med. 2021;9(4):325.
- Visser M, Pahor M, Taaffe DR, et al. Relationship of interleukin-6 and tumor necrosis factor-alpha with muscle mass and muscle strength in elderly men and women: the health ABC study. J Gerontol A Biol Sci Med Sci. 2002;57(5):M326–M332.
- Chemama S, Bayar MA, Lanoy E, et al. Sarcopenia is associated with chemotherapy toxicity in patients undergoing cytoreductive surgery with hyperthermic ıntraperitoneal chemotherapy for peritoneal carcinomatosis from colorectal cancer. Ann Surg Oncol. 2016;23(12):3891–3898.
- Huiskamp LFJ, Chargi N, Devriese LA, et al. The predictive value of low skeletal muscle mass assessed on cross-sectional ımaging for anti-cancer drug toxicity: a systematic review and meta-analysis. JCM. 2020;9(11):3780.
- Tanimura K, Sato S, Fuseya Y, et al. Quantitative assessment of erector spinae muscles in patients with chronic obstructive pulmonary disease. Novel chest computed tomography-derived ındex for prognosis. Ann Am Thorac Soc. 2016;13(3):334–341.
- Canvasser LD, Mazurek AA, Cron DC, et al. Paraspinous muscle as a predictor of surgical outcome. J Surg Res. 2014;192(1):76–81.
- Choi H, Park YS, Na KJ, et al. Association of adipopenia at preoperative PET/CT with mortality in stage I non-small cell lung cancer. Radiology. 2021;301(3):645–653.
- Kinsey CM, San José Estépar R, van der Velden J, et al. Lower pectoralis muscle area Is associated with a worse overall survival in non-small cell lung cancer. Cancer Epidemiol Biomarkers Prev. 2017;26(1):38–43.