
Abstract
Background
Formal risk assessment is crucial for diabetes prevention. We aimed to establish a practical nomogram for predicting the risk incidence of prediabetes and prediabetes conversion to diabetes.
Methods
A cohort of 1428 subjects was collected to develop prediction models. The LASSO was used to screen for important risk factors in prediabetes and diabetes and was compared with other algorithms (LR, RF, SVM, LDA, NB, and Treebag). Multivariate logistic regression analysis was used to construct the prediction model of prediabetes and diabetes, and drawn the predictive nomogram. The performance of the nomograms was evaluated by receiver-operating characteristic curve and calibration.
Results
These findings revealed that the other six algorithms were not as good as LASSO in terms of diabetes risk prediction. The nomogram for individualized prediction of prediabetes included “Age,” “FH,” “Insulin_F,” “hypertension,” “Tgab,” “HDL-C,” “Proinsulin_F,” and “TG” and the nomogram of prediabetes to diabetes included “Age,” “FH,” “Proinsulin_E,” and “HDL-C”. The results showed that the two models had certain discrimination, with the AUC of 0.78 and 0.70, respectively. The calibration curve of the two models also indicated good consistency.
Conclusions
We established early warning models for prediabetes and diabetes, which can help identify prediabetes and diabetes high-risk populations in advance.
1. Introduction
In recent years, the number of person with diabetes has gradually increased, and it is one of the major public health problems in the world. Diabetes mellitus is usually subdivided into type 1 diabetes mellitus (T1DM) and type 2 diabetes mellitus (T2DM) [Citation1]. Among them, T2DM accounts for approximately 90% of total diabetes cases. Due to factors such as population aging, economic development, urbanization, unhealthy lifestyles, etc., DM is a growing public health burden in China, with an estimated prevalence rate of 11.6%, while the prevalence rate of prediabetes is about 50.1% [Citation2]. In recent years, various risk factors have emerged as potential conditions for predicting the risk or progression of DM, and personalized screening and risk prediction have received a lot of attention [Citation3–5]. The most commonly assessed risk predictors were age, gender, body mass index (BMI), high-density lipoprotein (HDL), and triglycerides hypertension [Citation3,Citation6–8]. Previous studies had proved that diabetes has a significant genetic tendency (heritability up to 90%), and the risk of diabetes in people with diabetes susceptibility genes is 5.9 times higher than that in normal people [Citation9]. In addition, the relevant research results showed that occupation, education level, annual household income, and other demographic sociological factors; overweight, elevated blood pressure, hypertension, dyslipidemia and other metabolic indicators; smoking, drinking, decreased physical activity, and other related life and physiological behaviors were closely related to the incidence of diabetes [Citation10–12]. Therefore, it is necessary to establish prediabetes and diabetes prediction model, which can not only greatly delay the occurrence of diabetes, but can also reduce diabetes complications, so as to improve the level of diabetes management.
In recent years, Cox proportional risk regression model, logistic regression model, gradient boosting machine (GBM) model, neural network model, EXtreme Gradient Boosting (XGBoost), Support Vector Machine (SVM), Random Forest (RF) and K-nearest neighbor (K-NN), and other models have been applied to predict the risk of diabetes [Citation3,Citation5,Citation13–15]. However, these methods also have limitations of varying degrees, such as over-fitting, falling into local minimum, and unsatisfactory prediction effect for unbalanced data. The least absolute shrinkage and selection operator (LASSO) is based on regression analysis methods, which select the most useful predictive features from the original data set by constructing a penalty function to the variable [Citation16]. Nonzero coefficient predictors of the coefficients were selected in the LASSO regression model to construct the subsequent diabetes risk prediction model.
Our aim in the present study is to establish and validate a multivariable prediction model that could predict the risk of prediabetes in the general population and prediabetes to diabetes. The model was re-fit using all variables with nonzero coefficients, which were selected by LASSO logistic regression. And compared it with logistic regression, RF, SVM, Latent Dirichlet allocation (LDA), Naive Bayes (NB), and Treebag in order to improve the prediction effect of existing models. On the basis of the results of LASSO and multivariate logistic regression screening, we established a prediction model to identify people at high risk for prediabetes and diabetes, and used nomogram to visualize the model. On the basis of these results, we developed a prediction nomogram to identify high-risk populations in advance. This may help to target intervention programs while avoiding the burden of prevention and treatment for nondisease populations.
2. Materials and methods
2.1. Study subjects
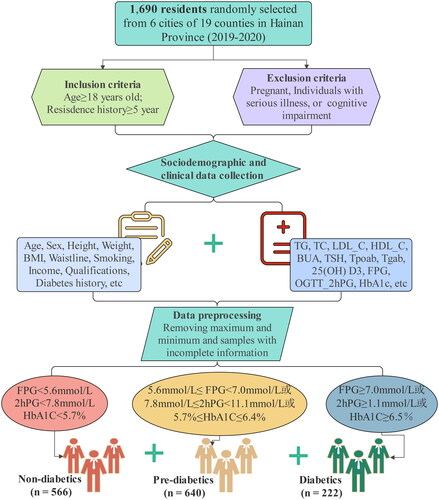
During 2019–2020, we surveyed 1690 residents who were randomly selected from 6 of 19 cities and counties in Hainan Province. All patients with diabetes were diagnosed according to the diagnostic criteria: fasting plasma glucose (FPG) ≥ 7.0 mmol/L, or 2-h postprandial blood glucose (2hPG) ≥ 1.1 mmol/L, or Hemoglobin A1C (HbA1C) ≥ 6.5%. The diagnostic criteria for prediabetes were 5.6 mmol/L ≤ FPG < 7.0 mmol/L, or 7.8 mmol/L ≤ 2hPG < 11.1 mmol/L, or 5.7% ≤ HbA1C ≤ 6.4%. Individuals with FPG < 5.6 mmol/L, 2hPG < 7.8 mmol/L, and HbA1C < 5.7% were considered as nondiabetic. A flow diagram of study participants in this study is summarized in . We selected residents with 18 years of age or older who had lived in the selected community for at least five years. Exclusion criteria: who were pregnant, or had a serious illness, or had cognitive impairment. The maximum and minimum values of clinical indicators, as well as samples with incomplete sociodemographic and clinical information were removed. A total of 262 participants were excluded and 1428 subjects, including 566 nondiabetics, 640 prediabetes patients, and 222 diabetes patients, were included in the final analysis.
Figure 1. Flowchart of study participants.
2.2. Sociodemographic and clinical variables
We collected sociodemographic and clinical variables information from questionnaire, physical examination, clinical, and laboratory testing. The questionnaire included gender (male or female), age (years old), education level, annual household income, salt intake, smoking status, and family history of diabetes (FH). Physical measurement mainly included the following: height (cm), weight (kg), waistline (cm), and BMI was calculated as weight (kg)/height (m2). Fasting venous blood was drawn from all subjects in the morning, which was then used to analyze fasting plasma glucose. The laboratory parameters, including FPG, 2hPG after oral glucose tolerance test (OGTT-2hPG), HbA1C, systolic blood pressure (SBP), diastolic blood pressure (DBP), triglyceride (TG), total cholesterol (TC), steroid, low-density lipoprotein cholesterol (LDL-C), high-density lipoprotein cholesterol (HDL-C), blood uric acid (BUA), thyroid-stimulating hormone (TSH), thyroid peroxidase antibody (Tpoab), anti-thyroglobulin antibodies (Tgab), urine iodine, vitamin D3, fasting proinsulin (Proinsulin_E), 2 h postprandial proinsulin (Proinsulin_F), insulin (Insulin_E), and 2 h postprandial insulin (Insulin_F) were measured using an automatic biochemical analyzer. The hypertension, hyperlipidemia, thyroid disease, and diabetes complications were determined according to the abovementioned blood biochemical indexes.
2.3. Variable definitions and groups
The potential risk factors in this study: gender, age, education level, annual household income, salt intake, smoking status, FH, hypertension, hyperlipidemia, thyroid disease, complications, BMI, waistline, TG, steroid, TC, LDL_C, HDL_C, BUA, TSH, Tpoab, Tgab, urine iodine, vitamin D3, Proinsulin_E, Proinsulin_F, Insulin_E, and Insulin_F. There are all 28 variables. Basic information of participants: gender included “male” and “female;” education level included “below senior high middle school” and “high school degree or above;” annual household income included “< 5000,” “5000–10,000,” “10000–30,000,” “30000–50,000,” “50000–100,000,” and “> 100,000;” salt intake included “mild,” “moderate,” “severe;” smoking status included “regular smoker,” “occasional smoker,” and “non-smoking;” whether had FH, hypertension, hyperlipidemia, thyroid disease, and diabetes complications; BMI group included “ultralow,” “overweight,” “obesity,” and “normal;” TG group included “< 0.56 mmol/L,” “> 1.70 mmol/L,” and “0.56–1.70 mmol/L;” TC group included “< 2.80 mmol/L,” “> 5.20 mmol/L,” and “2.80–5.20 mmol/L;” LDL-C group included “> 3.12 mmol/L” and “0–3.12 mmol/L;” HDL-C group included “< 0.90 mmol/L,” “> 1.55 mmol/L,” and “0.90–1.55 mmol/L;” TSH group included “< 0.27mU/L,” “> 4.20mU/L,” and “0.27–4.20mU/L;” urine iodine group included “iodine deficiency group < 100 μg/L,” “iodine overload group 200 ≤ urine iodine < 300 μg/L,” “iodine overdose group ≥ 300 μg/L,” and “iodine moderate group 100 ≤ urine iodineI < 200 μg/L;” vitamin D3 group included “sufficient acuity 30 ng/mL” and “insufficient or lacking < 30 ng/mL.”
2.4. Feature selection and prediction model development and validation
Applying the LASSO regression method, feature selection and predictive signature building was done. A simple random sampling method using a fixed ratio was used to balance the training and validation data sets; 70% of the patients were assigned to the training set and the remaining 30% were assigned to the validation set. LASSO regression shrinks the coefficient estimates toward zero, with the degree of shrinkage dependent on lambda (λ) value. To determine the optimal values for λ, we chose potential predictors of prediabetes and diabetes by choosing minimum λ criteria using10-time cross-validation [Citation17]. The risk factors selected by LASSO were analyzed by multiple logistic regression, and a diabetes prediction model was established. The score of risk factors was calculated by linear fitting weighted by their respective coefficients. Finally, the predictive nomograms were constructed by multivariate logistic regression using selected risk factors scores.
2.5. Evaluation of prediabetes and diabetes prediction models
The predictive performance of the constructed predictive models was evaluated by accuracy, sensitivity, and specificity, as well as receiver operating characteristic (ROC) curve and the area under the curve (AUC) value. The maximum of Youden’s index (sensitivity + specificity −1) was used to identify the best critical value of the prediction model. The larger the AUC is, the better the discriminative ability of the prediction model is. AUC < 0.7 is considered as poor discrimination, 0.7–0.8 indicates certain discrimination ability, and AUC > 0.8 indicates good discrimination ability. The calibration curve was integrated to evaluate the accuracy of the prediction model. Perfect calibration was indicated by a slope on the 45° line. In order to reflect the superiority of LASSO in the field of diabetes risk prediction, logistic regression, RF, SVM, LDA, NB, and Treebag prediction algorithms were selected to make a comparison with the LASSO.
2.6. Statistical analysis
Statistical analyses were performed using R software version 4.0.2 and Statistical Product Service Solutions (SPSS) version 25.0 (SPSS, Chicago, IL). Continuous variables were described as mean ± standard deviation (SD). Categorical data were presented as number (percentage). Pearson’s Chi-squared test was used for comparison of categorical variables. Mann–Whitney U test was used to evaluate the significant differences of continuous variables between groups. The odds ratio (OR) values and 95% confidence intervals (CIs) were used to express the independent predictive ability of the predictors. A two-sided p value .05 was considered statistically significant. The “glmnet’” (4.1-2) and “ggplot2’” packages in R were used for LASSO logistic regression. The “mlbench” and caret packages were used for logistic regression, SVM, RF, LDA, NB, and Treebag analysis. The “rms” package was used for nomogram and calibration plots. ROC curve analyses were conducted using the “pROC” packages. In addition, the nomogram was subjected to 1000 bootstrap resamples for internal validation to assess their predictive accuracies. Correlation analysis among different predictive factors was performed by “corrplot” package.
3. Results
3.1. Study population
A total of 1428 subjects were included in the cohort, of whom 566 (39.6%) were nondiabetic individuals, and 640 (44.8%) were prediabetic, and 222 (15.6%) were diabetes patients (). There were statistical differences between the nondiabetes group and the prediabetes group in terms of age, weight, BMI, waistline, education level, annual household income, FPG, OGTT-2hPG, HbA1C, SBP, DBP, TG, TC, LDL-C, HDL-C, BUA, TSH, Tpoab, vitamin D3, Proinsulin_E, Insulin_E, and Insulin_F (p < .05). Differences in age, gender, weight, BMI, waistline, annual household income, FH, FPG, OGTT-2hPG, HbA1C, SBP, TG, TC, HDL-C, Proinsulin_E, Proinsulin_F, and Insulin_E, between the prediabetes group and the diabetes group were statistically significant (p < .05). Moreover, statistically significant differences were found in age, gender, weight, BMI, waistline, education level, FPG, OGTT-2hPG, HbA1C, SBP, DBP, TG, TC, LDL-C, HDL-C, BUA, vitamin D3, Proinsulin_E, Proinsulin_F Insulin_E, and Insulin_F between the nondiabetes group and the diabetes group (p < .05).
Table 1. The sociodemographic and clinical characteristics of participants.
3.2. Correlation of different predictive factors
Spearman-based correlation tests showed correlation among 28 different risk predictors of prediabetes and diabetes. Blue dots indicated positive correlation and red dots indicated negative correlation (Figure S1). We found that the pairs steroid and TC (r = −0.73, p < .0001), Tpoad and thyroid disease (r = −0.61, p < .0001), LDL-C and TC (r = −0.65, p < .0001) had the highest negative correlation. Hyperlipidemia and TC (r = 0.70, p < .0001), LDL-C and steroid (r = 0.80, p < .0001), BMI and waistline (r = 0.67, p < .0001) had the highest positive correlation.
3.3. LASSO model results
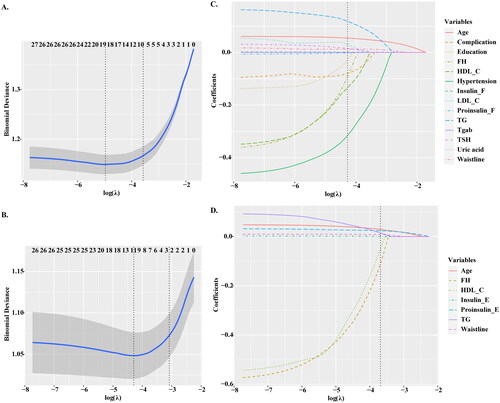
We conducted LASSO regression method to perform predictor selection. The optimal λ parameters in the LASSO regression model were selected through 10-fold cross validation. The LASSO coefficient profiles of the prediabetes and diabetes with nonzero coefficients were determined by the optimal lambda (λ) (). There are two dashed lines in the cross-validation diagram, one is the input value with the minimum Mean Square deviation and the other is the input value of the minimum Mean Squared Error. We take the geometric mean of the two as the λ value. When log (λ) = −4.27, 28 features were reduced to 14 potential predictors of prediabetes according to the LASSO regression method, including age, complication, education, FH, LDL-C, HDL-C, uric acid, waistline, hypertension, TG, TSH, Tgab, Insulin_F, and proinsulin_F (). When log (λ) = −3.55, 7 potential predictors of prediabetes to diabetes were screened, including age, FH, Waistline, TG, HDL-C, proinsulin_E, and Insulin_E ().
Figure 2. Feature selection based on LASSO model. (A–B) The ten time cross validation for tuning parameter selection in the LASSO model. The binomial deviance curve was plotted versus log (λ), where λ is the tuning parameter. (C–D) Plots for LASSO regression coefficients over different values of the penalty parameter. LASSO: least absolute shrinkage and selection operator.
3.4. Comparison with baseline
The experiment also compared the proposed model with the baseline models (logistic regression, SVM, RF, LDA, NB, and Treebag), as shown in and . It is not difficult to find that traditional machine learning algorithms were not as good as LASSO algorithms in terms of accuracy (0.740 and 0.701), AUC (0.695 and 0.783), and specificity (0.995 and 0.659) values.
Figure 3. Comparison of AUROC between LASSO model and other prediction algorithms. (A) AUROC for prediabetes models. (B) AUROC for diabetes models. AUROC: area under the receiver operating characteristic; AUC: area under the curve; LASSO: least absolute shrinkage and selection operator; RF: Random Forest; SVM: Support Vector Machine; LR: logistic regression; LDA: Latent Dirichlet allocation; NB: Naive Bayes.
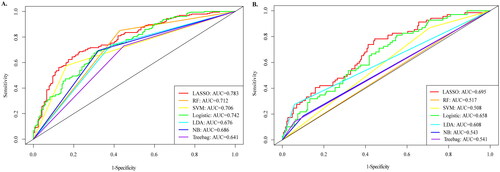
Table 2. Comparison of effects for each model.
3.5. Feature selection and prediction model development
The prediction model of prediabetes and diabetes disease was established by multivariate logistic regression of risk factors screened by LASSO. Analysis results identified age (OR = 3.91, 95%CI: 3.11–4.92, p < .001), Tgab (OR = 1.00, 95%CI: 0.99–1.01, p = .004), HDL-C (OR = 0.87, 95%CI: 0.75–1.00, p = .049), FH (OR = 0.68, 95%CI: 0.47–0.99, p = .044), TG (OR = 1.25, 95%CI: 1.09–1.45, p = .001), hypertension (OR = 0.56, 95%CI: 0.41–0.78, p < .001), Insulin_F (OR = 1.97, 95%CI: 1.65–2.35, p < .001), and proinsulin_F (OR = 0.87, 95%CI: 0.69–0.95, p = .010) as independent predictors for prediabetes. Meanwhile, the age (OR =2.66, 95%CI: 1.98–3.57, p < .001), FH (OR =0.59, 95%CI: 0.38–0.91, p = .018), HDL-C (OR =1.45, 95%CI: 1.29–1.63, p < .001), and proinsulin_E (OR =0.76, 95%CI: 0.61–0.95, p = .017) as independent predictors for prediabetes to diabetes mellitus (). Finally, prediabetes and diabetes prediction Nomograms were drawn (). By drawing a straight line vertically upward on the value axis of each predictor, the intersection point of the vertical line and the score axis is the score of this risk factor. The vertical projection points of the sum of the scores of each risk factor on the predicted probability axis are the predicted probability of prediabetes and diabetes.
Figure 4. Nomogram model for predicting prediabetes and diabetes. (A) Nomogram for predicting the risk of nondiabetes to prediabetes. (B) Nomogram for predicting the risk of prediabetes to diabetes. The value of each of variable was given a score on the point scale axis. A total score could be easily calculated by adding each single score and, by projecting the total score to the lower total point scale, we were able to estimate the probability of prediabetes and diabetes, respectively.
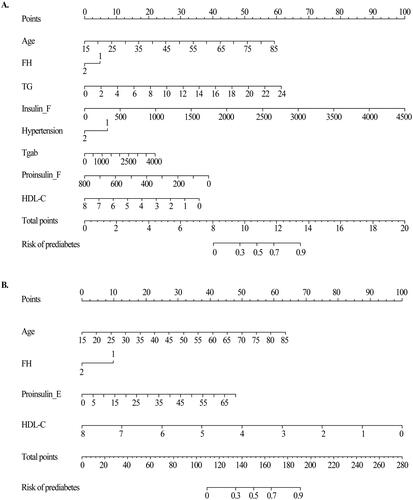
Table 3. Multivariate logistic regression in the prediabetics and diabetics model for optimal prediction factors selection.
3.6. Performance of the prediction model
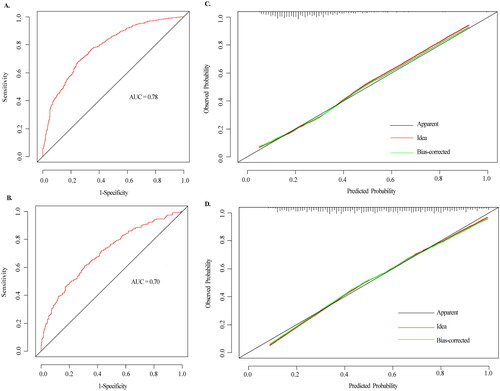
Calibration curves for the prediabetes and diabetes risk prediction models showed good agreement between prediction and observation. According to the ROC evaluation of the two nomograms models, the models also exhibited reasonable discrimination, with an AUC value of 0.78 and 0.70, respectively (). The performance of the nomogram was internally validated with Bootstrap resampling (1000 times) analysis, which showed that the prediabetes and diabetes probabilities predicted by the nomogram agreed well with the actual probabilities. In other words, this model had a high prediction accuracy. A calibration curve of the nomogram is presented in .
Figure 5. The ROC curves and calibration curves of the nomogram. (A–B) The ROC curves of the nomogram model of prediabetes and diabetes, respectively. The x-axis represents 1-specifcity, and the y-axis represents sensitivity. The part below the green line is the area under the ROC curve of the model. (C–D) Calibration curves of the nomogram. The x-axis represents the predicted probability of prediabetes and diabetes, respectively. The y-axis represents the actual diagnosed of prediabetes and diabetes, respectively. The red dashed line represents the perfect prediction with the same predicted probability as the actual probability. The black dashed line represents the performance of the nomogram and the green solid line represents the performance of the model after calibration. The closer the calibration curve of the model is to the yellow dashed line, the better the model prediction is represented.
4. Discussion
Prior to model construction, we used the LASSO regression method in machine learning to screen 28 risk factors affecting the development of prediabetes and diabetes. According to the screening results, we developed the utility of the nomogram model based on multiple logistic regression to predict the risk of prediabetes in healthy people and the risk of diabetes in prediabetes. Furthermore, the nomogram was subjected to 1000 bootstrap resamples for internal validation to assess their predictive accuracies. Early detection of prediabetes and diabetes patients, thus early intervention, early treatment, can effectively delay the process of the disease, reduce the occurrence of related complications, and ultimately improve the quality of life of patients.
Diabetes is a chronic metabolic disease. Due to the lack of understanding of the disease or the absence of symptoms of diabetes, nearly one-third of diabetes patients do not understand their own status [Citation18]. In the past 20 years, with the rapid progress of science and technology and the rapid development of social economy, China has now become the country with the largest number of person with diabetes in the world. A 1987–2019 Chinese Urban and Rural diabetes mortality survey showed that the age-standardized diabetes mortality increased by about 38.5% in urban areas and 254.9% in rural areas during the entire study period [Citation19]. In addition, uncontrolled diabetes will also lead to the occurrence of numerous complications [Citation20, Citation21], including retinopathy, coronary heart disease, high blood pressure, and nonalcoholic fatty liver disease, which will bring enormous economic pressure to patients and their families. Thus, it is very important to identify and screen prediabetes and diabetes high-risk groups. Implementing early lifestyle intervention strategies to prevent diabetes has resulted in a low rate of conversion from prediabetes to diabetes.
In order to reduce the impact of diabetes on patients, several teams have used different methods to build diabetes prediction models, including machine learning and artificial intelligence (AI) [Citation22, Citation23]. Compared with previous diabetes prediction models, the model constructed in this study firstly used the LASSO-logistics method to estimate the relationship between risk predictors and diabetes. The regularized LASSO method is a method to manage over-fitting and variable selection, which is more suitable for complex and variable factors. It is a deep learning algorithm that has been widely used in the construction of many disease prediction models [Citation16, Citation17]. The L1 norm of the coefficients was added to the function as a penalty term, and the sum of squares of residuals was minimized. A subset of predictors was selected and an interpretable logistic regression model was provided [Citation24].
The 28 candidate predictors were reduced to 14 and 7 potential predictors by examining the predictors-prediabetes and diabetes association by shrinking the regression coefficients with the LASSO method. Compared with the baseline models (logistic regression, RF, SVM, LDA, NB, and Treebag), the LASSO model performed better. Then, selected subset of predictors was incorporated into the multivariate logistic regression analysis and a nomogram was used to simplify the parameters in the model presentation. Results showed that age, Tgab, HDL-C, FH, TG, hypertension, Insulin_F, and proinsulin_F were predictors of normal to prediabetes, while FH, HDL-C, and proinsulin_E were predictors of prediabetes to diabetes. The AUC indexes of prediabetes and diabetes prediction models are 0.78 and 0.70, respectively, indicating that the model has reasonable performance.
In recent years, several diabetes-prediction models have also been developed in various populations around the world. A cohort study showed that the Cambridge model has been applied successfully to identify individuals with a higher risk of T2DM during follow-up [Citation25]. On the basis of demographic, lifestyle and simple anthropometric measures, AUSDRISK developed and validated a diabetes risk assessment tool for Australia [Citation26]. The most common predictors in these models were age, sex, family history of diabetes, waistline, body mass index and smoking status, use of antihypertensive medications, and physical inactivity [Citation3, Citation4, Citation6]. However, waistline, body mass index and smoking status were not independent risk factors for prediabetes and diabetes in our study. We considered that the biological disparity between the baseline and outcome is not large enough for minor variables to be identified as independent risk factors.
There is a direct positive correlation between increase in age and the incidence of diabetes. On the one hand, it may be related to the aging decline of human body function with the increase of age, and the cell apoptosis in the body can cause the disorder of glucose metabolism. A study of diabetes in a Mexican population, followed for seven years, suggests that elevated blood pressure independently induces impaired glucose metabolism, leading to prediabetes [Citation27]. On the other hand, it may be due to the decrease of activity with increase in age, and the slowdown of basic metabolism, which leads to weight gain [Citation28]. The analysis of cohort studies conducted by Wang Chao et al. [Citation29] further pointed out that the risk of diabetes in obese people is nearly four times higher than that in normal people. In addition, dyslipidemia is an important risk factor of glucose metabolism disorder. According to current literature studies, it is relatively certain that elevated TG level is a marker of high risk of diabetes. High levels of HDL-C have a protective effect on blood glucose balance, which in turn protects against the development of diabetes [Citation30]. This is consistent with our results.
Our study has several flaws. First, all the patients in this study are from 6 of 19 cities and counties in Hainan Province and the sample size is insufficient, negative results may be produced. Therefore, in order to increase the reliability of the model, it is necessary to randomly select a larger sample of patients in Hainan Province. Secondly, the relevant factors included in this study couldn’t include all potential factors related to prediabetes, the patient information input into the model needs to be further improved. More importantly, our predictive models have performed well in internal validation, but further evaluation of model effectiveness in external queues is needed.
5. Conclusions
In conclusion, this study screened risk factors for diabetes based on LASSO regression and established an effective prediction model for prediabetes conversion to diabetes. Our model could be used as a simple, fast, cost-effective tool to identify individuals who are at high risk of prediabetes and diabetes.
Ethical approval and consent to participate
All participants were informed in writing and verbally of the procedures and purpose of the study and signed informed consent document. Study protocols were approved by the Ethical Committee of the First Affiliated Hospital of Hainan Medical University, and complied with the ethical standards of the Ethical Committee and World Medical Association Declaration of Helsinki. All research analyses were carried out in accordance with the approved guidelines and regulations.
Author contribution
Huibiao Quan: Conceptualization, Methodology, Software. Leweihua Lin and Danhong Lin: Data curation. Danhong Lin: Visualization, Investigation. Kaining Chen: Software, Validation.Qianying Ou and Wei Jin: Writing-Original draft preparation, Writing-Reviewing and Editing.
Supplemental Material
Download TIFF Image (3 MB)Acknowledgments
The authors are grateful to the case and control volunteers in the study. The authors also thank to the clinicians and hospital staff who contributed to the sample and data collection for our study.
Disclosure statement
No potential conflict of interest was reported by the authors.
Additional information
Funding
References
- Association AD. Classification and diagnosis of diabetes: standards of medical care in diabetes-2020. Diabetes Care. 2020;43(Suppl 1):S14–s31.
- Akın S, Bölük C. Prevalence of comorbidities in patients with type-2 diabetes mellitus. Prim Care Diabetes. 2020;14(5):431–434.
- Lai H, Huang H, Keshavjee K, et al. Predictive models for diabetes mellitus using machine learning techniques. BMC Endocr Disord. 2019;19(1):101.
- Cahn A, Shoshan A, Sagiv T, et al. Prediction of progression from prediabetes to diabetes: development and validation of a machine learning model. Diabetes Metab Res Rev. 2020;36(2):e3252.
- Zueger T, Schallmoser S, Kraus M, et al. Machine learning for predicting the risk of transition from prediabetes to diabetes. Diabetes Technol Ther. 2022;24(11):842–847.
- Deberneh HM, Kim I. Prediction of type 2 diabetes based on machine learning algorithm. IJERPH. 2021;18(6):3317.
- Shao X, Wang Y, Huang S, et al. Development and validation of a prediction model estimating the 10-year risk for type 2 diabetes in China. PLoS One. 2020;15(9):e0237936.
- Yang J, Wang X, Jiang S. Development and validation of a nomogram model for individualized prediction of hypertension risk in patients with type 2 diabetes mellitus. Sci Rep. 2023;13(1):1298.
- Bjørnholt JV, Erikssen G, Liestøl K, et al. Type 2 diabetes and maternal family history: an impact beyond slow glucose removal rate and fasting hyperglycemia in low-risk individuals? Results from 22.5 years of follow-up of healthy nondiabetic men. Diabetes Care. 2000;23(9):1255–1259.
- Hyun MK, Park JH, Kim KH, et al. Incidence and risk factors for progression to diabetes mellitus: a retrospective cohort study. IJERPH. 2021;19(1):123.
- Iheanacho CO, Osoba DO, Eze UI. Evaluation of predominant risk factors for type 2 diabetes mellitus among out-patients in two Nigerian secondary health facilities. Afr. Health Sci. 2021;21(2):693–701.
- Grundlingh N, Zewotir TT, Roberts DJ, et al. Assessment of prevalence and risk factors of diabetes and prediabetes in South Africa. JHPN. 2022;41(1):7.
- Rezaee M, Putrenko I, Takeh A, et al. Development and validation of risk prediction models for multiple cardiovascular diseases and type 2 diabetes. PLoS One. 2020;15(7):e0235758.
- Wang L, Wang X, Chen A, et al. Prediction of type 2 diabetes risk and its effect evaluation based on the XGBoost model. Healthcare (Basel, Switzerland). 2020;8(3):247.
- Ragab M, Al-Ghamdi ASA, Fakieh B, et al. Prediction of diabetes through retinal images using deep neural network. Comput Intell Neurosci. 2022;2022:7887908.
- McEligot AJ, Poynor V, Sharma R, et al. Logistic LASSO regression for dietary intakes and breast cancer. Nutrients. 2020;12(9):2652.
- Kang J, Choi YJ, Kim IK, et al. LASSO-based machine learning algorithm for prediction of lymph node metastasis in T1 colorectal cancer. Cancer Res Treat. 2021;53(3):773–783.
- Choi SB, Kim WJ, Yoo TK, et al. Screening for prediabetes using machine learning models. Comput Math Methods Med. 2014;2014:618976.
- Su B, Wang Y, Dong Y, et al. Trends in diabetes mortality in urban and rural China, 1987–2019: a joinpoint regression analysis. Front Endocrinol (Lausanne). 2021;12:777654.
- Cole JB, Florez JC. Genetics of diabetes mellitus and diabetes complications. Nat Rev Nephrol. 2020;16(7):377–390.
- Ceriello A, Prattichizzo F. Variability of risk factors and diabetes complications. Cardiovasc Diabetol. 2021;20(1):101.
- Zou Q, Qu K, Luo Y, et al. Predicting diabetes mellitus with machine learning techniques. Front Genet. 2018;9:515.
- Buch V, Varughese G, Maruthappu M. Artificial intelligence in diabetes care. Diabet Med. 2018;35(4):495–497.
- Guo P, Zeng F, Hu X, et al. Improved variable selection algorithm using a LASSO-Type penalty, with an application to assessing hepatitis B infection relevant factors in community residents. PLoS One. 2015;10(7):e0134151.
- Rahman M, Simmons RK, Harding AH, et al. A simple risk score identifies individuals at high risk of developing type 2 diabetes: a prospective cohort study. Fam Pract. 2008;25(3):191–196.
- Chen L, Magliano DJ, Balkau B, et al. AUSDRISK: an Australian type 2 diabetes risk assessment tool based on demographic, lifestyle and simple anthropometric measures. Med J Aust. 2010;192(4):197–202.
- Tsimihodimos V, Gonzalez-Villalpando C, Meigs JB, et al. Hypertension and diabetes mellitus: coprediction and time trajectories. Hypertension. 2018;71(3):422–428.
- Alperet DJ, Lim WY, Mok-Kwee Heng D, et al. Optimal anthropometric measures and thresholds to identify undiagnosed type 2 diabetes in three major Asian ethnic groups. Obesity (Silver Spring). 2016;24(10):2185–2193.
- Qin L, Corpeleijn E, Jiang C, et al. Physical activity, adiposity, and diabetes risk in middle-aged and older Chinese population: the Guangzhou biobank cohort study. Diabetes Care. 2010;33(11):2342–2348.
- Bhowmik B, Siddiquee T, Mujumder A, et al. Serum lipid profile and its association with diabetes and prediabetes in a rural bangladeshi population. Int J Environ Res Public Health. 2018;15(9):1944.