
Abstract
This study aimed to investigate the associations between body mass index (BMI), waist circumference (WC), 25-hydroxy-vitamin D3 (25-OH-D3), and the risk of pre-diabetes mellitus (PDM), as well as their predictive values in identifying PDM. A total of 1688 participants were included in this cross-sectional investigation. Spearman’s correlation analysis was used to assess the relationships between candidate indicators and PDM. The impact of indicators on PDM risk was determined by multivariate logistic regression. The receiver operating characteristic (ROC) analysis was performed to evaluate the prognostic value of indicators. Our study indicated a positive correlation between WC, BMI, and 25-OH-D3 and PDM. WC (OR = 1.05, 95% CI = 1.04–1.06, p < 0.001), BMI (OR = 1.11, 95% CI = 1.08–1.15, p < 0.001), and 25-OH-D3 (OR = 1.01, 95% CI = 1.00–1.02, p = 0.037) and an increased risk of PDM. Additionally, the ROC analysis demonstrated that WC (AUC = 0.651, Specificity = 55.00%, Sensitivity = 67.900%) had a higher diagnostic value for predicting PDM compared to the other variables (BMI, 25-OH-D3, TG, TC, LDL-C, HDL-C, and UA). A cut-off value of WC > 80.5 cm predicted PDM with both good sensitivity and specificity. Additionally, the cut-off value of waist circumference (WC) for men with prediabetes was 86.500, while for women with prediabetes, it was 76.500.
1. Introduction
Type 2 diabetes mellitus (T2DM) is a group of metabolic disorders characterized by elevated blood glucose levels. Individuals with T2DM are at an elevated risk of developing various severe health complications, which can lead to diminished quality of life and increased mortality [Citation1]. The prevalence of T2DM has been rapidly increasing over the past few decades. According to data from the International Diabetes Federation (IDF), an estimated 425 million cases of diabetes were diagnosed in 2017 among adults aged 20 to 79 years. Furthermore, the number of individuals living with T2DM is predicted to increase to 629 million by 2045 [Citation2]. In China, the number of adults with diabetes exceeded 113.9 million, while 493.4 million adults were diagnosed with pre-diabetes Mellitus (PDM) in 2011 [Citation3]. PDM, as known as impaired glucose regulation (IGR), represents a critical stage of abnormal glucose metabolism that falls between normal glucose metabolism and T2DM [Citation4]. Implementing effective preventive measures of PDM can significantly mitigate the risk of developing T2DM [Citation5].
Previous studies have established a clear association between obesity and an elevated risk of metabolic disease, including T2DM [Citation6–8]. Body mass index (BMI) and waist circumference (WC) are crucial parameters used in defining obesity. BMI has commonly been used as a measure of overall obesity, reflecting total body fat. Excessive accumulation of adipose tissue in particular body regions has been reported to contributed to metabolic complications [Citation8]. Over the past few decades, various studies have consistently demonstrated that excess fat distribution is associated with an unfavorable body shape phenotype [Citation9]. Measuring waist circumference (WC) provides the most straightforward indication of central obesity, which is closely associated with PDM. Additionally, recent research has reported a negative association between 25-hydroxy-vitamin D3 (25-OH-D3), a fat-soluble vitamin, and adiposity phenotypes [Citation10]. Furthermore, mounting evidence suggests that low levels of 25-OH-D3 can serve as a potential biochemical marker for diagnosing T2DM [Citation11].
Based on the aforementioned statement, BMI, WC, and 25-OH-D3 are potential indicators for diagnosing PDM. Nevertheless, there is limited data comparing obesity-related measures (BMI, WC) and 25-OH-D3 in the diagnosis of PDM in the Chinese population. To address this question, we conducted a study to investigate the associations between the aforementioned measures and assessed the impact of these potential indicators on the risk of PDM. Furthermore, we assessed the diagnostic value of these indicators in identifying individuals with PDM.
2. Methods
2.1. Ethics committee statement
This cross-sectional study was conducted in accordance with the principles outlined in the Declaration of Helsinki and received approval from the Ethics Committee of Hainan General Hospital. Prior to participating in this study, all participants provided written informed consent.
2.2. Characteristics of the study subjects
Between June 2018 to November 2018, a total of 1688 participants (aged 18–83 years) were randomly recruited from the Hainan General Hospital to undergo a 75-g oral glucose tolerance test (OGTT), The participants included 616 males and 1072 females. All participants were Chinese Han adults who had been residents of Hainan province for a minimum of 5 years. This study adhered to the following exclusion criteria: a diagnosis of any other type of diabetes (such as hereditary diabetes, gestational diabetes, etc.); hypertension; severe metabolic disease (such as hyperuricemia and Cushing’s syndrome); malignant tumor and cardiovascular diseases. The participants were classified into PDM and non-PDM groups based on the diagnostic criteria for PDM outlined by the American Diabetes Association (ADA) in 2010. PDM was defined as 5.6 mmol/L ≤ fasting plasma glucose (FPG) < 7.0 mmol/) or OGTT 2h PG 7.8 mmol/L ≤ 2hPG < 11.1 mmol/L or 5.7% ≤ HbA1C < 6.4%.
2.3. Measurement of anthropometry and metabolic characteristics
Trained investigators measured the body mass parameters, including height, weight, and WC, of all participants three times under standardized conditions. BMI was calculated by dividing weight (kg) by the square of height (in meters) (kg/m2). Additionally, blood samples were collected from participants after an overnight fasti using vacuum tubes for analysis with an automatic biochemical analyzer (Hitachi 7060, Tokyo). The clinical characteristics assessed in this study included FPG, OGTT-2-h postprandial blood (OGTT-2hPG), triglycerides (TG), total cholesterol (TC), low-density lipoprotein cholesterol (LDL-C), and high-density lipoprotein cholesterol (HDL-C), and uric acid (UA). HbA1C levels were determined using high-performance liquid chromatography. In addition, serum levels of 25-OH-vitamin D3 (25-OH-D3) were analyzed using the E601 modular analyzer (Roche Diagnostics, Mannheim, Germany).
2.4. Statistical analysis
Statistical analysis was performed using SPSS 20.0 software. The demographic differences between cases and controls were analyzed by using the student’s t-test or χ2 test. Spearman’s correlation analysis was conducted to evaluate the interrelationship between clinical/biochemical variables and PDM. Furthermore, the impact of clinical/biochemical variables on PDM was analyzed using multivariate logistic regression analyses. Receiver operating characteristic (ROC) curves were utilized to evaluate the diagnostic performance of the different variables in predicting PDM, including sensitivity, specificity, and optimal cut-off value. The area under the ROC curve (AUC) was calculated to compare the diagnostic abilities of different variables in predicting PDM. An AUC value less than 0.500 was considered as unable to discriminate patients with PDM. The p < 0.05 indicates statistical significance.
3. Results
3.1. Characteristics of the study participants
presents the clinical and biochemical characteristics of the participants. This study included 718 cases of PDM and 970 non-PDM individuals. The mean ± standard deviation values of all characteristics were listed. In the non-PDM group, the mean age was 44.24 ± 12.87 years old, while in the PDM group, was 53.62 ± 12.43 years old. Significant differences were observed between the cases and controls in terms of in age (p < 0.001), gender (p = 0.003), BMI (p < 0.001), WC (p < 0.001), 25-OH-D3 (p = 0.036), HbA1c (p < 0.001), 2hPG (p < 0.001), FPG (p < 0.001), TG (p < 0.001), TC (p < 0.001), LDL-C (p < 0.001), HDL-C (p < 0.001), and UA (p < 0.001). Furthermore, we documented the presence of diabetes, hypertension, hyperlipidemia, gout, and hyperuricemia as complications in both the case and control groups.
Table 1. Characteristics of patients with pre-diabetes mellitus by HbA1c level.
3.2. Correlation analysis of indicators and PDM
The correlation analysis between the indicators and PDM is presented in . WC, BMI, and 25-OH-D3 were all positively associated with HbA1c (WC: r = 0.283, p < 0.001; BMI: r = 0.226, p < 0.001; 25-OH-D3: r = 0.072, p = 0.003), FPG (WC: r = 0.247, p < 0.001; BMI: r = 0.225, p < 0.001; 25-OH-D3: r = 0.154, p < 0.001), and 2hPG (WC: r = 0.305, p < 0.001; BMI: r = 0.284, p < 0.001; 25-OH-D3: r = 0.055, p = 0.026), respectively. Moreover, gender and HDL-C exhibited negative correlations with HbA1c (gender: r = −0.063, p = 0.009; HDL-C: r = −0.065, p = 0.008) and 2hPG (gender: r = −0.058, p = 0.019; HDL-C: r = −0.078, p = 0.001), respectively, while no correlation was found between these variables and FPG. Furthermore, Age, TG, TC, and LDL-C were all positively related to HbA1c, FPG, and 2hPG, respectively.
Table 2. The spearman’s association analysis among indicators in pre-diabetes mellitus.
3.3. The influence of the indicators on PDM risk
The impact of these indicators on PDM risk was examined, and the results are presented in . The data indicated significant associations between gender (OR = 1.37, 95% CI = 1.12–1.67, p = 0.002), TG (OR = 1.39, 95% CI = 1.27–1.53, p < 0.001), TC (OR = 1.42, 95% CI = 1.29–1.56, p < 0.001), LDL-C (OR = 1.49, 95% CI = 1.33–1.68, p < 0.001), WC (OR = 1.05, 95% CI = 1.04–1.06, p < 0.001), BMI (OR = 1.11, 95% CI = 1.08–1.15, p < 0.001), and 25-OH-D3 (OR = 1.01, 95% CI = 1.00–1.02, p = 0.037) and an increased risk of PDM. Conversely, HDL-C (OR = 0.58, 95% CI = 0.43–0.78, p < 0.001) exhibited a protective effect against PDM when stratified by HbA1c levels. Stratified by FPG, the analysis revealed that TG (OR = 1.16, 95% CI = 1.08–1.24, p < 0.001), TC (OR = 1.30, 95% CI = 1.18–1.44, p < 0.001), LDL-C (OR = 1.29, 95% CI = 1.14–1.47, p < 0.001), WC (OR = 1.04, 95% CI = 1.03–1.05, p < 0.001), BMI (OR = 1.09, 95% CI = 1.06–1.13, p < 0.001) and 25-OH-D3 (OR = 1.02, 95% CI = 1.01–1.03, p < 0.001) were significantly associated with an increased the risk of PDM. Furthermore, gender (OR = 1.37, 95% CI = 1.11–1.68, p = 0.003), TC (OR = 1.30, 95% CI = 1.19–1.43, p < 0.001), LDL-C (OR = 1.30, 95% CI = 1.15–1.46, p < 0.001), UA (OR = 1.00, 95% CI = 1.00–1.01, p < 0.001), WC (OR = 1.05, 95% CI = 1.04–1.06, p < 0.001), BMI (OR = 1.11, 95% CI = 1.08–1.15, p < 0.001), and 25-OH-D3 (OR = 1.01, 95% CI = 1.00–1.02, p = 0.044) were found to increase the risk of PDM, while HDL-C was associated with a decreased risk of PDM (OR = 0.59, 95% CI = 0.43–0.80, p = 0.001). At these analyses, gender, TC, LDL-C, HDL-C, BMI, WC, and 25-OH-D3 were identified as the main factors associated with PDM when considering HbA1c. When considering FPG, the main factors were TG, TC, LDL-C, BMI, WC, and 25-OH-D3. Lastly, for 2hPG, the main factors were gender, TC, LDL-C, HDL-C, UA, BMI, WC, and 25-OH-D3.
Table 3. Risk factors for pre-diabetes mellitus by multivariate logistic regression analysis.
3.4. Diagnostic accuracy of indicators for PDM
ROC curves were generated to identify the significant parameters that predict PDM. The results presented in and indicate that WC (AUC = 0.635, Specificity = 54.7%, Sensitivity = 65.4%, cut-off value = 80.5) exhibited a higher diagnostic value compared to the other parameters, including gender, TC, LDL-C, HDL-C, BMI, and 25-OH-D3). In terms of FPG, WC (AUC = 0.623, Specificity = 52.100%, Sensitivity = 67.900%, cut-off value = 80.5) demonstrated a superior diagnostic value in predicting PDM compared to the other parameters (TG, TC, LDL-C, BMI, and 25-OH-D3) (). illustrated that WC (AUC = 0.651, Specificity = 55.00%, Sensitivity = 67.900%, cut-off value = 80.5) had a superior diagnostic value for predicting PDM when stratified by 2hPG compared to the other variables (gender, TC, LDL-C, HDL-C, UA, BMI, and 25-OH-D3). In summary, our study demonstrated that WC exhibited good sensitivity and specificity in diagnosing PDM. Due to significant variations in waist circumference (WC) between men and women, we conducted further analysis to determine the critical threshold of waist circumference (WC) for both genders in pre-diabetic patients. As shown in , the cut-off value of waist circumference (WC) for men with prediabetes was 86.500 (AUC = 0.608, Specificity = 60.443, Sensitivity = 55.556), while for women with prediabetes, it was 76.500 (AUC = 0.645, Specificity = 51.189, Sensitivity = 71.256).
Figure 1. ROC curves for the factors associated with HbA1c (A), FPG (B), and 2hPG (C) in prediabetes. FPG: Fasting plasma glucose; HbA1c: glycosylated hemoglobin; 2hPG: 2-hour postprandial blood glucose; TG: triglyceride; TC: total cholesterol; HDL-C: high-density lipoprotein cholesterol; LDL-C: low-density lipoprotein cholesterol; UA: uric acid; BMI: body mass index; WC: Waist circumference.
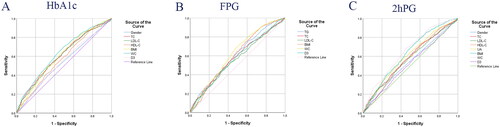
Table 4. The impact of indicators on pre-diabetes mellitus diagnosis.
4. Discussion
In this study, we found a significant positive association between WC, BMI, and 25-OH-D3 and the risk of prediabetes in the Chinese Han population. Notably, WC exhibited a higher diagnostic value than the other indicators, suggesting that WC may be a reliable diagnostic indicator for PDM.
Due to the rapid economic growth in China, the population’s nutritional status has been gradually changing, contributing to an increase in obesity prevalence [Citation12]. While obesity has been recognized as a risk factor for T2DM, unfortunately, T2DM often remains undetected until patients present with diabetic complications. Anthropometric measures off a simple and useful method for screening T2DM. Therefore, utilizing anthropometric measures is an alternative method for general practitioners to assess their patients’ risk, especially in rural areas [Citation13]. Previous studies have shown inconsistent result when comparing WC, BMI, and other anthropometrics indicators, particularly in the Chinese population, with limited studies focused on PDM [Citation14,Citation15]. In this study, we investigated the association between these indicators and the risk of PDM in the Chinese Han population using spearman’s correlation analysis and logistic regression analysis. Our findings revealed that both BMI and WC were significantly correlated with the risk of PDM. These results are consistent with the findings of Christa Meisinger, et al. in Augsburg, German, which indicated that both BMI and WC could be reliable predictors of T2DM [Citation16]. Overall, BMI and WC appear to be potential risk factor for diagnosing PDM in the Chinese population.
Previous studies have reported that a low circulating concentration of vitamin D, measured as a 25-OH-D3, is a significant risk factor for obesity, insulin resistance, T2DM, and metabolic syndrome [Citation17]. Furthermore, a cross-section study has demonstrated an inverse association between vitamin D and impaired glucose tolerance; however, some studies have not replicated these findings [Citation18]. From a biological perspective, the presence of vitamin D receptor (VDR) in various cell types and organs, including β-pancreatic cells, suggests that it may exert both direct effects (through VDR activation) and indirect effects (via the regulation of calcium homeostasis) on multiple mechanisms involved in the pathophysiology of T2DM [Citation19,Citation20]. However, our study revealed a positive association between 25-OH-D3 levels and the risk of PDM. These findings contrast with a study by Aleksandra et al., which reported no association between 25-OH-D3 levels and the risk of PDM in the US civilian population, but suggested a significant increase in the risk of T2DM [Citation21]. Conversely, a separate study suggested that lower levels of 25-OH-D3 are associated with an increased risk of T2DM in Japanese adults, particularly in individuals with PDM [Citation22]. Overall, the predictive effect of 25-OH-D3 on PDM remains contentious. This inverse association may be influenced by various factors, including aging, decreased physical activity, changes in dietary habits, and regional differences.
Sensitivity and specificity are fundamental concepts in clinical research and decision modeling. The plot of sensitivity versus 1-specificity is known as the receive operating characteristic (ROC) curve. The area under the curve (AUC), which is considered an effective measure of accuracy with a meaningful interpretation, has been widely used [Citation23]. The ROC curve plays a crucial role in evaluating the diagnostic ability of indicators, determining the optimal cut-off values, and comparing alternative diagnostic measures within the same subjects [Citation24]. Therefore, we analyzed the diagnosis value of BMI, WC, and 25-OH-D3 using the ROC curve. Notably, the diagnostic value of WC (AUC = 0.651) was higher than that of the other indicators. In a cross-cohort study conducted among the Indian population, including 83 pre-diabetic patients and 84 normal controls, waist circumference (WC) was identified as a predictive indicator of pre-diabetes, with an AUC of 0.702 [Citation25]. Due to significant variations in WC between men and women, we further analyzed to determine the critical threshold of WC for each gender in pre-diabetic patients. Our findings demonstrated that in men with prediabetes, the AUC of WC was 0.608 (cut-off = 86.5), while in women with prediabetes, it was 0.645 (cut-off = 76.500). Similar to our study, Gu et al. showed that WC had the highest AUC value of 0.605 (cut-off = 88.5) in prediabetic men and 0.673 (cut-off = 75.5) in prediabetic women [Citation26]. These findings suggest that WC could be a reliable predictor of PDM. This finding contributes valuable evidence to support WC as a predictive indicator of PDM.
Our study has several potential limitations. First, previous studies have reported variations in WC and BMI among Chinese individuals across different regions. According to these studies, individuals living in northern areas of China tend to have larger WC and BMI compared to those in the eastern, western, and southern regions [Citation27]. The participants in our study are primarily recruited from Hainan province, which may limit the generalizability of our findings to the entire Chinese population. Second, due to the limited data availability, we were unable to analyze all anthropometric measures associated with obesity in predicting diabetes mellitus. Third, in future studies, we plan to collect comprehensive information on vitamin D intake from diet, supplements, or medications to better control for potential impacts on vitamin D levels and improve the robustness of our findings. Despite these limitations, our study identifies a potential marker for diagnosing PDM.
5. Conclusion
In conclusion, our results demonstrated a significant correlation between WC, BMI, and 25-OH-D3 levels with an increased risk of PDM. Notably, WC exhibited a significantly higher diagnostic value compared to the other indicators. These findings provide valuable information for the diagnosis and management of prediabetes.
Ethics approval and consent to participate
This cross-sectional study was conducted by the Declaration of Helsinki and approved by the Ethics Committee of Hainan General Hospital. Written informed consent was obtained from all individual participants included in the study.
Author contributions
Qianying Ou and Jinwen Yu: drafted the work or revised it critically for important content; Leweihua Lin: performed the experiments; Danhong Lin and Kaining Chen: analyzed the data and prepared figures and tables; Huibiao Quan: conceived and designed the experiments. All authors have read and approved the manuscript.
Acknowledgments
We thank all participants in this study. We also thank Hainan General Hospital for their help with sample collections.
Disclosure statement
All authors declare that they have no competing interests.
Data availability statement
The datasets generated and/or analyzed in the current study cannot be made public due to the potential for subsequent analysis of the data but may be obtained from the corresponding authors upon reasonable request.
Additional information
Funding
References
- Vijan S. Type 2 diabetes. Ann Intern Med. 2019;171(9):Itc65–itc80. doi:10.7326/AITC201911050.
- Cho NH, Shaw JE, Karuranga S, et al. IDF diabetes atlas: global estimates of diabetes prevalence for 2017 and projections for 2045. Diabetes Res Clin Pract. 2018;138:271–281. doi:10.1016/j.diabres.2018.02.023.
- Xu Y, Wang L, He J, et al. Prevalence and control of diabetes in chinese adults. Jama. 2013;310(9):948–959. doi:10.1001/jama.2013.168118.
- Yudkin JS, Montori VM. The epidemic of pre-diabetes: the medicine and the politics. BMJ. 2014;349:g4485. doi:10.1136/bmj.g4485.
- Roberts S, Barry E, Craig D, et al. Preventing type 2 diabetes: systematic review of studies of cost-effectiveness of lifestyle programmes and metformin, with and without screening, for pre-diabetes. BMJ Open. 2017;7(11):e017184. doi:10.1136/bmjopen-2017-017184.
- Engin A. The definition and prevalence of obesity and metabolic syndrome. Adv Exp Med Biol. 2017;960:1–17. doi:10.1007/978-3-319-48382-5_1.
- Liang X, Chen X, Li J, et al. Study on body composition and its correlation with obesity: a cohort study in 5121 Chinese han participants. Medicine. 2018;97(21):e10722. doi:10.1097/MD.0000000000010722.
- Guglielmi V, Sbraccia P. Obesity phenotypes: depot-differences in adipose tissue and their clinical implications. Eat Weight Disord. 2018;23(1):3–14. doi:10.1007/s40519-017-0467-9.
- Pham DD, Ku B, Shin C, et al. Thoracic-to-hip circumference ratio as a novel marker of type 2 diabetes, independent of body mass index and waist-to-hip ratio, in Korean adults. Diabetes Res Clin Pract. 2014;104(2):273–280. doi:10.1016/j.diabres.2013.12.022.
- Zhang Y, Zhang X, Wang F, et al. The relationship between obesity indices and serum vitamin D levels in Chinese adults from urban settings. Asia Pacific J Clin Nutrit. 2016;25:333–339.
- Hurskainen AR, Virtanen JK, Tuomainen TP, et al. Association of serum 25-hydroxyvitamin D with type 2 diabetes and markers of insulin resistance in a general older population in Finland. Diabetes Metab Res Rev. 2012;28(5):418–423. doi:10.1002/dmrr.2286.
- Xu W, Zhang H, Paillard-Borg S, et al. Prevalence of overweight and obesity among Chinese adults: role of adiposity indicators and age. Obes Facts. 2016;9(1):17–28. doi:10.1159/000443003.
- Xin Z, Liu C, Niu WY, et al. Identifying obesity indicators which best correlate with type 2 diabetes in a chinese population. BMC Public Health. 2012;12(1):732. doi:10.1186/1471-2458-12-732.
- Kodama S, Horikawa C, Fujihara K, et al. Comparisons of the strength of associations with future type 2 diabetes risk among anthropometric obesity indicators, including waist-to-height ratio: a meta-analysis. Am J Epidemiol. 2012;176(11):959–969. doi:10.1093/aje/kws172.
- Vazquez G, Duval S, Jacobs DR, Jr., et al. Comparison of body mass index, waist circumference, and waist/hip ratio in predicting incident diabetes: a meta-analysis. Epidemiol Rev. 2007;29(1):115–128. doi:10.1093/epirev/mxm008.
- Meisinger C, Döring A, Thorand B, et al. Body fat distribution and risk of type 2 diabetes in the general population: are there differences between men and women? The MONICA/KORA augsburg cohort study. Am J Clin Nutr. 2006;84(3):483–489. doi:10.1093/ajcn/84.3.483.
- Bardini G, Giannini S, Romano D, et al. Lipid accumulation product and 25-OH-vitamin D deficiency in type 2 diabetes. Rev Diabet Stud. 2013;10(4):243–251. doi:10.1900/RDS.2013.10.243.
- Mitri J, Muraru MD, Pittas AG. Vitamin D and type 2 diabetes: a systematic review. Eur J Clin Nutr. 2011;65(9):1005–1015. doi:10.1038/ejcn.2011.118.
- Sassi F, Tamone C, D’Amelio P. Vitamin D: nutrient, hormone, and immunomodulator. Nutrients. 2018;10(11):1656. doi:10.3390/nu10111656.
- Wu C, Qiu S, Zhu X, et al. Vitamin D supplementation and glycemic control in type 2 diabetes patients: a systematic review and meta-analysis. Metabolism. 2017;73:67–76. doi:10.1016/j.metabol.2017.05.006.
- Zuk AM, Quiñonez CR, Saarela O, et al. Joint effects of serum vitamin D insufficiency and periodontitis on insulin resistance, pre-diabetes, and type 2 diabetes: results from the National Health and Nutrition Examination Survey (NHANES) 2009–2010. BMJ Open Diabetes Res Care. 2018;6(1):e000535. doi:10.1136/bmjdrc-2018-000535.
- Akter S, Kuwahara K, Matsushita Y, et al. Serum 25-hydroxyvitamin D(3) and risk of type 2 diabetes among Japanese adults: the Hitachi health study. Clin Nutr. 2020;39(4):1218–1224. doi:10.1016/j.clnu.2019.05.010.
- Bansal A, Heagerty PJ. A tutorial on evaluating the time-varying discrimination accuracy of survival models used in dynamic decision making. Med Decis Making. 2018;38(8):904–916. doi:10.1177/0272989X18801312.
- Hajian-Tilaki K. Receiver operating characteristic (ROC) curve analysis for medical diagnostic test evaluation. Caspian J Intern Med. 2013;4(2):627–635.
- Nayak VKR, Raghurama Nayak K, Vidyasagar S, et al. Body composition analysis, anthropometric indices and lipid profile markers as predictors for prediabetes. PLoS One. 2018;13(8):e0200775. doi:10.1371/journal.pone.0200775.
- Gu D, Ding Y, Zhao Y, et al. Visceral adiposity index was a useful predictor of prediabetes. Exp Clin Endocrinol Diabetes. 2018;126(10):596–603. doi:10.1055/s-0043-120440.
- Zhou B, Wu Y, Yang J, et al. Overweight is an independent risk factor for cardiovascular disease in chinese populations. Obes Rev. 2002;3(3):147–156. doi:10.1046/j.1467-789x.2002.00068.x.