
Abstract
Aim
This cross-sectional study investigated the association between metabolic syndrome (MetS) and handgrip strength (HGS) with respect to sex and adiposity in Saudi men (n = 287) and women (n = 268).
Material and methods
Anthropometry, body composition, HGS, and blood biochemistry were measured. The average age of the study population was 57.65 ± 9.3 years (men = 55.1 ± 9.3 years, women = 60.4 ± 9.3 years). We report that HGS/body mass index (BMI), HGS/weight, and HGS/fat (%) were significantly higher in controls than in patients with MetS in men but not in women. According to the ROC analysis, relative HGS (RHGS) was higher than HGS alone in the association with MetS, which was significant for men (p < 0.01). At lower quartiles of HGS, the probability of MetS was higher in women, and the same was found in men in the lower quartiles of HGS/%Fat. Multinomial regression revealed significant associations between age and adiposity and MetS in men and HGS in women. Additionally, the linear regression of age, HGS, and weight exhibited significant associations between HGS with WC in both sexes.
Conclusion
A higher risk of MetS in the lower quartiles of HGS was found in women, and adiposity moderated the relationship between HGS and MetS in men.
1. Introduction
Handgrip strength (HGS) is a reliable measure of skeletal muscle health and physical capacity in old age [Citation1]. Likewise, low HGS is associated with multifactorial metabolic and behavioral processes, including physical inactivity, nutritional and hormonal derangements, reduced metabolism, and disease [Citation2]. Metabolic syndrome (MetS) is a cluster of three–five metabolic dysfunctions, including insulin resistance, dyslipidemia, elevated blood pressure, and abdominal obesity. Although MetS can lead to cardiovascular disease and other comorbidities, its pathological components and underlying mechanisms remain poorly characterized [Citation3]. Most patients with MetS are older adults and exhibit an age-associated muscle decline. Both MetS and sarcopenia are multifactorial diseases and are affected by several confounders, which further complicate the interaction between these two conditions. Thus, to understand the relationship between sarcopenia and MetS, a better understanding of confounding factors is required.
The relationship between gender differences and sarcopenia with metabolic dysregulation has recently been suggested for target populations in Saudi Arabia [Citation4]. Sex affects not only human morphology but also metabolic sensitivity and behavioral lifestyle, which together may affect the association between sarcopenia and MetS. For example, a recent study found a sex-specific association between low HGS and dietary factors to prevent sarcopenia in young and middle-aged Koreans [Citation5]. The prevalence of sarcopenia is significantly higher among women than among men in older age groups in Saudi Arabia [Citation6]. Furthermore, an adverse association between adiposity and sarcopenia, as measured by muscle mass, was found in Saudi women compared with men [Citation7]. Thus, sex differences should be considered when investigating the association between sarcopenia and MetS. Existing data from Saudi Arabia reported that the prevalence of sarcopenia among elderly Saudi women is approximately 19.8% [Citation8]. We previously found that the prevalence of pre-sarcopenia without MetS in Saudi male adults was reported in 13.6% of the participants, while MetS without pre-sarcopenia was observed in 15.5%, and the combination of MetS and pre-sarcopenia was observed in only 1.3% [Citation9]. Although the prevalence of pre-sarcopenia and MetS was low in this study, it displayed a unique cardiometabolic profile that was worse than that of having only one of the conditions.
Obesity is another confounding factor that can robustly affect sarcopenia and MetS. A low HGS is a common finding in patients with sarcopenia [Citation10]. Since HGS is partly affected by body composition, relative HGS (RHGS) is recommended as a clinical predictor of metabolic health and cardiovascular disease [Citation11]. For example, in a cross-sectional study on Arab men, RHGS was more useful than raw HGS in differentiating patients with different severities of MetS [Citation12]. Several methods are used to evaluate obesity, including body weight, body mass index (BMI), fat percentage, and waist circumference (WC). It is imperative that these measures be widely used in the literature and may not be interchangeable. For example, the association between BMI per se and HGS/BMI ratio was found in all subgroups by sex and age, whereas its association with HGS alone was found only in young women [Citation13]. Moreover, higher HGS is associated with increased body size in the general population; however, its association with adiposity is the opposite. Thus, higher weight positively affects strength parameters, but an increased fat mass index negatively affects strength parameters, and BMI does not correlate with HGS. This means that body fat distribution rather than BMI may be considered in the interaction with muscle strength [Citation14]. From a methodological perspective, this study proposes that fat distribution and muscle quality can affect MetS, but the outcomes can be highly affected by the measurement method, which may affect the magnitude and direction of the outcomes.
The relationship between HGS and MetS components is inconsistent and requires further prospective studies. For example, diabetes was inversely related to HGS in younger women and men; however, a similar relationship was not found in older adults. Furthermore, HGS was associated with diastolic blood pressure (DBP) in older men, but not in women [Citation13]. There was a moderate correlation between HGS and high-density lipoprotein cholesterol (HDL-C) in patients with T2D, whereas there was a moderate adverse correlation between HGS and HbA1c% in healthy participants [Citation15]. We observed that obese patients with sarcopenia exhibited significantly higher insulin resistance and dyslipidemia than those with sarcopenia or obesity alone among Saudi men [Citation16]. The association between HGS, adiposity indices, and MetS and its components has been reported, with conflicting results in relation to population and sex. In Saudi Arabia, there are no relevant data on the sex-specific relationships of sarcopenia using the HGS measure with sarcopenic obesity, MetS, and its components. Therefore, we aimed to investigate the association between HGS and MetS and its components in relation to sex and adiposity in middle-aged and older Saudi Arabian populations.
2. Materials and methods
2.1. Study design
This prospective cross-sectional study was conducted. Data were collected from female patients at King Salman Social Center in Riyadh, Saudi Arabia, while data collection for male patients was conducted at two clinical centers in the southern region of Riyadh, Saudi Arabia. The inclusion criteria were Saudi men and women over 40 and 50 years of age, respectively, given that the process of sarcopenia is established within the respective ages [Citation17].
Patients were excluded if they failed to attend both the interview and examination or if they failed to undertake all the necessary tests. Cases with recent hospitalization and/or surgery, musculoskeletal disorders, major organ failure, arthritis, and uncontrolled hypertension were also excluded.
Initial interviews were conducted and each participant was required to attend to all the study measures. They were requested to attend in the afternoon in a postprandial state, and they were asked to avoid any irregular lifestyle in terms of activity and food intake 24 h prior to the examination. Measurements included anthropometry, body composition, HGS, and non-fasting biochemical profile analyses.
2.2. Setting and participants
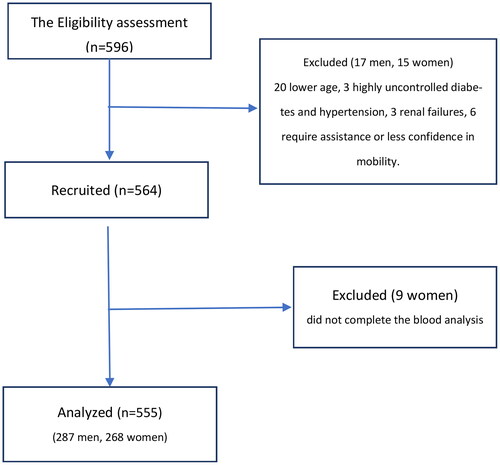
A total of 564 Saudi males and females were included in the study. Nine women were excluded from the study due to incomplete blood analysis. Thus, a sample size of 555 with 268 postmenopausal women and 287 men was included.
The study participants were randomly allocated to examiners. The examiners were blinded to the participants’ diagnoses of MetS to avoid bias in data collection. The sample size required to achieve a power of 0.95, an effect size (HGS/fat) of 0.28, and an allocation ratio of 1 was calculated to be 554 (control = 277 and MetS = 277), as determined by the G*power calculator [Citation12]. The subjects were divided into MetS and control non-MetS (control) groups based on the National Cholesterol Education Program Adult Treatment Panel III guideline criteria. The subjects were also classified based on HGS measures as probable sarcopenic or healthy.
The participants were allocated via social media platforms, posters, and banners. The sample was chosen from the population using non-probability convenience sampling method. All the convenient participants were interviewed, the procedure was explained, and written consent was obtained. displays a flow chart of enrollment in the study. This study was approved by the Research Ethics Committee of King Saud University (IRB No. E-19-4470 for women and IRB No. E-21-5655 for men).
Figure 1. Flow chart of participants’ enrollment in the study.
2.3. Variables and measurements
2.3.1. Anthropometry
Height and WC were measured, whereas BMI was calculated and weight was measured with the body composition procedure. Height was measured using a stadiometer (Seca 703s, Seca gmbh & co. kg., Hamburg, Germany). We asked subjects to take off their shoes, socks, as well as anything on their head, and to stand straight on the equipment. They had to stand with their feet together and keep their head in the horizontal position. WC was measured by requiring subjects to stand upright, breathe naturally, and relax, as a measuring tape was wrapped around their abdomen, at the level of the navel. The tape was neither loose nor tight around the waist, and the value was recorded in centimeters. WC measurements were repeated twice, and the average value was recorded.
2.3.2. Body composition
Bioelectrical impedance analysis (BIA) was performed to assess body composition, including body fat and skeletal muscle mass, using Tanita MC-780MA (Tanita Corporation, Tokyo, Japan). Data such as sex, height, and date of birth were used in the process. The procedure was performed in approximately 20 s [Citation18]. Body fat, visceral fat, weight, height, and skeletal muscle mass were recorded by the examiner.
2.3.3. HGS to identify probable sarcopenic participants
Muscular strength was detected by measuring the HGS. According to the European Working Group on Diagnosing Sarcopenia in Older Persons, a low HGS cutoff is defined as strength less than 27 kg and less than 16 kg for men and women, respectively [Citation10].
A handgrip dynamometer (CAMRY, South El Monte, CA) was used to measure HGS, where individuals were asked to exert a maximal upward force on the device arm using their dominant hand while standing [Citation19]. The trial was repeated twice with a 3–5 min interval rest, and the average measurement was recorded.
2.3.4. Blood sample analysis to screen for metabolic syndrome
The National Cholesterol Education Program Adult Treatment Panel III (NCEP-ATP III) criteria were adapted for MetS selection [Citation20]. The diagnosis of MetS included the presence of any three of the following: high WC ≥ 88 and 102 cm in women and men, respectively; high triglycerides (TG) of more than 150 mg/dL; low high-density lipoprotein cholesterol (HDL-C) of less than 40 mg/dL in men and 50 mg/dL in women; high blood pressure with systolic (SBP) and/or DBP greater than 130 and 85 mmHg, respectively; and diagnosis of diabetes and medical treatment for elevated blood glucose levels [Citation20]. Trained phlebotomists collected venous blood samples from all participants. The samples were analyzed for lipids, which were determined by colorimetric methods using the Dimension® EXL™ auto analyzer with an LM Integrated Chemistry System, including total cholesterol (TC), TG, and HDL-C [Citation21].
2.4. Data treatments and statistical analysis
We generated ROC curve for all participants and separately for both sexes using MetS and its components. Odds ratios of HGS adjusted for age and sex were analyzed based on quartiles of MetS. Lastly, regression models of MetS and its components using age, adiposity indices, and HGS based on sex were analyzed using enter method.
Data were analyzed using SPSS (version 22, Chicago, IL). Continuous data are presented as mean ± standard deviation (SD) and were assessed for normality using the Kolmogorov–Smirnov test. Categorical data are presented as frequencies and percentages (%) and were analyzed using the Chi-square and Fisher exact tests. The independent Student’s t-test and Mann–Whitney U test were used to compare the mean and median differences in Gaussian and non-Gaussian variables. Delong’s test was used for pairwise comparisons to determine the decision point for HGS versus adiposity ratios. Statistical significance was set at p < 0.05.
3. Results
The baseline clinical characteristics and adiposity indices of participants by sex (n = 555, women = 268, men = 287) are displayed in . The average age of the study population was 55.1 ± 9.3 years for men and 60.4 ± 9.3 for women, and probable sarcopenia was found in 15.6% of participants, and half of the participants (50.8%) were considered to have MetS. Men with a low HGS were more likely to have MetS (64.5%) than men with a high HGS (46.5%) (p = 0.04). SBP was also significantly higher in subjects with a lower HGS.
Table 1. Comparison of clinical characteristics and adiposity indices based on HGS cut-off for values of probable sarcopenia in men and women.
Comparison of clinical characteristics, adiposity indices, and HGS in controls and participants with MetS revealed significant differences in age in all participants and men, while the difference was not significant for women (). However, HGS/BMI, HGS/weight, and HGS/fat (%) were significantly higher in control subjects than in MetS in all subjects and men, while it was not significant for women.
Table 2. Comparison of clinical characteristics, adiposity indices, and HGS in control and patients with MetS.
ROC analysis can help to examine the ability of identifier to classify MetS components based on the classification threshold, and it was performed for all participants and separately for both sexes using MetS and its components (). Delong’s test (Supplementary Table 1) showed that the overall pairwise decision point for HGS versus HGS/weight, HGS/BMI, and HGS/fat was significant (p < 0.01). The differences between HGS versus HGS/BMI, HGS/weight, and HGS/fat were not significant in women. It is important that the ROC did not reach 0.70 in MetS and its components, and was affected by sex differences.
Table 3. ROC analysis for all participants and separately for both genders using MetS and its components as dicotomus in relation to HGS and different adiposity indices ratios.
In , overall participants adjusted model (age and gender), no significant association was observed. Further age-adjusted model in males and females, logistic regression analyses demonstrated that the odd of having MetS were strongly associated with HGS in females (OR = 2.09, 95%CI: 1.02–4.28, p = 0.044), which increase several-fold with increasing quartile. On the other hand, HGS/%Fat demonstrated odd of having MetS (OR = 0.46, 95CI: 0.22–0.95, p = 0.035) respectively, which decrease several-fold with increasing quartiles in males.
Table 4. Odd ratios of HGS (adjusted to age and gender) based on the quartiles for MetS.
Furthermore, linear regression analysis was used to examine the predicting models of MetS components. In , the linear regression analysis was performed to dependent metabolic parameters WC, SBP, DBS, HDL, and TG with independent fix predictors age and HGS with other adiposity parameters. It was observed that HGS in the model with age and weight was significantly and inversely associated with WC in both gender (p < 0.01, 0.05). Other metabolic components SBP, DBP, HDL, and TG were not independently associated with HGS.
Table 5. Linear regression analysis for metabolic syndrome components with age, handgrip strength, and body composition.
In the categorical dependent variable (having MetS: yes or no), a logistic regression analysis for MetS is presented in . There was a positive significant association between HGS and MetS in women in all models. As shown in , odd ratio for model 1 was 1.07 (1.01 − 1.15, p = 0.037), and was 1.07 (1.01 − 1.15, p = 0.038) for model 2, and was 1.08 (1.01 − 1.5, p = 0.024) for model 3.
Table 6. Logistic regression analysis for MetS.
4. Discussion
This study aimed to assess the association of MetS and its components with HGS in relation to sex and adiposity indices in middle-aged and elderly Saudi adults. The data showed that approximately 15.6% of the participants were classified as having probable sarcopenia. This has been similarly observed in the studies by Alsaawi et al. [Citation8] and Yakout et al. [Citation9]. Furthermore, 50% of the participants had MetS, which is higher than the findings reported by Wu et al. [Citation22], Lopez-Lopez et al. [Citation23], and Ji et al. [Citation24] with 33.6% in China, 42% in Colombia, and 36.3% in the United States of America. Although our data were higher compared with the abovementioned regions by 16.4%, 8%, and 13.7%, respectively, it is comparable with data from the Saudi populations. For example, Al-Rubeaan et al. [Citation25] reported that the percentage of MetS patients among 12,126 Saudi adults based on age groups was as follows: 49.4% and 57.9% using MetS criteria (International Diabetes Federation [IFD] and ATP III, respectively) for age group 40–49 years, and was 56.3% and 66.8% for age 50–59 years, and was 58.5% and 71.0% for age group 60-69 years.
Our results demonstrated a significantly higher risk of MetS in the lower quartiles of HGS in women. The association of MetS with HGS/fat in the lower quartile revealed the combined effect of muscle strength and adiposity in men. Moreover, the contribution of HGS to predicting MetS was significant only in women. Considering that glucose and insulin were not measured in the MetS component analysis, the abovementioned factors showed a strong correlation with WC in men and women, and a weak to moderate correlation with SBP in men. Sex and adiposity are factors that can affect the association between sarcopenia and MetS among middle-aged and older Saudi adults.
In line with our results, some studies have described an inverse relationship between HGS and the frequency of MetS and its components, that is, a lower incidence of MetS and its components with higher HGS [Citation22,Citation24,Citation26–28]. Hong [Citation29] suggested that maintaining a high HGS may reduce the incidence of MetS in elderly Koreans. Koo [Citation30] found that lower HGS values are independently associated with a higher incidence of diabetes in the Korean population. In contrast, Lee et al. [Citation31] and Sayer et al. [Citation32] did not find a relationship between muscle strength and MetS [Citation31,Citation32]. These inconsistent findings may be explained by the use of absolute versus RHGS, which considers the adiposity indices. This raises the importance of sarcopenic obesity rather than examining sarcopenia and obesity separately. Our previous studies showed that obese patients with sarcopenia exhibited significantly greater insulin resistance and dyslipidemia than those with sarcopenia or obesity alone. Thus, sarcopenic obesity may be an independent risk factor for the development and progression of metabolic diseases [Citation16]. Since cardiometabolic health and aging are affected by sarcopenia, it would be more appropriate to use RHGS in the context of MetS in older age groups, considering aging and body composition. RHGS aims to examine the independent contributions of body composition and strength.
While there are different tools for adiposity measures, such as body weight, BMI and fat percentage, it is still unclear which tool is the best to assess increased obesity. Alkahtani [Citation12] suggested that men displayed a greater sensitivity of fat percentage in classifying MetS than body weight and BMI. This study showed significant differences between HGS/BMI and HGS/%Fat in women whereas HGS was different with all RHGS in men. Kawamoto et al. [Citation33] reported that HGS/weight showed a statistically significant inverse association with MetS, greater than HGS alone, and HGS/weight was associated with increased WC in elderly Japanese patients. Ji et al. [Citation24] reported an association between HGS/BMI and MetS in men and women with BMI < 30 kg/m2, yet no association was evident in males with BMI greater than 30 kg/m2. Further studies are required to determine the appropriate body composition tool for RHGS in relation to MetS.
Sex plays a significant role in the relationship between adiposity indices, HGS, and MetS. This study showed that adiposity indices have a strong impact on the sensitivity of HGS to classify MetS in men, and that HGS can predict the probability of MetS in women. Lee et al. [Citation34] investigated the association between HGS and diabetes mellitus in Korean adults according to sex. With a higher HGS, the prevalence of diabetes mellitus decreased, and this inverse association was more significant in men and premenopausal women than in postmenopausal women. In a study conducted on the Saudi pre-frail community-dwelling older population, two-thirds of the participants were sarcopenic, with a higher prevalence among women [Citation6]. We recommend that the data on HGS and RHGS in relation to MetS should be treated separately for men and women. This study highlights that HGS and MetS relationships are influenced by sex and adiposity status. These depend on the age-related decline in androgens, estrogens and androgens which are the key mechanisms linked to universal decline and also gender differences in HGS and MetS [Citation2,Citation35]. Moreover, an explanation of the association between grip strength and type 2 diabetes was adiposity levels and the improvements in glucose homeostasis [Citation36].
This study not only analyzed HGS, but also different body composition indices to assess their association with MetS and its components. However, a limitation of our study is its cross-sectional design, using non-probability convenience sampling method. Moreover, a prediction model for glucose and/or insulin levels was not evaluated, as they were not measured. Unlike Dual X-ray Absorptiometry which is the gold standard of body composition measure, BIA is a valid technique but requires specific calibration equations for different populations and some environmental conditions [Citation37]. We did not investigate the lifestyles, dietary profiles, physical activity status, and the presence of comorbidities among the study population. These factors can affect the sarcopenia status independent of MetS. Therefore, our findings should be cautiously interpreted when generalizing to larger populations from different geographical regions. Multicenter studies with long-term follow-up are recommended to determine the true predictive values of HGS and its indices for MetS and its components in both sexes.
5. Conclusions
Altogether, we report that the relationship between HGS and MetS is at least partly driven by sex and adiposity status in the older age group. Further mechanistic studies are required to elucidate this association, with the aim of developing therapeutic strategies.
Institutional review board statement
The study was conducted in accordance with the Declaration of Helsinki and was approved by the Institutional Review Board (or Ethics Committee) of King Saud University (IRB No. E-19-4470 for women and IRB No. E-21-5655 for men).
Informed consent statement
Informed consent was obtained from all the subjects involved in the study.
Supplemental Material
Download MS Word (17 KB)Disclosure statement
No potential conflict of interest was reported by the authors.
Data availability statement
All the associated data is available in the manuscript.
Additional information
Funding
References
- Azzolino D, Alkahtani S, Cesari M. Definitions of sarcopenia across the world. In Veronese N, Beaudart C, Sabico S, editors. Sarcopenia: research and clinical implications. Cham, Switzerland: Springer International Publishing; 2021. p. 17–26.
- Kalyani RR, Corriere M, Ferrucci L. Age-related and disease-related muscle loss: the effect of diabetes, obesity, and other diseases. Lancet Diabetes Endocrinol. 2014;2(10):819–829. doi: 10.1016/S2213-8587(14)70034-8.
- Cornier M-A, Dabelea D, Hernandez TL, et al. The metabolic syndrome. Endocr Rev. 2008;29(7):777–822. doi: 10.1210/er.2008-0024.
- Alghannam AF, Almasud AA, Alghnam SA, et al. Prevalence of sarcopenia among Saudis and its association with lifestyle behaviors: protocol for cross-sectional study. PLoS One. 2022;17(8):e0271672. doi: 10.1371/journal.pone.0271672.
- Kim I, Son K, Jeong SJ, et al. Sex and Diet-Related disparities in low handgrip strength among young and middle-aged Koreans: findings based on the Korea national health and nutrition examination survey (KNHANES) from 2014 to 2017. Nutrients. 2022;14(18):3816. doi: 10.3390/nu14183816.
- Alodhayani AA. Sex-specific differences in the prevalence of sarcopenia among pre-frail community-dwelling older adults in Saudi Arabia. Saudi J Biol Sci. 2021;28(7):4005–4009. doi: 10.1016/j.sjbs.2021.04.010.
- Al-Dokhi L. Association of the new index of sarcopenic obesity with physical fitness in healthy Saudi men and women. Eur Rev Med Pharmacol Sci. 2015;19(2):328–333.
- Alsaawi TA, Aldisi D, Abulmeaty MMA, et al. Screening for sarcopenia among elderly arab females: influence of body composition, lifestyle, irisin, and vitamin D. Nutrients. 2022;14(9):1855. doi: 10.3390/nu14091855.
- Yakout SM, Alkahtani SA, Al-Disi D, et al. Coexistence of pre-sarcopenia and metabolic syndrome in arab men. Calcif Tissue Int. 2019;104(2):130–136. doi: 10.1007/s00223-018-0477-2.
- Cruz-Jentoft AJ, Bahat G, Bauer J, et al. Sarcopenia: revised European consensus on definition and diagnosis. Age Ageing. 2019;48(1):16–31. doi: 10.1093/ageing/afy169.
- Kim BM, Yi YH, Kim YJ, et al. Association between relative handgrip strength and dyslipidemia in Korean adults: findings of the 2014-2015 Korea national health and nutrition examination survey. Korean J Fam Med. 2020;41(6):404–411. doi: 10.4082/kjfm.19.0073.
- Alkahtani S. Association between adjusted handgrip strength and metabolic syndrome in arab men. Int J Environ Res Public Health. 2021;18(20):10898. doi: 10.3390/ijerph182010898.
- Chong H, Choi YE, Kong JY, et al. Association of hand grip strength and cardiometabolic markers in Korean adult population: the Korea national health and nutrition examination survey 2015–2016. Korean J Fam Med. 2020;41(5):291–298. doi: 10.4082/kjfm.18.0129.
- Otten L, Bosy-Westphal A, Ordemann J, et al. Abdominal fat distribution differently affects muscle strength of the upper and lower extremities in women. Eur J Clin Nutr. 2017;71(3):372–376. doi: 10.1038/ejcn.2016.226.
- Abdulrazzaq VM, Al-Rammahi TMM, Ashor AW. Association of hand grip strength with cardiometabolic markers in type 2 diabetes mellitus. AIP Conf Proc. 2020;2290(1):030041.
- Habib SS, Alkahtani S, Alhussain M, et al. Sarcopenia coexisting with high adiposity exacerbates insulin resistance and dyslipidemia in Saudi adult men. Diabetes Metab Syndr Obes. 2020;13:3089–3097. doi: 10.2147/DMSO.S260382.
- Cristea A, Qaisar R, Edlund PK, et al. Effects of aging and gender on the spatial organization of nuclei in single human skeletal muscle cells. Aging Cell. 2010;9(5):685–697. doi: 10.1111/j.1474-9726.2010.00594.x.
- Verney J, Schwartz C, Amiche S, et al. Comparisons of a multi-frequency bioelectrical impedance analysis to the dual-energy x-ray absorptiometry scan in healthy young adults depending on their physical activity level. J Hum Kinet. 2015;47(1):73–80. doi: 10.1515/hukin-2015-0063.
- Bohannon RW. Muscle strength: clinical and prognostic value of hand-grip dynamometry. Curr Opin Clin Nutr Metab Care. 2015;18(5):465–470. doi: 10.1097/MCO.0000000000000202.
- Saklayen MG. The global epidemic of the metabolic syndrome. Curr Hypertens Rep. 2018;20(2):12. doi: 10.1007/s11906-018-0812-z.
- Langsted A, Freiberg JJ, Nordestgaard BG. Fasting and nonfasting lipid levels. Circulation. 2008;118(20):2047–2056. doi: 10.1161/CIRCULATIONAHA.108.804146.
- Wu H, Liu M, Chi VTQ, et al. Handgrip strength is inversely associated with metabolic syndrome and its separate components in Middle aged and older adults: a large-scale population-based study. Metabolism. 2019;93:61–67. doi: 10.1016/j.metabol.2019.01.011.
- Lopez-Lopez JP, Cohen DD, Ney-Salazar D, et al. The prediction of metabolic syndrome alterations is improved by combining waist circumference and handgrip strength measurements compared to either alone. Cardiovasc Diabetol. 2021;20(1):68. doi: 10.1186/s12933-021-01256-z.
- Ji C, Xia Y, Tong S, et al. Association of handgrip strength with the prevalence of metabolic syndrome in US adults: the national health and nutrition examination survey. Aging (Albany NY). 2020;12(9):7818–7829. doi: 10.18632/aging.103097.
- Al-Rubeaan K, Bawazeer N, Al Farsi Y, et al. Prevalence of metabolic syndrome in Saudi Arabia - a cross sectional study. BMC Endocr Disord. 2018;18(1):16. doi: 10.1186/s12902-018-0244-4.
- Atlantis E, Martin SA, Haren MT, et al. Inverse associations between muscle mass, strength, and the metabolic syndrome. Metabolism. 2009;58(7):1013–1022. doi: 10.1016/j.metabol.2009.02.027.
- Jurca R, Lamonte MJ, Barlow CE, et al. Association of muscular strength with incidence of metabolic syndrome in men. Med Sci Sports Exerc. 2005;37(11):1849–1855. doi: 10.1249/01.mss.0000175865.17614.74.
- Wijndaele K, Duvigneaud N, Matton LYNN, et al. Muscular strength, aerobic fitness, and metabolic syndrome risk in flemish adults. Med Sci Sports Exerc. 2007;39(2):233–240. doi: 10.1249/01.mss.0000247003.32589.a6.
- Hong S. Association of relative handgrip strength and metabolic syndrome in Korean older adults: Korea national health and nutrition examination survey VII-1. J Obes Metab Syndr. 2019;28(1):53–60. doi: 10.7570/jomes.2019.28.1.53.
- Koo BK. The differential association between muscle strength and diabetes mellitus according to the presence or absence of obesity. J Obes Metab Syndr. 2019;28(1):46–52. doi: 10.7570/jomes.2019.28.1.46.
- Lee J, Hong YP, Shin HJ, et al. Associations of sarcopenia and sarcopenic obesity with metabolic syndrome considering both muscle mass and muscle strength. J Prev Med Public Health. 2016;49(1):35–44. doi: 10.3961/jpmph.15.055.
- Sayer AA, Syddall HE, Dennison EM, et al. Grip strength and the metabolic syndrome: findings from the hertfordshire cohort study. QJM. 2007;100(11):707–713. doi: 10.1093/qjmed/hcm095.
- Kawamoto R, Ninomiya D, Kasai Y, et al. Handgrip strength is associated with metabolic syndrome among Middle-aged and elderly community-dwelling persons. Clin Exp Hypertens. 2016;38(2):245–251. doi: 10.3109/10641963.2015.1081232.
- Lee SB, Moon JE, Kim JK. Association of handgrip strength with diabetes mellitus in Korean adults according to sex. Diagnostics (Basel). 2022;12(8):1874. doi: 10.3390/diagnostics12081874.
- Lu L, Tian L. Postmenopausal osteoporosis coexisting with sarcopenia: the role and mechanisms of estrogen. J Endocrinol. 2023;259(1):e230116.
- Fraser BJ, Blizzard L, Buscot MJ, et al. The association between grip strength measured in childhood, young- and mid-adulthood and prediabetes or type 2 diabetes in mid-adulthood. Sports Med. 2021;51(1):175–183. doi: 10.1007/s40279-020-01328-2.
- Dehghan M, Merchant AT. Is bioelectrical impedance accurate for use in large epidemiological studies? Nutr J. 2008;7(1):26. doi: 10.1186/1475-2891-7-26.