
 ?Mathematical formulae have been encoded as MathML and are displayed in this HTML version using MathJax in order to improve their display. Uncheck the box to turn MathJax off. This feature requires Javascript. Click on a formula to zoom.
Abstract
Objective: To determine the net economic impact of switching from low-osmolar contrast media (LOCM) to iso-osmolar contrast media (IOCM; iodixanol) in patients undergoing inpatient coronary or peripheral angioplasty in the United States (US).
Methods: A budget impact model (BIM) was developed from a hospital perspective. Nationally representative procedural and contrast media prevalence rates, along with MARCE (major adverse renal cardiovascular event) incidence and episode-related cost data were derived from Premier Hospital Data (October 2014 to September 2015). A previously estimated relative risk reduction in MARCE associated with IOCM usage (9.3%) was applied. The higher cost of IOCM was included when calculating the net impact estimates at the aggregate, hospital type, and per hospital levels. One-way (±25%) and probabilistic sensitivity analyses identified the model’s most important inputs.
Results: Based on weighted analysis, 513,882 US inpatient angioplasties and 35,610 MARCE cases were estimated annually. Switching to an “IOCM only” strategy from a “LOCM only” strategy increases contrast media cost, but prevents 2,900 MARCE events. The annual budget impact was an estimated saving of $30.71 million, aggregated across all US hospitals, $6,316 per hospital, or $60 per procedure. Net savings were maintained across all univariate sensitivity analyses. While MARCE/event-free cost differential was the most important factor driving total net savings for hospitals in the Northeast and West, procedural volume was important in the Midwest and rural locations.
Conclusions: Switching to an “IOCM only” strategy from a “LOCM only” approach yields substantial net global savings to hospitals, both at the national level and within hospital sub-groups. Hospital administrators should maintain awareness of the factors that are likely to be more influential for their hospital and recognize that purchasing on the basis of lower contrast media cost may result in higher overall costs for patients undergoing inpatient angioplasty.
Introduction
A MARCE (major adverse renal cardiovascular event) is defined as either a major adverse kidney event (MAKE; death, new dialysis, and worsened renal function) or a major adverse cardiac event (MACE; myocardial infarction, stroke, and heart failure)Citation1. With respect to kidney disease, acute kidney injury (AKI) is associated with incident and progressive chronic kidney disease CKD, which in turn may lead to or exacerbate a patient’s risk for cardiovascular disease (CVD)Citation1–6. AKI is an increasingly common complication during hospitalizations. While AKI has multiple etiologies, one of the top-three causes of hospital-acquired AKI (12%) is contrast-induced-AKI (CI-AKI)Citation7. CI-AKI refers to the abrupt deterioration in renal function occurring within a narrow time window, typically 24–72 h, of iodinated contrast media (CM) administration, usually required for angiographic proceduresCitation8. CI-AKI has varying incidence rates (2–24%) and has the same serious prognostic implications as any AKI episode, potentially pre-disposing the patient to CKD, CVD, higher mortality, and associated increases in use of healthcare resources and cost of careCitation7–9.
Given the growth of vulnerable patient populations (e.g. elderly, diabetics, heart disease patients), increased complexity of procedures, and concerns regarding healthcare costs; practices that can reduce the incidence of CI-AKI are important to identify. Administration of iso-osmolar contrast media (Iodixanol; IOCM) instead of low-osmolar CM (LOCM) appears to be one such modifiable risk factorCitation10. While others have examined the clinical and cost-effectiveness implications of CM choice and have generally found IOCM equivalent or superior in both domains, our study focuses on quantifying the potential savings (or cost) to hospitals associated with using IOCM rather than LOCMCitation11–17. One of the benefits of using retrospective data is that a broader array of outcomes, including both the “harder” clinical outcomes and meaningful economic endpoints (hospital expenditures), can be investigated relative to clinical trials which typically focused on intermediate endpoints (such as glomerular filtration rate, or GFR, changes). Also, we are measuring “real world” effectiveness rather than “efficacy” from clinical studies, which may incorporate significant exclusion/inclusion criteria that do not always conform with actual use in practiceCitation18,Citation19. With respect to outcomes, the analysis we conducted on the Premier Healthcare Database included all MARCE events (Death, AMI, CI_AKI, AKI with or without dialysis, renal failure with dialysis, angina, stent occlusion/thrombosis, stroke, TIA). None of the randomized clinical trials approach this range of outcomes. Our budget impact model (BIM) differs from classic cost-effectiveness analyses (CEA), which are often conducted at the societal level and also typically incorporate measurement of quality adjusted life years (QALYs). We believe our hospital-focused BIM is unique, as there appears to be no other study in this domain that focuses on net costs of CM to US hospitals after incorporating MARCE costs.
Our study built upon the results from a recently completed retrospective real-world cohort analysis by McCullough et al.Citation20 that assessed the relationship between IOCM and LOCM on MARCE events in adult patients undergoing arterial (coronary, carotid, and peripheral) angiography with intervention in an inpatient setting. The prior retrospective clinical study relied on data from January 1, 2008–September 30, 2013 in the Premier Hospital Database. The fully saturated multivariable regression analysis indicated that administration of IOCM vs LOCM was associated with a 0.69% absolute risk reduction and a 9.3% (95% CI = –6.3% to –12.4%) relative risk reduction (RRR) in MARCE rate after adjustment for year, hospital, patient, and procedure characteristics. The MARCE rate after angioplasty was 7.41%, and a significant share of these MARCEs resulted in “hard” clinical outcomes such as acute myocardial infarction (AMI) (RRR = –34%, prevalence = 1.06%), Angina (RRR = –38%, prevalence = 2.03%) and stent occlusion (RRR = –21%, prevalence = 0.5%) (all measures statistically significantly different from 0). Hence, it is clear that “hard outcomes” (which in turn are more expensive for the hospitals) are key contributors to our MARCE measure.
We hypothesized that risk reduction could be accompanied by cost savings if savings from reduced MARCE-related expenditures exceeded the additional cost of CM. A previous European study by de Francesco et al.Citation21 compared IOCM to LOCM in a sub-population of patients with an increased risk of CI-AKI over a 3-year time horizon and found a cumulative net percentage saving on the total hospital budget of 29%, 34%, 25%, and 33% in the settings of Germany, Italy, Poland, and Spain, respectively. Our analysis includes all patients, not just high risk patients, with a focus on the procedure costs to US hospitals when performing inpatient angioplasties with ICOM vs LOCM. Our study (1) assessed the economic impact of MARCE reduction if LOCM is replaced by IOCM in patients undergoing arterial (coronary, carotid, and peripheral) angiography with percutaneous intervention in an inpatient setting in the US; and (2) identified key cost determinants across different hospital types or sub-groups based on region, teaching status, urban/rural location, and size (beds).
Methods
Model structure and eligible population
We developed a cohort-based deterministic Microsoft Excel based model from a hospital perspective using inputs from the published literature or the Premier Hospital DatabaseCitation18. The database has been extensively used by academic, government, and commercial research, and is the source data for over 300 peer-reviewed publicationsCitation22. The contributing hospitals capture diversity across geography, rural/urban status, hospital size (# beds), and hospital types (academic vs non-academic). This diversity allows for extrapolation to national or group-specific estimates—many other hospital specific retrospective datasets are not nearly as comprehensive. From the cohort of patients receiving inpatient angioplasties based on the weighted extrapolation at either the national or group level, the model estimates the share that are eligible for CM (after adjusting for missing data, ∼12% of the patients are not eligible for CM) and the share that proceed to have a MARCE (6.8% in the more recent data at the national level). At national level, we estimate the incremental cost of CM between IOCM and LOCM. At both the national and group levels, we calculate the cost of MARCE (for the incident hospitalization) and the cost for angioplasty patients who do not experience MARCE (the difference is the incremental cost of MARCE). Just as is the case with cost-effectiveness analyses, our BIM analysis is incremental in nature. With respect to the cost of administration of contrast media (CM), the measure is the incremental difference in cost to the hospital between IOCM (iso-osmolar contrast media) and LOCM (low osmolar contrast media). In fact, the claims data accounts for both the quantity (milliliters used) and price per milliliter used of CM in the case of IOCM and LOCM, so our CM cost measure is incremental cost per procedure, based on real world data and actual use (another benefit of relying on a claims analysis). The model also relies on the MARCE incidence and RRR to estimate the incremental effect of shifting from an “all LOCM” strategy to and “All IOCM” strategy (after excluding the CM-ineligible population).
Data source
Model inputs were sourced from the Premier Hospital Database, a large, dynamic US hospital-based, service-level, all-payer database which currently contains data from over 148 million unique patients (from 2000–2015)Citation23. The database includes hospital characteristics, and hospital encounter level patient data from standard hospital discharge billing files including de-identified patient daily service records. With regards to generalizability, preliminary comparisons between patient and hospital characteristics for the Premier hospitals and those from the probability sample of hospitals and patients selected for the Center for Disease Control and Prevention’s National Hospital Discharge Survey suggest that the patient populations are similar with respect to a patient’s age, gender, length of stay (LOS), mortality, primary discharge diagnosis, and primary procedure groupsCitation24.
Model inputs
Procedure volume, share of CM usage, MARCE incidence, and hospital costs are from the most recent year of data available at the time of our study (October 1, 2014–September 30, 2015). More specifically, the most recent data provided: (1) the weighted number of inpatient procedures per year (at national or hospital group level), (2) the share of relevant interventions eligible for CM administration (national level only), (3) the risk of MARCE events (national and hospital group level), (4) the weighted average cost of MARCE and event-free visits (national and hospital group level), and (5) the cost of each CM type (per procedure, accounting for volume as well as price per unit volume used in each procedure (national level only)). The one clinical data point we relied on from the earlier data analysis was the reduction in relative risk (RRR) for MARCE associated with IOCM usage relative to LOCM usage (national level only). Some statistics were not available at the hospital group level due to data restrictions. When estimating costs at the hospital group level, we assume the national level figures apply to each of the relevant hospital groups. See for more details on how input data varies across national and hospital sub-groups.
Table 1. Annual US inpatient angioplasties, MARCE adverse events, and costs.
Table 2. Frequency and costs of inpatient angioplasties with and without MARCE adverse events (by hospital type).
Table 3. Estimated annual aggregate, per hospital and per procedure global savings associated with adoption of an “IOCM only” strategy vs “LOCM only” strategy for inpatient angioplasties.
Table 4. Relative impact of key determinants on global hospital cost savings associated with adoption of an “IOCM only” strategy vs “LOCM only” strategy across hospital sub-groups.
MARCE events were defined as a composite of renal failure with dialysis, AKI with and without dialysis, acute myocardial infarction, angina, stent occlusion/thrombosis, stroke, transient ischemic attack, or death occurring during the inpatient visit. Supplementary Table 1 lists the ICD-9 codes used for identification of MARCE events. The primary procedure and MARCE were defined using consistent definitions and codes in our analysis and the McCullough et al.Citation20 study. MARCE events were recorded during the inpatient visit only, no follow-up or re-admission data were available. As such, the costs also only cover the cost to the hospital of the incident hospitalization.
Inpatient angioplasties were stratified into the following scenarios: (1) angioplasty with IOCM only (i.e. visit involves billing for iodixanol administration only); (2) angioplasty with LOCM only (i.e. visit involves billing for iohexol, ioversol, iopamidol, ioxaglate, ioxilan, and/or iopromide administration); (3) angioplasty with IOCM/LOCM mix (i.e. visit involves billing for both IOCM and LOCM administrations); (4) angioplasty with unknown CM (i.e. visit involves billing for CM administration of indeterminate type); and (5) angioplasty with no CM usage (i.e. visit involves no charge for CM administration and assumed to reflect a patient’s contraindication for CM). Since our study focuses on the impact of switching from an “IOCM only” and “LOCM only” strategy, the cost savings estimate a marginal impact of making this switch. All cost estimates were adjusted for inflation to 2017 US dollars using either the Bureau of Labor Statistics (BLS) hospital services inflation component (MARCE costs) or the medical care commodities inflation component (CM costs)Citation22.
Analysis
Evaluating cost savings
Net cost savings were a function of two components: (A) savings due to reduced MARCE events and (B) marginal cost related to administration of IOCM rather than LOCM, since IOCM is typically more expensive than LOCM. More specifically, net cost savings equal:
where AngCostDiff = difference in hospital costs of an angioplasty visit with MARCE and without MARCE (adjusted for inflation to 2017 US dollars using the hospital services component of CPI); MARCEAvoid = number of MARCE events avoided (based on the counterfactual estimates) by moving from an “LOCM only” strategy to an “IOCM only” strategy (but accounting for the fact that a share of the population is contraindicated for CM and will not “benefit” from the shift in strategy); CostCMDiff = base case CM cost differential between “IOCM only” and “LOCM only”, which is adjusted (1) with a 4× multiplier to generate a conservative estimate and to accommodate a scenario where IOCM may be accompanied by a larger volume and (2) for inflation using the 2017 Medical Care commodities index from the US BLS; NIA = weighted number of new primary inpatient angioplasties over the course of a year; and NoCMShare = adjusted share of weighted number of primary inpatient angioplasties which did not receive any CM (presumably due to these individuals’ contraindication for CM).
To estimate average savings at the group, hospital, or per procedure level, we relied on data from American Hospital Association (AHA) and other sources to determine the total number of US hospitals and the share in each relevant sub-groupCitation25. The aggregated or global cost savings were divided by the total number of non-federal acute-care community hospitals. For savings per procedure, the denominator is the weighted number of annual inpatient angioplasties from the database. To disaggregate the estimates by hospital type, in addition to AHA, sub-group estimates were derived using US Census and CDC reportsCitation26,Citation27.
Source of savings or cost
Key savings determinants such as volume or unit costs were the source of savings in the deterministic model and for each hospital type. These factors are analogous to “cost drivers” commonly referenced in the health finance and accounting literature, but in this case they primarily accounted for savings (not costs) and reflect elements in a deterministic modelCitation28. For each sub-group, we evaluated whether volume or MARCE cost (both of which are estimated at the hospital group level, not just in aggregate) were more responsible for explaining why net savings either increase or decrease due to the adoption of IOCM over LOCM use.
To quantify the extent of volume and price factors we divided the national share of procedures (or hospitals) for each level of the sub-group by the share of global savings from that sub-group relative to the national total. To estimate the procedures per hospital, MARCE rate and cost differential factors, we divided the sub-group value by the national value for each metric. These relative impact values reflected each of these factor’s individual importance in determining the overall savings for the sub-group relative to the importance in determining savings at the national level. A figure greater (less) than 1 indicated that the effect of the factor was greater (less) than the effect of the same factor at the national level in determining the total global cost savings for that particular sub-group.
Sensitivity analyses
One-way sensitivity analyses (SA) were performed by varying each key input for the US national aggregate model by ±25% of its default value in order to assess the impact of the individual parameters on the model as well as to evaluate its robustness.
For the probabilistic multivariate SA, a stochastic 10,000 draw Monte Carlo analysis was performed on the total US aggregate outcome using TreeAge Pro 2015 software (TreeAge Software, Inc., Williamstown, MA). Given the lack of dispersion data, a triangle distribution was assumed. The distribution range was ±25% of the base case value.
Results
Model input estimates and main result
In the period from October 1, 2014–September 30, 2015, there were an estimated 513,882 inpatient angioplasties, of which 35,038 involved a MARCE (). Among inpatient angioplasties with MARCE, the share of each of the five CM scenarios was as follows: 12.0% (IOCM only), 48.1% (LOCM only), 5.9% (IOCM/LOCM mix), 24.6% (unknown CM), and 9.4% (no CM). The percentage of each CM scenario was adjusted to remove the scenario in which CM was unknown, yielding the following estimates: 15.9% (IOCM only), 63.8% (LOCM only), 7.8% (IOCM/LOCM mix), and 12.4% (no CM). The weighted number of MARCE events we expected if there were no “IOCM only” strategies was calculated to be 35,610. At this aggregated level, ∼ 2,900 MARCEs would be avoided if we switched to an “IOCM only” strategy, given the relative risk reduction of 9.3%.
Based on volume and price differences for LOCM and IOCM, the marginal contrast administration cost for pursuing “IOCM only” vs “LOCM only” was $8.24 per procedure. However, as a conservative measure which biases against finding a net cost saving with adoption of an “IOCM only” strategy, we applied a 4× multiplier and used $32.97 as our cost differential per procedure. Given these input levels, our deterministic model yields a net annual cost saving across all US hospitals of $30.7 million, $6,316 per hospital, and $60 per angioplasty.
Hospital sub-group variation
The frequency and costs of inpatient angioplasties with and without MARCE are reported by hospital type (). There was a modest amount of variation in MARCE frequency (5.4–7.4%) across hospital sub-groups. Cost varied by hospital sub-group with and without MARCE; for example, the cost of a hospital visit with MARCE in a rural hospital of $30,174 vs $44,800 for a hospital located in the Northeast (). These differences were most stark in the comparison of geographic variation.
Given the differences in volume of procedures and cost differences specific to each hospital sub-group, per hospital and per procedure cost savings differed substantially (). As one may suspect, the high concentration of cases in urban (relative to rural) hospitals results in a saving per hospital of $9,987 in urban hospitals, but just $220 per rural hospital. Similar dynamics occurred when we compared teaching ($9,353 annual savings per hospital) and non-teaching hospitals ($5,546 annual savings per hospital). The net savings estimate for large hospital (500+ beds) is $38,447 per year vs just $358 per year in hospitals with less than 100 beds. As for average cost savings per angioplasty procedure, estimates were found to vary between $31 (rural hospitals) to $87 (hospitals located in the West region). The value of IOCM administration tended to be concentrated in those institutions where the volume of procedures was higher.
Determinants of cost savings
The relative impact of key determinants (volume, MARCE incidence, and costs) on global hospital cost savings associated with adoption of an “IOCM only” Strategy vs “LOCM only” strategy across hospital sub-groups are presented in . Generally, the relative impact of volume-based factors had the most variation; determinants of cost demonstrated moderate variation, while the difference in the rate of MARCE across different hospital types and location showed the least variation across sub-groups. For example, the baseline MARCE rate was relatively low in the Northeast (0.8, 5.4% of angioplasty cases vs 6.6% of angioplasty cases nationally), leading us to anticipate that the value of switching to IOCM would be attenuated in the Northeast due to the lower initial MARCE incidence. However, the cost of MARCE was generally higher in the Northeast, thus yielding a significant impact (1.46 relative price impact since the cost differential was ∼ $23,000 vs $15,000 nationally). Teaching and urban hospitals’ aggregated cost savings were driven more so by higher procedural volume per hospital (1.34 Teaching and 1.56 Urban) and their higher MARCE cost differentials (1.10 Teaching and 1.01 Urban) in relation to non-teaching and rural hospitals, respectively. There was no discernable pattern with respect to incidence or costs relative to bed size, but, as one would suspect, the procedures per hospital were a much more important relative factor as hospitals ranged from <100 to 500+ beds.
Sensitivity analyses
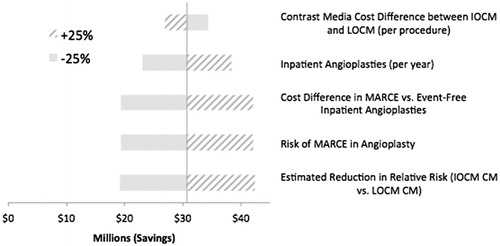
Across all sensitivity analyses, the adoption of IOCM relative to LOCM remained cost saving (cost savings were always greater than “0”, as reflected in ). The one-way sensitivity analysis in revealed that the model was most sensitive to the following key inputs when estimating aggregated US cost savings: (1) RRR of IOCM vs LOCM, (2) MARCE risk in angioplasty procedures, and (3) MARCE vs event-free inpatient angioplasty visit cost difference. Among the key inputs, the model was least sensitive to the CM cost differential per procedure.
Figure 1. Cost savings: one way sensitivity analyses.
In the multivariate Monte Carlo probabilistic sensitivity analysis findings the mean aggregate cost saving associated with shifting from a “LOCM only” to an “IOCM only” strategy was $27.8 (95th percentile difference: 79.6) million US dollars. IOCM was associated with cost savings in 91.9% of the simulations, at $61 per procedure on average. In the remaining 8.1%, replacing LOCM with IOCM led to a mean additional cost of $17.21 per procedure.
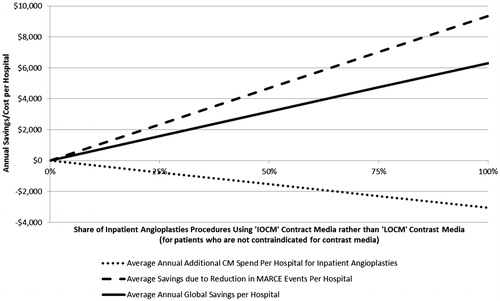
depicts the annual per hospital MARCE savings as a hypothetical “average hospital” in the US that incrementally moves from using “LOCM only” to “IOCM only” strategy. For a 25:75 share of IOCM vs LOCM strategy, the average annual additional CM spend per hospital for inpatient angioplasties was $763, MARCE savings were $2,342, and average annual global savings were $1,579. For an even 50:50 split between “IOCM only” and “LOCM only” strategies, average CM spend was $1,526 vs MARCE, and net savings of $4,684 and $3,158, respectively. In the case of a 100% switch to IOCM, the results reflected our base-case estimate where we modeled the counterfactual of switching completely to IOCM from LOCM (for those not contraindicated for CM), resulting in $3,051 in additional CM spend per year, while gaining $9,367 in annual MARCE savings and $6,316 in net savings.
Figure 2. Annual per hospital MARCE savings, contrast media cost and global savings vs share of inpatient angioplasty procedures with IOCM.
Discussion
This study is a US-focused analysis examining the global hospital cost implications of switching from a “LOCM only” to an “IOCM only” strategy for inpatient arterial angioplasties with percutaneous intervention. Based on the conservative calculations in our model, aggregated annual cost savings between $30.7 million dollars may be realized across all US hospitals if a complete switch to IOCM was made for inpatient angioplasties. These numbers were largely a direct function of the MARCE ($34,765) and event-free ($19,061) angioplasty visit cost differential and IOCM’s MARCE associated risk reduction. Monte Carlo probabilistic sensitivity analysis yielded favorable cost savings in 91.9% of the simulations with an average cost saving of $61 per procedure.
These findings add to previous budget impact analysis that compared IOCM to LOCM in patients at increased risk of CI-AKI over a 3-year horizon and found a cumulative net percentage saving on the total hospital budget of 29%, 34%, 25%, and 33% in the settings of Germany, Italy, Poland, and Spain, respectivelyCitation21. Our study focuses on the cost (not charges) to the hospital for the angioplasty procedure for all inpatient (not just high risk patient) visitsCitation29. Corresponding with these costs, the mean (± SD) hospital LOS in the sample was found to be 7.66 (± 7.50) and 3.56 (± 3.84), respectively, averaging ∼4.1 additional days for visits involving MARCE from CI-AKI. These estimates confirm previously published numbers that found AKI diagnosis to be associated with substantial increase in use of healthcare resources, and excess hospital cost of careCitation30,Citation31. A recent study by Huber et al.Citation31 estimated that, for individuals undergoing vascular surgery in an inpatient setting, the incremental adjusted cost of AKI ranged from $9,100–$19,100, and was accompanied by significant unadjusted increases in mean LOS (4–9 days), intensive care unit stay (2–5 days), days on mechanical ventilation (1–5 days), and a decrease in home discharge (21.4–39.0%).
Given this excess burden, and the ongoing focus on cost containment, interventions that offer a potential opportunity for substantial cost savings are important to evaluate and implement. Therefore, it is unsurprising that multiple guidelines recommend the use of iso-osmolar CM as a preventive measure for at-risk patients (e.g. those with CKD and/or CVD)Citation32,Citation33. However, real-world practices in the choice of CM agents are largely influenced by several heterogeneous factors, including availability, internal hospital protocols, purchasing agreements, physician/technician preference, presence of allergic reactions, hemodynamic instability, and risk for CI-AKI. Beyond the choice of CM, the impact of CM volume is highly variable between physicians, making the administrative decision around CM one with important safety implicationsCitation34. Many factors are likely reflected in the variability of CM use across hospitals which was reported in this study. This simulation model provides additional information that can be used by hospital administration to determine an optimal financial approach. Focus on global costs when making purchasing decisions (i.e. CM costs only), instead of a comprehensive evaluation on unit price vs per procedure cost may hinder these cost controlling efforts. Our study considered a more comprehensive outlook and identified the economic benefits of IOCM vs LOCM use in clinical practice.
Evidence from the 2013 Healthcare Cost and Utilization Project (HCUP)-National Inpatient Sample indicated that ∼519,100 percutaneous coronary interventions (PCI) and 150,600 non-coronary angioplasties were carried out in an inpatient setting in 2013Citation35,Citation36. While there has been a gradual shift of these procedures from inpatient to an outpatient setting (2.4% per annum), Stuntz and Palak reported a 48% increase in PCI volume among patients with two or more high-risk characteristics, concluding that, despite the decrease in inpatient PCI volume, their share among high-risk individuals increased, suggesting a potential shift in the application of PCI to a higher-risk cohort of patients in the inpatient settingCitation36,Citation37. Implications of this finding with respect to our study are 2-fold: with payers and consumers increasingly looking at avenues with lower costs, the inpatient procedural volume may be expected to decrease in the coming years, but the rate of MARCE may be predicted to increase from the current estimates given the increased complexity of inpatient cases. Modeling for this hypothetical future 3 years from now, we ran the base-case model with several different key annual inputs: A 2.4% reduction in inpatient volume and an arbitrarily chosen 5% increase in MARCE rate would lead to global cost savings of $39.0 million US dollars. We caution that we did not consider the 2015 Medicare Access and CHIP Reauthorization Act’s (MACRA) Quality Payment Program and its anticipated impact on hospital reimbursements, additional penalties that could occur with high rates of AEs, as well as a potential for increased reimbursement with better clinical outcomes.
Limitations
Our study has all the limitations of retrospective studies that have limited control over bias and confounding variables. The relative risk reduction estimate was assumed to be a fixed parameter and applicable at the national and hospital sub-group level, while most of the other key variables (volume and price) varied at the sub-group level. Second, the unknown CM group was presumed to be comprised of each of the remaining CM strategies in proportion to their frequency in the sample after excluding the “unknown CM” share. Third, the calculated RRR value between “IOCM only” and “LOCM only” strategies were also considered to apply to the other strategies in competition with “IOCM only” (i.e. IOCM/LOCM mix, and unknown CM were at the same risk for MARCE as the LOCM only cohort). The “no CM” patient sub-group were assumed to be contraindicated for CM. This approach resulted in a conservative, downward bias (less cost savings) for our main results. To the degree this is not the case, we would anticipate an even larger cost saving associated with IOCM use. The model also did not differentiate between coronary and non-coronary interventions and, if they incurred, significant differences in contrast volume, thus these differences were not captured. So it is plausible for cost outliers (as a proxy for large volume in coronary procedures and, therefore, more CM-expensive procedures) to have an opposite impact on the calculated cost savings.
Conclusion
For an annual total of 513,882 inpatient angioplasties, with an adjusted MARCE rate of 6.8%, switching to a 100% “IOCM only” strategy was expected to avoid 2,900 MARCE events which, in turn, would lead to mean annual aggregated US (hospital sub-group range) cost savings of $30.7 million, $6,316 ($220 to $38,447) per hospital, and $60 per angioplasty procedure. Moving on to an “IOCM only” strategy would yield substantial cost savings to US hospitals where coronary and peripheral procedures are performed.
Transparency
Declaration of funding
This study was sponsored by GE Healthcare.
Declaration of financial/other relationships
EK is a consultant to, and CG and MPR are employees of, CTI Clinical Trial and Consulting Services, Inc., which is a paid consultant to GE Healthcare. PAM has been a consultant to GE Healthcare. TMT reports personal fees from GE Healthcare. ESB reports personal fees for consulting or speaker honoraria from GE Healthcare, Abbott Vascular, Amgen, Asahi, CSI, and Cardinal Health; book royalties from Elsevier; and grants from Boston Scientific and Osprey. ESB’s spouse is an employee of Medtronic. At the time of analysis, SRP was employed by CTI Clinical Trial and Consulting Services, Inc. Peer reviewers on this manuscript have received an honorarium from JME for their review work, but have no other relevant financial relationships to disclose.
Supplemental Material
Download MS Word (16.8 KB)References
- Chawla LS, Amdur RL, Shaw AD, Faselis C, Palant CE, Kimmel PL. Association between AKI and Long-Term Renal and Cardiovascular Outcomes in United States Veterans. Clinical Journal of the American Society of Nephrology: CJASN 2014;9:448-456
- Bernier-Jean A, Beaubien-Souligny W, Goupil R, et al. Diagnosis and outcomes of acute kidney injury using surrogate and imputation methods for missing preadmission creatinine values. BMC Nephrol 2017;18:141
- Heung M, Steffick DE, Zivin K, et al. Acute kidney injury recovery pattern and subsequent risk of CKD: an analysis of veterans health administration data. Am J Kidney Dis 2016;67:742-52
- Ishani A, Nelson D, Clothier B, et al. The magnitude of acute serum creatinine increase after cardiac surgery and the risk of chronic kidney disease, progression of kidney disease, and death. Arch Intern Med 2011;171:226-33
- Parr SK, Siew ED. Delayed consequences of acute kidney injury. Adv Chronic Kidney Dis 2016;23:186-94
- Wu V-C, Wu C-H, Huang T-M, et al. Long-term risk of coronary events after AKI. J Am Soc Nephrol 2014;25:595-605
- Mohammed NM, Mahfouz A, Achkar K, et al. Contrast-induced nephropathy. Heart Views Offic J Gulf Heart Assoc 2013;14:106
- Goldfarb S, McCullough PA, McDermott J, Gay SB. Contrast-Induced Acute Kidney Injury: Specialty-Specific Protocols for Interventional Radiology, Diagnostic Computed Tomography Radiology, and Interventional Cardiology. Mayo Clinic Proceedings. 2009;84:170-179
- Bucher AM, De Cecco CN, Schoepf UJ, et al. Is Contrast Medium Osmolality a Causal Factor for Contrast-Induced Nephropathy? BioMed Research International 2014;2014:1-6. doi:10.1155/2014/931413
- McCullough PA, Brown JR. Effects of intra-arterial and intravenous iso-osmolar contrast medium (iodixanol) on the risk of contrast-induced acute kidney injury: a meta-analysis. Cardiorenal Med 2011;1:220-34
- Aspelin P, Aubry P, Fransson S-G, et al. Nephrotoxic effects in high-risk patients undergoing angiography. N Engl J Med 2003;348:491-9
- Aspelin P, Aubry P, Fransson S-G, et al. Cost-effectiveness of iodixanol in patients at high risk of contrast-induced nephropathy. Am Heart J 2005;149:298-303
- Eng J, Wilson RF, Subramaniam RM, et al. Comparative effect of contrast media type on the incidence of contrast-induced nephropathy. A systematic review and meta-analysis comparative effect of contrast media type. Ann Intern Med 2016;164:417-24
- Heinrich MC, Ha¨berle L, Mu¨ller V, et al. Nephrotoxicity of iso-osmolar iodixanol compared with nonionic low-osmolar contrast media: meta-analysis of randomized controlled trials. Radiology 2009;250:68-86
- Jo S-H, Youn T-J, Koo B-K, et al. Renal toxicity evaluation and comparison between visipaque (iodixanol) and hexabrix (ioxaglate) in patients with renal insufficiency undergoing coronary angiography. J Am Coll Cardiol 2006;48:924-30
- Reed M, Meier P, Tamhane UU, et al. The relative renal safety of iodixanol compared with low-osmolar contrast media: a meta-analysis of randomized controlled trials. JACC: Cardiovasc Intervent 2009;2:645-54
- Shin D-H, Choi D-J, Youn T-J, et al. Comparison of contrast-induced nephrotoxicity of iodixanol and iopromide in patients with renal insufficiency undergoing coronary angiography. Am J Cardiol 2011;108:189-94
- Drummond MF, Sculpher MJ, Claxton K, et al. Methods for the economic evaluation of health care programmes. Oxford, UK: Oxford University Press; 2015
- Glick HA, Doshi JA, Sonnad SS, et al. Economic evaluation in clinical trials. Oxford: OUP; 2014
- McCullough PA, David G, Todoran TM, et al. Iso-osmolar contrast media and adverse renal and cardiac events after percutaneous cardiovascular intervention. J Comparat Effectiv Res 2017 In Press (available electronically, not yet in print-doi: 10.2217/cer-2017-0052. [Epub ahead of print])
- De Francesco M, Ronco C, Wacinski PJ, et al. Economic impact of contrast-induced acute kidney injury associated with invasive cardiology: role of iso-osmolar contrast media in Germany, Italy, Poland, and Spain. J Med Econ 2016;19:168-78
- CPI of US medical care services. Bureau of Labor Statistics (US Government). US Census. 2017; https://www.bls.gov
- Premier Healthcare Database: data the informs and performs. Charlotte, NC: Premier Healthcare Database: Date that Informs and Preforms: 2017
- Ernst FR, Chen E, Lipkin C, et al. Comparison of hospital length of stay, costs, and readmissions of alteplase versus catheter replacement among patients with occluded central venous catheters. J Hosp Med 2014;9:490-6
- AHA. Fast Facts on US Hospitals 2017. Chicago, IL: AHA; 2017
- National Center for Health Statistics.Health, United States, 2015: With Special Feature on Racial and Ethnic Health Disparities. p.288. Hyattsville, MD. 2016
- Census U. Census regions and divisions of the United States 2015; 2015 US Department of Labor (Bureau of Labor Services) Washington DC https://www.bls.gov/lau/laurdqa.htm#Q1
- Gapenski LC. Healthcare finance. Ann Arbor, MI: Health Administration Press; 2007
- Mehran R, Aymong ED, Nikolsky E, et al. A simple risk score for prediction of contrast-induced nephropathy after percutaneous coronary intervention: development and initial validation. J Am Col Cardiol 2004;44:1393-9
- Chertow GM, Burdick E, Honour M, et al. Acute kidney injury, mortality, length of stay, and costs in hospitalized patients. J Am Soc Nephrol 2005;16:3365-70
- Huber M, Ozrazgat-Baslanti T, Thottakkara P, et al. Mortality and cost of acute and chronic kidney disease after vascular surgery. Ann Vasc Surg 2016;30:72-81. e72
- King SB, Smith SC, Hirshfeld JW, et al. 2007 focused update of the ACC/AHA/SCAI 2005 guideline update for percutaneous coronary intervention. J Am Coll Cardiol 2008;51:172-209
- National Kidney Foundation. K/DOQI Clinical Practice Guidelines for Cardiovascular Disease in Dialysis Patients. Am J Kidney Dis 2005;45:S1-S154
- Amin AP, Bach RG, Caruso ML, et al. Association of variation in contrast volume with acute kidney injury in patients undergoing percutaneous coronary intervention. JAMA Cardiol 2017;2:1007-12
- AHRQ. 2010-2013 Healthcare cost and utilization project (HCUP). Overview of the national inpatient sample. Rockville, MD: AHRQ
- Stuntz M, Palac A. Recent trends in inpatient percutaneous coronary intervention volume in the United States: analysis of HCUP-NIS, 2010–2013. Paper presented at the International Society of Pharmcoeconomic and Outcomes Research (ISPOR); 2016 19th Annual European Congress of the International Society for Pharmacoeconomics and Outcomes Research 29 October-02 November 2016 Vienna, Austria
- Bortnick AE, Epps KC, Selzer F, et al. Five-year follow-up of patients treated for coronary artery disease in the face of an increasing burden of co-morbidity and disease complexity (from the NHLBI Dynamic Registry). Am J Cardiol 2014;113:573-9