
 ?Mathematical formulae have been encoded as MathML and are displayed in this HTML version using MathJax in order to improve their display. Uncheck the box to turn MathJax off. This feature requires Javascript. Click on a formula to zoom.
Abstract
Aims: To estimate a preference-based single index for the disease-specific instrument (AcroQoL) by mapping it onto the EQ-5D to assist in future economic evaluations.
Materials and methods: A sample of 245 acromegaly patients with AcroQoL and EQ-5D scores was obtained from three previously published European studies. The sample was split into two: one sub-sample to construct the model (algorithm construction sample, n = 184), and the other one to confirm it (validation sample, n = 61). Various multiple regression models including two-part model, tobit model, and generalized additive models were tested and/or evaluated for predictive ability, consistency of estimated coefficients, normality of prediction errors, and simplicity.
Results: Across these studies, mean age was 50–60 years and the proportion of males was 36–59%. At overall level the percentage of patients with controlled disease was 37.4%. Mean (SD) scores for AcroQoL Global Score and EQ-5D utility were 62.3 (18.5) and 0.71 (0.28), respectively. The best model for predicting EQ-5D was a generalized regression model that included the Physical Dimension summary score and categories from questions 9 and 14 as independent variables (Adj. R2 = 0.56, with mean absolute error of 0.0128 in the confirmatory sample). Observed and predicted utilities were strongly correlated (Spearman r = 0.73, p < .001) and paired t-Student test revealed non-significant differences between means (p > .05). Estimated utility scores showed a minimum error of ≤10% in 45% of patients; however, error increased in patients with an observed utility score under 0.2. The model’s predictive ability was confirmed in the validation cohort.
Limitations and conclusions: A mapping algorithm was developed for mapping of AcroQoL to EQ-5D, using patient level data from three previously published studies, and including validation in the confirmatory sub-sample. Mean (SD) utilities index in this study population was estimated as 0.71 (0.28). Additional research may be needed to test this mapping algorithm in other acromegaly populations.
Keywords:
Introduction
Acromegaly is an endocrine disorder characterized by elevated levels of growth hormone (GH) and insulin-like growth factor-1 (IGF-1). The incidence of acromegaly is ∼3–4 cases per million, and the prevalence is 60 cases per millionCitation1. The mean age at diagnosis is ∼40 years; many patients have signs and symptoms of the disease 4–10 years prior to diagnosisCitation2. Clinical manifestations of acromegaly include changes in facial features, sweating, menstrual upset, headache, arthritis, carpal tunnel syndrome, diabetes or impaired glucose tolerance, impaired potency and/or libido, and hypertensionCitation3.
Patients with acromegaly (active or biochemically controlled) have poorer health-related quality-of-life (HRQoL) than control samples from the general population or patients with other chronic diseases including arthritis, chronic lung disease, and hypertension. Patients with acromegaly report levels of HRQoL which are similar to those in patients with cancer, human immunodeficiency virus, diabetes mellitus, and strokeCitation4–10.
To date, several studies have evaluated HRQoL in patients with acromegaly using generic HRQoL measures such as the SF-36Citation5,Citation7,Citation11. In addition to generic HRQoL measures, AcroQoL, a disease specific measure developed and validated by Webb et al.Citation12,Citation13, is increasingly used to assess and monitor HRQoL in patients with acromegalyCitation14–16. Reports from five countries (The Netherlands, Switzerland, Spain, the UK, and Turkey) showed that patients with active acromegaly had significantly lower AcroQoL scores than patients in remissionCitation16. AcroQol has also been used to evaluate the association between remission status, treatment modalities, and HRQoLCitation14,Citation15.
In order to assess the impact of interventions on HRQoL, randomized controlled trials (RCTs) increasingly include disease-specific HRQoL questionnaires. Nevertheless, most of these questionnaires cannot be used to generate Quality Adjusted Life Years (QALYs) and, hence, are not suitable for cost-utility analysis. A QALY corresponds to 1 year of perfect health. The use of QALYs to assess the health benefit of interventions is widespread and recommended by Health Technology Assessments (HTA) institutions such as the National Institute for Health and Clinical Excellence (NICE) in the UKCitation17. QALYs can be derived using direct methods (e.g. time trade-off [TTO], or standard gamble [SG]) or indirect methods based on preferences assigned to health states defined by generic HRQoL questionnaires (e.g. the EQ-5D). The most common approach is to include a preference-based utility measure in the trial. However, in some cases, such measures may not be included, but utility or QALYs must be derived to perform cost-utility analysis using data from those trials. In cases where a disease-specific measure was included in a trial, but a preference-based measure was not, it can be possible to produce algorithms which permit scores on the disease-specific measure to be “transferred” to the utility measure, a process known as “mapping”Citation18.
Mapping AcroQoL scores to utility values would allow values to be obtained for use in economic analyses in cases where the AcroQoL, but not a preference-based measure, has been included in the study. The primary objective of this research was, therefore, to obtain a predictive function between AcroQoL scores and EQ-5D utility values, to transform the health benefits obtained in clinical trials to values for use in economic evaluations, and more specifically in cost-utility analysis.
Methods
Source data: studies performed using AcroQoL and EQ-5D
A comprehensive literature search was performed in MEDLINE to identify studies in patients with acromegaly using AcroQoL and EQ-5D questionnaires. The search strategy was defined including “AcroQol” and “EQ-5D” and it selected any kind of study using both questionnaires and covering all years. Three studiesCitation13,Citation19,Citation20 were identified in which AcroQol and EQ-5D were used to assess HRQoL in the same sample of acromegaly patients at the same time. These studies were selected to provide data for the modeling exercise and are described below. The identification of all studies fulfilling the selection criteria published when the study was implemented was checked with the list of AcroQOoL requests received by AcroQoL’ developers (authors XB and SW).
Webb et al.Citation13 (2006): Spanish study
The aim of this study was to validate the AcroQoL questionnaire as a disease-specific questionnaire for the assessment of HRQoL in acromegaly. A prospective, observational multi-center study was designed. A total of 106 patients were included (42 with active disease and 64 with treated, stable disease) and compared to a reference group of the Spanish population. Sociodemographic data, clinical activity, co-morbidity, GH, IGF-I, and HRQoL (overall perception of health state, EQ-5D, and AcroQoL) were evaluated.
Tiemensma et al.Citation19 (2011): Dutch study
The aim of this study was to explore illness perceptions and their association with QoL in patients with long-term biochemical control of acromegaly. It was a cross-sectional study in which patients with long-term biochemical control of acromegaly were included and compared with Dutch reference populations: patients with acute pain or chronic pain, Cushing’s syndrome, chronic obstructive pulmonary disease, and vestibular schwannoma. In addition to other questionnaires, both EQ-5D and AcroQoL were administered. Eighty-one acromegaly patients included were diagnosed by assessment of clinical signs and symptoms and biochemical tests, were over 18 years of age, and in remission as defined by strict biochemical criteria for at least 1 year.
Paisley et al.Citation20 (2007): United Kingdom study
The aim of this study was to re-evaluate AcroQol and EQ-5D, in addition to other questionnaires, in a longitudinal study, in order to determine change over time in HRQoL, as well as the effect of different treatment modalities on HRQoL. Responses from 80 patients provided to both questionnaires at baseline were used for the evaluation in the current research. A total of 80 patients were included, and 66% presented with active or uncontrolled disease.
Data extraction
The corresponding authors for the above three publications were contacted and provided permission to combine all acromegaly patients in their databases, so as to obtain a bigger sample size for the mapping study. This led to a total sample of 245 patients with acromegaly.
Instruments
HRQoL in all of the studies was measured using the AcroQoLCitation21 and the EQ-5DCitation22.
AcroQol
AcroQoL is a disease-specific questionnaire to assess HRQoL in patients with acromegaly which has been used in several clinical trialsCitation13. It comprises 22 questions, each of which is answered on a 5-point Likert scale measuring either frequency (1 = “always” and 5 = “never”) or agreement (1 = “completely agree” and 5 = “completely disagree”). The maximum score is 110 (100%), while the worst possible score is 22 (0%). The questionnaire includes two different scales, a Physical Performance scale with eight items and a Psychological Well-Being scale with 14 items. The latter is further sub-divided into areas addressing Appearance (seven items) and Personal relationships (seven items)Citation12,Citation21.
EQ-5D
The EQ-5D is the most widely used generic preference-based measure of HRQoL which produces utility scores. The EQ-5D questionnaire consists of a five-dimensional descriptive system and a visual analog scale (VAS). The descriptive system has five dimensions (mobility, self-care, usual activity, pain/discomfort, and anxiety/depression) and three levels: no problems, some problems, and extreme problems. Utility indices provide weights on a scale anchored at 0 (dead) to 1 (full health) for each of the 243 states defined by the descriptive system. These are used for the estimation of QALYs, based on the stated preferences of members of the general populationCitation23. Respondents are also asked to rate their overall health status on a 0–100 hash-marked, vertical visual analog scale (EQ-VAS), on which 0 represents the worst imaginable health state and 100 represents the best possible imaginable health state. For the present analysis, health utilities derived from the UK value set were usedCitation24. The UK’s NICE has specified in their guidance that the EQ-5D is their instrument of choice for generating utility values for QALY analysis and the evaluation of cost-effectivenessCitation17.
Model development and selection
The construction and testing of the algorithm to map AcroQoL responses onto EQ-5D utilities was conducted in four steps. The objective of the regression model was to assess the association between AcroQoL and EQ-5D, by studying the variations of EQ-5D based on the values of the AcroQol scores. The regression model was not designed to predict future EQ-5D scores.
First, the original sample of 245 acromegaly patients was randomly split into algorithm construction (75% of patients) and validation samples (25% of patients). The construction cohort included 184 patients, allowing for the assessment of 5–6 independent variables in the regression model (general rule of 35 patients per variable included). As a second step, using the construction sample, AcroQoL global score, sub-scales, and individual items were tested in bivariate and regression analysis for potential inclusion in the models. The 22 AcroQoL items were tested individually, by including them as discrete dummy variables, and also categorized as “HRQoL affected” (corresponding to response options 1 or 2 on any item) or “HRQoL significantly affected” (response option 1 in any item). Categorical variables were analyzed using analysis of variance and continuous variables using Pearson’s correlation coefficient. Correlation coefficients of 0.10, 0.10–0.5, and >0.5 were considered weak, moderate, and strong associations, respectivelyCitation25. Missing data were not estimated, so the actual number of paired comparisons varied in the different comparisons. In all models, the dependent variable was the EQ-5D utility score. GH and IGF-1 were not included due to the absence of data in some patients and the lack of standardized laboratory assessments between studies. Transformations like logarithm of utility +1 or square root were applied to the EQ-5D, and various interaction terms were created and tested as predictors.
In the third step, several multiple regression models were explored to determine the optimal model to predict EQ-5D utility scores. Additive Generalized Linear Models incorporating main effects were used. The simplest, reference model was one which included only the EQ-5D utility scores and the Physical Dimension summary score. Other models included AcroQoL sub-scale scores, individual AcroQoL items, and different categorizations of AcroQoL items as independent variables. Individual AcroQoL items and categorizations with statistical significance in bivariate analysis were included in the model.
In addition, the following models were also tested in order to assess the potential improvement in model fit: (1) two-part model, (2) Tobit model, and (3) Generalized Additive Model (GAM). The two part-model included a first part using a multinomial logistic regression to predict the probability of categories in each of the five items of the descriptive system of the EQ-5D. Based on estimation reached in step 1, the descriptive health states for patient level were estimated. The second part of the model comprised OLS regression to predict EQ-5D utility using the health states estimated in part one as an independent variable, as well as using additional variables based on the previous analyses.
Selection of the optimal model was based on the following four criteria: explanatory power (assessed using adjusted R-squared); the consistency of estimated coefficients (sign and parameter estimation); normality of prediction errors; and simplicity (number of variables included in the model). Two dummy variables corresponding to studies 1 and 2 were included in the selected model, in order to check systematic differences in the samples.
Prediction errors was assessed using mean error (ME), mean absolute error (MAE), root mean squared error (RMSE), and a percentage error under 5%, 10%, and 15% of the overall scale of independent variable. The normality of prediction errors was analyzed using the Shapiro-Wilks test, White’s test, and the Breusch-Pagan/Cook-Weisberg tests. The model’s simplicity was evaluated by determining whether predictors were readily available and how many predictor variables the model required. Analyses were performed using STATA-12 (small STATA).
Confirmatory analysis methodology
In the fourth and last step, the predictive capacity of the models was evaluated in the validation sample. In order to establish the generalizability of the models, the algorithms produced using the construction sample (184 patients) were applied to the validation sample (61 patients). AcroQoL observations were used to estimate EQ-5D values. Means of observed and estimated EQ-5D values were compared using paired Student t-test and Intraclass Correlation Coefficient (ICC).
Results
A total of 245 patients with acromegaly were included for the mapping analysis, 13 patients were excluded due to non-complete data on both AcroQol and EQ-5D questionnaires.
Patients’ characteristics based on the published results from the selected studies are presented in . Patients included in the Dutch study were on average older, with higher numbers previously treated with transsphenoidal surgery. The use of oral therapies was similar across studies. The most relevant difference across the three studies was in terms of disease control. While the Dutch study enrolled only patients with controlled disease, the Spanish and UK studies both also included uncontrolled patients.
Table 1. Patient characteristics in the selected studies.
A sub-sample of 184 subjects (75%) was used to construct the mapping algorithm, and responses from the remaining 61 subjects (25%) were used to validate it. In the construction sample, mean age (SD) was 54.8 (14.0) years and slightly more than half of the sample (52.7%) were female.
shows the score distributions on the AcroQoL scores and EQ-5D. The mean (SD) score on the AcroQoL Global Score was 62.3 (18.5). The EQ-5D data showed a noticeable left skewed distribution (skewness = –1.26), with a two modal distribution, and with the majority of scores indicating better health (mean of 0.71 on a scale of –0.594 to 1). Various transformations were tested, but none improved the distribution so, due the relatively large sample size, EQ-5D utility scores were interpreted as showing a normal distribution.
Table 2. Score distributions on the AcroQoL and EQ-5D.
The results of the bivariate analysis showed that the physical sub-scale score (Pearson r = 0.73; p < .0001) and the psychological sub-scale score (Pearson r = 0.4; p < .0001) both had statistically significant correlations with the EQ-5D utility score and with all AcroQol items, except items 10 and 16 (i.e. “people stare at me because of my appearance” and “I snore at night”).
The initial model including only global AcroQol score as independent variable obtained an adjusted R-square of 0.4031. shows the results of the most promising models tested alongside the basic reference model (Model 1). In terms of adjusted R-square and Root MSE, the best-performing model (Model 12) incorporated 16 dummy variables. However, the model finally selected (Model 11) achieved very similar goodness of fit statistics with only three variables, and, therefore, more fully met the requirement for parsimony. This model improved on the fit obtained with the most basic, reference model with an adjusted R-square of 0.56 compared to 0.53 for the basic model. Very similar results were obtained with models which incorporated interaction and quadratic terms and these were, therefore, not selected as they were considered to unnecessarily complicate the model.
Table 3. Regression coefficients for the best four models (Model 11 was the model finally selected).
Utility values derived from Model 11 can be obtained by applying the following formula:
Model diagnostics
shows the results of the analysis of residuals in the selected models. Only minimal differences were observed between observed and estimated mean values in all of the models. Error terms were obviously larger for quartiles because of a smaller number of patients scoring at the extremes. In Model 11, 45% of patients obtained estimated utility scores with an error ≤10% compared with observed utility values. However, the percentage of patients with error ≤10% increased to 50% in patients with an observed utility score below 0.
Table 4. Analysis of residuals in the different models tested.
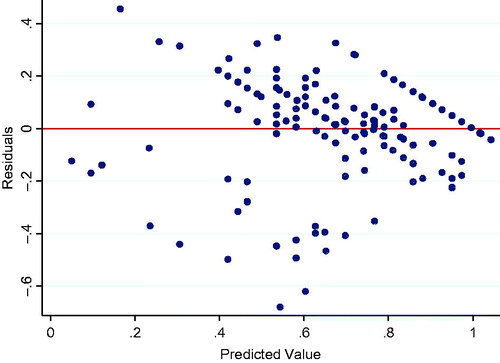
The results of the Shapiro-Wilks test, White’s test, and the Breusch-Pagan/Cook-Weisberg test for normality of residuals in Model 11 indicated that the residuals were not normally distributed (p < .0001), and that they were heteroscedastic. This is further demonstrated by the scatter-plot of the residuals for Model 11 shown in . Examination of the residual plot suggested error variance at lower predicted values. The higher variance in predicted values for lower utility values is likely related to the lower number of patients in these states. To improve the residuals, particularly for predicted values for worse health states, a higher level of problems in individual items of AcroQoL and interaction terms between scores were included in the model, but they did not help to normalize the distribution of the residuals. Coefficients corresponding to dummy variables to define studies 1 and 2 were not statistically significant (p-value = 0.3702 and .1071, respectively).
Figure 1. Scatterplot of residuals in the selected model.
The two-part model, the Tobit model, and the GAM did not improve the predictive capacity of model 11 derived using a linear regression model. The distribution of residuals derived using the Tobit model did not improve the distribution obtained with model 11, obtaining a higher AIC value. The smoothing parameter obtained by physical function in GAM model was non-significant, indicating the adequacy of the linear assumption in the relationship between EQ-5D utility values and the physical sub-scale score of AcroQoL.
Confirmatory analysis
The predictive ability of the five selected models model was tested by estimating utilities in the 61-patient validation sample. Predicted utilities derived from the validation sample are shown in . The lowest mean absolute error in the confirmatory sample was obtained in Model 11 (13%). Observed and predicted utilities were strongly correlated (Spearman r = 0.73, p < .001) and the paired Student t-test revealed non-significant differences between means (p > .05). The ICC between observed and predicted utilities obtained in the validation sample was 0.60, indicating moderate agreement.
Table 5. Confirmatory analysis for the different models tested.
Discussion
This is the first research to produce an algorithm which allows one to derive EQ-5D utility scores based on scores on a disease-specific measure for patients with acromegaly. The availability of this algorithm means that researchers interested in obtaining EQ-5D utilities for patients with acromegaly will be able to do so, even when the instrument itself was not included in the studies of interest, as long as the AcroQol was included. The final model selected met the criteria of explanatory power, consistency of estimated coefficients, normality of prediction errors, and simplicity. The final model included three variables (the AcroQol Physical dimension score, two response categories from AcroQol item 9, and one or two response categories from item 14). All of the variables finally included were related to aspects of physical functioning measured by the AcroQol, and none to psychological factors.
The results of this exercise showed the model to be relatively robust with goodness of fit statistics (adjusted R2 of 0.5573) in line with those observed in similar mapping exercisesCitation18. The model’s robustness was supported by the fact that observed utility scores in the sample used for validation were similar to the estimated scores using the regression equation. It should be noted, however, that the model’s predictive ability was poorer for very poor health states (utility values <.02). This finding has been noted in other studiesCitation26 and is likely due to the low sample size. Future studies could try to obtain more robust estimations for this sub-group of patients, although it may be difficult given the scarcity of patients with such poor health on EQ-5D. Researchers wishing to use this algorithm should be aware of this limitation, which could be taken into account using sensitivity analysis in any cost-utility analyses based on results obtained after applying the algorithm. Researchers should also be aware that the algorithm is only relevant for the MVH UK EQ-5D tariffCitation24 and that if they wish to transfer AcroQol scores to other EQ country-specific tariffs they would need to determine whether the same model can be applied. The same valuation set for patients coming from different studies and countries was used to eliminate potential heterogeneity in EQ-5D utility values between patients.
In the present study, the physical aspects of HRQoL measured in the AcroQol were the unique aspects that contributed significantly to estimations of EQ-5D utility scores. This fact is mainly explained by the lack of cognitive or psychological factors (except presence of anxiety and depression) in the EQ-5D. Items included in the psychological scale of the AcroQol refer to issues related to appearance (e.g. I feel ugly, I look awful in photographs, I look different in the mirror) and social relationships (e.g. I avoid going out with friends, I feel rejected by people because of my illness, I have problems with sexual relationships), neither of which are areas of HRQoL that are covered specifically by EQ-5D.
Utility data derived from EQ-5D have some characteristics that can require the use of non-normal distributions. Utility values usually have an upper bounding at full health, have gaps between values, and tend to have distinct bimodal or trimodal distributionsCitation27,Citation28. Several models including the Tobit model, two-part model or GAM, have been tested to improve the mapping function obtained using the linear regression model. Nevertheless, none of the models improved the goodness of fit or the distribution of the residuals. In addition to the models tested, the beta regression model was also rejected due to the presence of negative utilities in our sample.
Strengths of the present study included the relatively large sample size, especially considering acromegaly’s rare disease status. The available sample size also meant that it was possible to randomly split the sample into two sub-samples which provided an independent means to construct the model and then to validate it. As mentioned, this provides additional evidence of the model’s robustness, although it would be useful to test it in further samples. An additional strength of the study was the heterogeneous nature of the sample in terms of country of origin, age, sex, treatment history, level of disease control, and variability in terms of AcroQoL scores. Access to individual patient level data allowed for the analysis of the impact of several factors on the mapping function, as well as the country or study factor. This provides some level of support for the generalizability of the model. The low level of missing data observed used to obtain data for modeling (overall rate of missing responses of 5%) was another advantage of the present analysis, as it suggests that data would be included from all relevant groups, thereby limiting selection bias.
Limitations of the present study include the small proportion of patients in more severe health states. As mentioned, this led to much higher levels of error in patients in very poor health, so the model should be used with caution in samples with higher numbers of severe patients. Second, the fact that the three studies used to provide data for modeling were carried out in different countries using different language versions of the two instruments should be taken into account. Although there is no evidence that such factors affect AcroQol or EQ-5D scores, and language versions of both instruments are adapted using rigorous methodologiesCitation21,Citation29, the possibility of cultural and/or linguistic factors cannot be tested with data available. Recently a new study in acromegaly patients using AcroQol and EQ-5D has been publishedCitation30, but the current study was finalized. The inclusion of the most recent study in the overall sample analyzed in this study would increase the statistical power to define and validate the mapping algorithm. A third potential study limitation is the high mean age reported in studies used for the mapping exercise. It reflects the late diagnosis of acromegaly and it is expected to impact on patients’ quality-of-life, especially for physical dimensions. However, these studies reflect the population treated in terms of usual clinical practice. Finally, it is important to consider that the validation cohort was obtained from the same patient sample, obtaining a sample of patients comparable to that obtained for the mapping function development. Use of this methodological approach will reduce the variability between both samples and increase the goodness of fit of the mapping function in the validation cohort.
From a statistical standpoint, it is important to note that some models (models 12 and 13) included a number of co-variates larger than what may be appropriate for modeling according to the sample size. These models were assessed for exploratory purposes, and none of them were selected as a final model for mapping purposes. Despite the use of several transformations, it was not possible to obtain a normal distribution for utility values.
Conclusions
Patients with acromegaly may have poor health-related quality-of-life. This study provides the first known research that would allow trials using the AcroQoL questionnaire to provide a conversion to EQ-5D utility scores. Although preference-based measures would ideally be administered prospectively to determine health state values in clinical studies, this is not always the case, and the use of regression equations to estimate utility values for health states can facilitate cost-utility analyses. This research has demonstrated that it is possible to estimate a robust model for predicting EQ-5D utility score from the acromegaly disease-specific PRO scale (AcroQoL). Although the errors associated with the predictor model were greater at the lower end of the utility scale, the model’s predictive ability was high and stable for the majority of EQ-5D states across the validation and confirmatory samples. The algorithm from the selected model (Model 11) offers an alternative method of obtaining a preference-based utility index in cases when a preference-based measure was not collected during clinical research. Additional research may be needed to test the current mapping algorithm in other acromegaly populations (i.e. including a higher percentage of severe patients) and further validate the mapping function derived in this study.
Transparency
Declaration of funding
This project was performed with an unrestricted grant from Novartis Oncology. AF, a Novartis Oncology employee when the study was implemented, participated in the study design, preparation and revision of the statistical analysis, and preparation of the manuscript.
Declaration of financial/other interests
AF was an employee of Novartis Oncology when the study was performed. All the other authors declare that they have no competing interests. Peer reviewers on this manuscript have received an honorarium from JME for their review work, but have no other relevant financial relationships to disclose.
Previous presentations
Partial information included in this paper has been previously presented as a poster at the European ISPOR Congress 2017 (Glasgow).
Acknowledgments
The authors want to thank Dr Lazaros Andronis, Health Economics Unit, School of Health and Population Sciences, University of Birmingham, UK, and Dr Billingsley Kaambwa, Health Economist, School of Medicine, Flinders University, Australia, for their methodological comments to the project.
References
- Ben-Shlomo A, Melmed S. Acromegaly. Endocrinol Metab. Clin North Am 2008;37:101-22,viii
- Chanson P, Salenave S. Acromegaly. Orphanet J Rare Dis 2008;3:17
- Holdaway IM, Rajasoorya C. Epidemiology of acromegaly. Pituitary 1999;2:29-41
- Alonso J, Ferrer M, Gandek B, et al. Health-related quality of life associated with chronic conditions in eight countries: results from the International Quality of Life Assessment (IQOLA) Project. Qual Life Res 2004;13:283-98
- Biermasz NR, van Thiel SW, Pereira AM, et al. Decreased quality of life in patients with acromegaly despite long-term cure of growth hormone excess. J Clin Endocrinol Metab 2004;89:5369-76
- Fleming CA, Christiansen D, Nunes D, et al. Health-related quality of life of patients with HIV disease: impact of hepatitis C coinfection. Clin Infect Dis 2004;38:572-8
- Miller A, Doll H, David J, et al. Impact of musculoskeletal disease on quality of life in long-standing acromegaly. Eur J Endocrinol 2008;158:587-93
- Pittock SJ, Mayr WT, McClelland RL, et al. Quality of life is favorable for most patients with multiple sclerosis: a population-based cohort study. Arch Neurol 2004;61:679-86
- Rannou F, Poiraudeau S, Berezné A, et al. Assessing disability and quality of life in systemic sclerosis: construct validities of the Cochin Hand Function Scale, Health Assessment Questionnaire (HAQ), Systemic Sclerosis HAQ, and Medical Outcomes Study 36-Item Short Form Health Survey. Arthritis Rheum 2007;57:94-102
- Wang R, Wu C, Zhao Y, et al. Health related quality of life measured by SF-36: a population-based study in Shanghai, China. BMC Public Health 2008;8:292
- Rowles SV, Prieto L, Badia X, et al. Quality of life (QOL) in patients with acromegaly is severely impaired: use of a novel measure of QOL: acromegaly quality of life questionnaire. J Clin Endocrinol Metab 2005;90:3337-41
- Webb SM, Prieto L, Badia X, et al. Acromegaly Quality of Life Questionnaire (ACROQOL), a new health-related quality of life questionnaire for patients with acromegaly: development and psychometric properties. Clin Endocrinol (Oxf) 2002;57:251-8
- Webb SM, Badia X, Surinach NL. Spanish AcroQol study group. Validity and clinical applicability of the acromegaly quality of life questionnaire, AcroQoL: a 6-month prospective study. Eur J Endocrinol 2006;155:269-77
- Neggers SJ, van Aken MO, de Herder WW. Quality of life in acromegalic patients during long-term somatostatin analog treatment with and without pegvisomant. J Clin Endocrinol Metab 2008;93:3853-9
- Hua SC, Yan YH, Chang TC. Associations of remission status and lanreotide treatment with quality of life in patients with treated acromegaly. Eur J Endocrinol 2006;155:831-7
- Webb SM, Badia X. Quality of life in growth hormone deficiency and acromegaly. Endocrinol Metab Clin North Am 2007;36:221-32
- National Institute for Health and Clinical Excellence (NICE). Incorporating health economics in guidelines and assessing resource impact. In: Guideline Development Methods, Chapter 8. NICE; updated March 2005. http://www.nice.org.uk/niceMedia/pdf/GuidelinesManualChapter8.pdf
- Brazier JE, Yang Y, Tsuchiya A, et al. A review of studies mapping (or cross walking) non-preference based measures of health to generic preference-based measures. Eur J Health Econ 2010;11:215-25
- Tiemensma J, Kaptein AA, Pereira AM, et al. Affected illness perceptions and the association with impaired quality of life in patients with long-term remission of acromegaly. J Clin Endocrinol Metab 2011;96:3550-8
- Paisley AN, Rowles SV, Roberts ME, et al. Treatment of acromegaly improves quality of life, measured by AcroQol. Clin Endocrinol (Oxf) 2007;67:358-62
- Badia X, Webb SM, Prieto L, et al. Acromegaly Quality of Life Questionnaire (AcroQoL). Health Qual Life Outcomes 2004;2:13
- Rabin R, de Charro F. EQ-5D: a measure of health status from the EuroQol Group. Ann Med 2001;33:337-43
- Szende A, Oppe M, Devlin N. EQ-5D value sets. Inventory, comparative review and user guide. Dordrecht: Springer; 2007
- Dolan P. Modeling valuations for EuroQol health states. Med Care 1997;35:1095-108
- Cohen J: Statistical power analysis for the behavioral sciences. 2nd ed. Hillsdale, NJ: Lawrence Erlbaum Associates; 1988
- Gu NY, Botteman MF, Ji X, et al. Mapping of the Insomnia Severity Index and other sleep measures to EuroQol EQ-5D health state utilities. Health Qual Life Outcomes 2011;9:119
- Pullenayegum EM, Tarride JE, Xie F, et al. Analysis of health utility data when some subjects attain the upper bound of 1: are Tobit and CLAD models appropriate? Value Health 2010;14:487-94
- Basu A, Manca A. Regression estimators for generic health-related quality of life and quality-adjusted life years. Med Decis Making 2012;32:56-69
- Herdman M, Fox-Rushby J, Rabin R, et al. Producing other language versions of the EQ-5D. In: Brooks R, de Charro F, Buxton M, editors. EuroQol: the EQ-net project on health status measurement and validation. Chp 11. Dordrecht, The Netherlands: Kluwer Academic Publishers; 2003. p 183-9
- Kyriakakis N, Lynch J, Gilbey SG, et al. Impaired quality of life in patients with treated acromegaly despite long-term biochemically stable disease: results from a 5-years prospective study. Clin Endocrinol (Oxf) 2017;86:806-15