
Abstract
Aims: To estimate incremental healthcare resource utilization (HRU) and costs associated with skeletal-related events (SREs) secondary to multiple myeloma (MM), and HRU and cost differences in patients with one vs multiple SREs.
Methods: Adults with MM diagnosis between January 1, 2010–December 31, 2014, with benefits coverage ≥12 months pre- and ≥6 months post-diagnosis were followed to last coverage date or December 31, 2015, excluding patients with prior anti-myeloma treatment or cancers. SREs were identified by diagnosis or procedure codes (pathological fracture, spinal cord compression, radiation, or surgery to the bone). SRE patients (index = first post-diagnosis SRE) were propensity score matched 1:1 to patients without SRE (assigned pseudo-index) using baseline characteristics, and ≥1 month of continuous enrollment after index/pseudo-index date was required. Per-patient-per year (PPPY) HRU and costs (2016 US$) were determined for inpatient, outpatient, emergency department (ED), and outpatient pharmacy services during follow-up. Wilcoxon signed rank for means and McNemar’s tests for proportions were used to assess differences. Negative binomial regression and generalized linear regression analyses estimated differences in HRU and costs, respectively, for the comparison of single vs multiple SREs.
Results: Each cohort included 848 patients (mean age = 61 – 62 years, 57% male) with no significant differences in pre-index demographic or clinical characteristics between matched cohorts. Versus non-SRE patients, SRE patients had significantly higher PPPY use (p < .0001) of inpatient hospitalizations, ED visits, outpatient pharmacy, and higher direct medical costs ($188,723 vs $108,160, p < .0001). Adjusted PPPY total costs were $209,820 in patients with multiple SREs; $159,797 in patients with one SRE.
Limitations: SRE misclassification and residual confounding are possible.
Conclusions: Among patients with MM, average annual costs were substantially higher in patients with SRE compared with matched non-SRE patients. The economic burden of SRE increased further with multiple events.
Introduction
Multiple myeloma (MM) is a rare and incurable hematologic cancer that develops in the plasma cells of the bone marrowCitation1. MM accounts for 1.8% of all new cancer cases in the US, and ∼10% of all hematologic cancersCitation2. In 2017, ∼30,300 new cases of MM are expected to be diagnosed in the US, with nearly 12,600 myeloma-related deaths expected to also occur this yearCitation3. Data from 2007–2013 suggest that only 50% of individuals with MM will survive for at least 5 years following their initial diagnosisCitation3.
Bone lesions are a hallmark of MM, since this condition is characterized by dramatically increased osteoclast activity and proliferation, which leads to excessive bone resorption. The negative effects on bone health may be further exacerbated by reduced osteoblast (bone-building) activityCitation4,Citation5. An estimated 60–80% of patients with MM report bone pain and/or have lytic lesions at diagnosis with increasing prevalence during the course of their illnessCitation6–10.
Because of myeloma-related osteolysis, bone pain, hypercalcemia, and skeletal-related events (SREs) (defined as pathological fracture [PF], spinal cord compression [SCC], bone radiation [RAD], and bone surgery [SURG]) commonly occur in patients with MMCitation11,Citation12. Skeletal involvement and bone complications are painful, and, associated with decreased health-related quality-of-life (HRQoL), increased narcotic use, and worse prognosisCitation13–15. Results from a single institution study (n = 49), for example, indicate that bone complications can significantly increase the risk of early death in MM. In that study, patients with pathologic fractures had an overall survival of ∼17.6 months compared with 57.3 months for patients without pathological fracturesCitation13. Therefore, clinical guidelines, including those from the National Comprehensive Cancer Network (NCCN), the European Myeloma Network, and the European Society for Medical Oncology (ESMO), recommend the use of anti-resorptive agents (i.e. intravenous bisphosphonates [zoledronic acid, pamidronate disodium] or denosumab) as prophylaxis for SREs after MM has been diagnosedCitation16–18.
Prior studies have shown that, among patients with MM, those with SRE have significantly higher healthcare resource utilization (HRU) and costs compared with those who have not experienced SRECitation11,Citation19. In patients with SRE, inpatient care accounts for 49–59% of total healthcare costsCitation20,Citation21. Among patients with MM hospitalized for SRE, mean inpatient health plan costs range from $23,347 for bone surgery to $43,691 for spinal cord compressionCitation11.
Evidence on the incremental direct medical cost associated with the occurrences of single or multiple SREs in patients with MM is limited, and the most recent published estimates for the US represent the experience of patients diagnosed only through 2010Citation19. The current study was undertaken to provide updated estimates of (1) differences in the HRU and healthcare costs for MM patients with and without SRE, and (2) differences in HRU and cost between MM patients who have had a single SRE compared with those of patients who have experienced multiple SREs.
Methods
Patient selection
In this retrospective cohort study, the IQVIA PharMetrics Plus administrative healthcare claims database was used, and the study period extended from January 1, 2009 through December 31, 2015. The PharMetrics Plus database is comprised of adjudicated inpatient, outpatient, and pharmacy claims for more than 150 million unique enrollees across the US from 2006 onward. These data represent care delivered in 80–90% of US hospitals, and provide a representative sample of commercially-insured individuals aged 65 years and under.
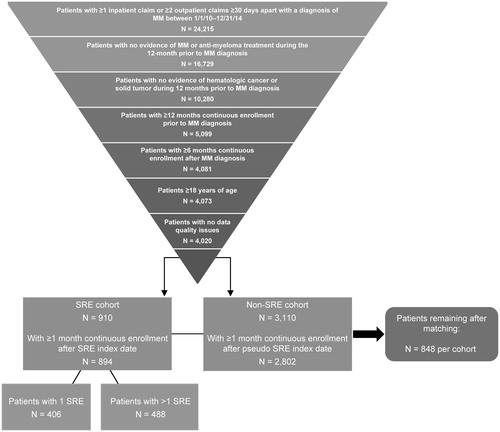
For this study, we identified adults (≥18 years of age) who had at least one inpatient or two non-ancillary outpatient claims separated by at least 30 days with a MM diagnosis code (International Classification of Disease [ICD]-9 203.0x, ICD-10 C90.0x) for services incurred between January 1, 2010 and December 31, 2014 (). Study patients also had continuous health plan enrollment for at least 12 months before and 6 months after the date of their first MM diagnosis claim. The study excluded patients with evidence of anti-myeloma treatment, including stem cell transplant, during the 12-month period prior to the MM diagnosis date, patients with hematologic cancer other than MM or solid tumors any time during the study period, and those with data quality issues, such as missing age, gender, or diagnosis information that would impact the quality of the analysis. All patients were followed from the initial MM diagnosis until the earliest of last health plan enrollment date or December 31, 2015.
Figure 1. Sample attrition, by reason.
SRE identification and creation of matched sample
SREs were identified by the presence of at least one diagnosis or procedure code indicative of PF, SCC, RAD, or SURG. A hierarchy was used to classify SRE codes that were recorded within a 21-day window. Specifically, if surgery or radiation to bone occurred within 21 days after a pathological fracture, those procedures were assumed to be treatment for the fracture, and the SRE was classified as pathological fracture. Similar logic was used to identify and classify surgical and radiation treatments that occurred within 21 days after a spinal cord compression. Finally, if a pathological fracture occurred within 21 days after a spinal cord compression, the SRE was coded as a spinal cord compression. Outside of this hierarchy, SRE codes that occurred at least 21 days apart were considered separate, distinct SREsCitation7.
To construct the final study population, patients with MM and SRE were propensity score matched 1:1 to patients with MM but without SRE using the nearest neighbor approach with a caliper width of 0.001. The match was based on pre-index demographics, clinical characteristics, and costs. For patients with SRE, the index date was defined as the first SRE date on or after their initial MM diagnosis. For patients without SRE, a pseudo-index date was created based on the distribution of days between the MM and SRE diagnoses in the SRE cohort. To be considered for the match, patients were required to have at least 1 month of continuous health plan enrollment after their index date (SRE) or pseudo-index date (no SRE).
Outcomes and statistical analyses
All-cause HRU and costs were estimated for inpatient, outpatient, emergency department (ED), and outpatient pharmacy services over the variable follow-up period; and summarized and reported per-patient-per-year (PPPY). Overall total direct medical costs were also estimated. Costs were based on health plan allowed amounts and included the patients’ copayments and the health plan-reimbursed amount, and were adjusted to 2016 US dollars using the Bureau of Labor Statistics medical care indexCitation22.
Descriptive analyses were conducted to describe the pre-index characteristics of the two matched cohorts. Wilcoxon signed rank for mean differences and McNemar’s tests for differences in proportions were used to compare baseline characteristics, HRU, and costs between the matched cohorts. The propensity score matching provided an opportunity to address imbalances between the two patient cohorts, and subsequent multivariate analyses were undertaken in an effort to reduce any residual confounding that remained after the match. Negative binomial regression and generalized linear regression models were used to estimate adjusted differences in HRU and costs between matched cohorts, as well as differences in HRU and costs between patients with a single SRE and those with multiple SREs. Incidence rate ratios (IRR) were also estimated for inpatient admissions, ED visits, outpatient physician visits, and outpatient prescription medications. The covariates used in the regression models were the same variables used in the propensity score match. Overall, comorbidity burden was estimated using the Deyo-Charlson Comorbidity IndexCitation23,Citation24, with the MM diagnosis removed from the algorithm.
Results
Of the 4,020 patients who met all initial study selection criteria, 894 (22%) patients had at least one SRE and at least 1 month of continuous health plan enrollment after the first (index) SRE. Among these patients, 406 (45%) had a single SRE and 488 (55%) had multiple SREs. Approximately 61% of the index SREs were pathological fractures, 22% involved radiation to the bone, 9% involved surgery to the bone, and 8% were spinal cord compressions.
The 1:1 propensity score match resulted in the inclusion of 848 patients in each of the two cohorts (). All comparative analyses used data for the patients in these matched cohorts. After matching, the only statistically significant differences in the baseline characteristics of the two cohorts were in the proportion of patients with osteoporosis and with peripheral vascular disease (). In both groups the median age was ∼61 years, ∼57% of patients were male, and the majority (59–60%) of patients were covered by commercial health plans. The mean (SD) follow-up time was 21.2 (14.5) months for SRE patients and 22.0 (15.3) months for non-SRE patients (p = .280). The comorbidity burden measured by the Deyo-Charlson Comorbidity Index, rates of specific comorbid conditions, and use of bisphosphonates, opioids, and anti-myeloma therapies were generally similar in the two cohorts ().
Table 1. Baseline clinical characteristics in SRE vs non-SRE patients after propensity score matching.
Patients with SRE had significantly higher PPPY HRU and direct medical costs compared with patients who had no evidence of SRE [ (HRU); (costs)]. Specifically, a significantly higher proportion of patients with SRE had inpatient admissions (72.4% vs 41.2%, p < .0001). On average, patients in the SRE cohort also had more inpatient admissions and higher mean PPPY inpatient costs ($65,196 vs $28,421, p < .0001). Compared with patients who had no evidence of SRE, a significantly higher proportion of SRE patients had ED visits (55.5% vs 42.9%, p < .0001), as well as a greater number of ED visits per patient and higher mean PPPY ED costs ($1,096 vs $619, p = .003). A greater proportion of patients with SRE had outpatient pharmacy claims (95.8% vs 92.6%, p < .0001) and the mean pharmacy costs PPPY were also higher in this cohort compared with the cohort of patients who had no SRE ($39,461 vs $24,685, p < .0001). In contrast, the use of and costs associated with outpatient physician visits were similar between the two patient cohorts. The total direct medical costs PPPY were significantly higher in the SRE cohort compared with the no SRE cohort ($188,723 vs $108,160, p < .0001).
Figure 2. Healthcare costs in skeletal-related events (SRE) vs non-SRE patients (USD, PPPY (per-patient-per-year)). * Wilcoxon tests were used to compare groups.
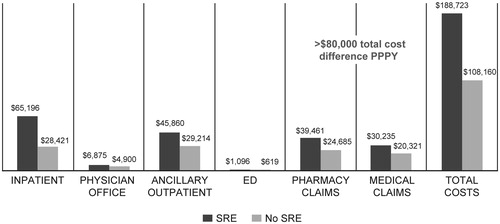
Table 2. Healthcare resource use in propensity score matched SRE vs non-SRE patients.Table Footnote*
On a PPPY basis, patients with multiple SREs had a significantly greater number of inpatient admissions (IRR = 1.27, p = .009), ED visits (IRR = 1.25, p = .035), outpatient physician visits (IRR = 1.37, p < .0001), and outpatient prescription medications compared with patients who had experienced only a single SRE. In adjusted analysis, multiple SRE were associated with 31% higher healthcare costs (p < .0001). Mean (standard error) adjusted total costs were $209,820 ($3,236) in patients with multiple SREs and $159,797 ($2,465) in patients with a single SRE, a difference of $50,023 PPPY.
Discussion
In this study of US patients with MM, those with SREs incurred an average $80,000 in additional total costs annually, with greater inpatient costs among SRE patients making the largest contribution to this differential in total costs. Resource use was highest among patients with multiple SREs. Compared with patients who experienced a single SRE, patients with multiple SREs incurred, on average, ∼ $50,000 in additional incremental total healthcare costs annually, as patients with multiple SREs had greater use of inpatient care, ED and physician visits, and outpatient prescriptions.
The cost of SRE has been previously reported for patients with advanced solid tumors, but, to date, few studies have reported on the cost of SRE in patients with MM. While the literature does include some important insights regarding the economic impact of SRE, to some degree the utility of published cost estimates is circumscribed to the extent that those estimates are based on data that no longer reflect current practice patterns for MM, with 2010 data being the most recent reportedCitation11,Citation19,Citation25. In addition, previous studies have also generally lacked a comparator group against which to estimate incremental cost differences, focused on a country-specific research questionCitation11, or examined the experience of small patient populations with limited generalizabilityCitation25. Groot et al.Citation25, for example, determined the costs of SRE using medical records for only 20 patients with MM in the Netherlands. In that study, the base-year for costs was 1998, and costs were indexed to 2002 EuroCitation25. The study lacked a comparator group; however, the authors were able to put the SRE costs into context by concluding that SRE costs comprise 17% of all MM-related costs.
More recently, Nash Smyth et al.Citation19 examined SRE-related HRU and costs in US patients diagnosed with MM between 2005 and 2010. As in our study, that study quantified HRU and costs using administrative claims data for patients with and without SRE. Rather than using propensity matching, however, that study used inverse probability propensity score weighting to adjust for potential bias between the patients with and without SRE. With that approach, Nash Smyth et al.Citation19 demonstrated higher HRU for inpatient, ED, and ancillary services, as well as higher outpatient, inpatient, and ED costs among patients with SRE compared to patients with no evidence of SRE. Utilization and mean total healthcare costs also increased with increasing numbers of SRE.
In our study, results from the matched patient cohorts demonstrate that inpatient hospitalizations are the greatest contributor to the increased unadjusted costs among patients with SRE, and these additional inpatient stays add $36,775 PPPY, on average. This finding is consistent with results from a multinational observational study that found inpatient stays to be the primary SRE cost driver in a cohort of European patients with bone metastases secondary to either solid tumors or MMCitation26. In that study, radiation to the bone was the least likely to require an inpatient stay, as that procedure is generally performed in the outpatient setting, and, therefore, radiation was the lowest cost SRE. In all four of the countries in that study, the two highest cost SREs were spinal cord compression and surgery to the bone. With the exception of radiation to the bone and vertebral fractures, inpatient care consumed ∼90% of SRE costs. One small-scale study in the Netherlands has also suggested that inpatient costs are the primary driver of SRE costs in patients with MMCitation25.
In the US, the cost of inpatient SRE-related care in patients with MM is also considerable. For example, one US study examined inpatient SRE costs for 1,361 MM patients who contributed 1,495 hospitalizations for analysisCitation11. In that population, the mean inpatient costs (per admission) to payers were $23,347 for pathologic fractures (n = 1,021), $31,016 for surgery to bone (n = 353), and $43,691 for spinal cord compression (n = 121).
Clinical guidelines for the management of MM recommend prophylactic therapy to reduce the incidence of skeletal-related events which, in turn, would be expected to reduce SRE-related morbidity and healthcare resource use and costsCitation16–18. The clinical efficacy of bisphosphonates has been well-documented in registrational trialsCitation27,Citation28. Despite this evidence, data from the routine care setting in the US indicate that prophylactic use of anti-resportive agents in patients with MM may be suboptimal with between 20–30% of patients with MM failing to receive recommended treatment, and no improvement in treatment rates over timeCitation19,Citation29,Citation30. Patients with MM who do not receive anti-resorptive therapy may remain at greater risk of SRE, increased morbidity, quality-of-life impairments, and increased direct medical costs which impact both patients and payers. Bisphosphonates use in our study population was at the low end of this previously reported range, and this finding may be in part due to the generally short time interval between MM diagnosis and index date for study patients (median = 0.8 months for SRE cohort and 1.9 months for non-SRE cohort).
The majority of the study population did not receive anti-myeloma therapies either. This finding may be, in part, due to inclusion of newly-diagnosed patients (excluding those with anti-myeloma therapy in the previous 12-months before MM diagnosis), requiring only that patients carry MM diagnosis, rather than requiring evidence of active treatment; and the short time interval between MM diagnosis and index date in the study patients.
Limitations
This study relied on PharMetrics Plus, which is a commercial claims database, and this data source does not include data for patients who are not enrolled in commercial healthcare plans. Patients aged 65 years or older, who are eligible for Medicare, are under-represented in this database, and patients who are uninsured, enrolled in Medicaid, or in closed health plans such as Kaiser Permanente or plans administered by the US Veteran’s Administration/Department of Defense are not represented. Administrative claims are used primarily for billing and reimbursement purposes, and not for research. As such, certain clinical conditions may potentially be under- or over-coded as a result of coding conventions designed around reimbursement considerations, and misclassification bias may be present. The identification of SREs relied upon clinical coding on any medical claim, which may have led to misclassification of patients with services performed simply to diagnose or rule-out SRE as having had an event. Misclassification may have also occurred with regard to distinguishing unique SREs. The 21-day window we used was based on clinical trial experience, and may not be completely accurate when used to differentiate between SREs in real world data. In addition, the site of the SRE cannot be determined from administrative claims data, which likely impacted our ability to confidently determine that claims which appeared to be subsequent SREs were truly new and unique events. Finally, in order to more accurately quantify the incremental HRU and costs associated with SRE, patients with and without SRE were propensity-score-matched to control for potential bias related to the distribution of confounding variables in these two cohorts. Despite these efforts, some residual confounding may remain, since unobservable differences may still exist between these patient groups, contributing to observed HRU and cost variations. For example, the severity and stage of multiple myeloma are likely to be important determinants of HRU; yet, unfortunately, neither of these disease characteristics can be assessed with administrative claims data. Bone lesions are a core feature of the end organ damage that is characteristic of MM and known as the CRAB criteria (increased calcium level, renal dysfunction, anemia, and destructive bone lesions), and SREs are an important sequelae of bone lesionsCitation2. In the future, researchers may consider exploring the relationship between SRE and disease progression and the potential implications for HRU and costs in patients with multiple myeloma.
Conclusions
In this retrospective analysis of administrative claims data for US patients with MM, the mean annual costs of patients with SRE were substantially higher than those for patients without SRE. Inpatient costs among SRE patients made the largest contribution to this differential in direct medical costs. The economic burden of SRE increased further with multiple events. Patient management strategies, including prophylaxis to reduce the risk of skeletal related events, may help reduce overall morbidity, HRU, and costs in patients with MM. Our study provides new insights into the incremental direct cost burden associated with SREs in patients with MM. Furthermore, examining the economic impact of interventions to prevent SREs, and indirect (lost productivity) and direct non-medical (caregiver/family burden) costs associated with SRE in MM are areas rich for future analyses.
Transparency
Declaration of funding
This study was sponsored by Amgen Inc.
Declaration of financial/other relationships
DB is an employee and stockholder of Amgen, Inc. MI is an employee of Amgen GmbH. DMH and RLW are employees of QuintilesIMS (now IQVIA), which received funding from Amgen, Inc. to conduct this research study. JME peer reviewers on this manuscript have no relevant financial or other relationships to disclose.
Acknowledgments
The authors would like to thank Magdaliz Gorritz for conducting the statistical analyses for this study and Sally Wade (Wade Outcomes Research and Consulting) for writing support.
References
- Multiple Myeloma Research Foundation. What is multiple myeloma? Philadelphia, PA. 1997. www.themmrf.org/multiple-myeloma/what-is-multiple-myeloma/
- Rajkumar SV, Dimopoulos MA, Palumbo A, et al. International Myeloma Working Group updated criteria for the diagnosis of multiple myeloma. Lancet Oncol 2014;15:e538-48
- National Cancer Institute Surveillance Epidemiology and End Results Program. Cancer Stat Facts: Myeloma. Bethesda, MD. 2016. https://seer.cancer.gov/statfacts/html/mulmy.html
- Roodman GD. Mechanisms of bone lesions in multiple myeloma and lymphoma. Cancer 1997;80(8 Suppl):1557-63
- Coleman RE. Metastatic bone disease: clinical features, pathophysiology and treatment strategies. Cancer Treat Rev 2001;27:165-76
- Kyle RA, Gertz MA, Witzig TE, et al. Review of 1027 patients with newly diagnosed multiple myeloma. Mayo Clin Proc 2003;78:21-33
- Rifkin RM, Abonour R, Terebelo H, et al. Connect MM Registry: the importance of establishing baseline disease characteristics. Clin Lymphoma Myeloma Leuk 2015;15:368-76
- Talamo G, Farooq U, Zangari M, et al. Beyond the CRAB symptoms: a study of presenting clinical manifestations of multiple myeloma. Clin Lymphoma Myeloma Leuk 2010;10:464-8
- Terpos E, Politou M, Rahemtulla A. The role of markers of bone remodeling in multiple myeloma. Blood Rev 2005;19:125-42
- Yong K, Delforge M, Driessen C, et al. Multiple myeloma: patient outcomes in real-world practice. Br J Haematol 2016;175:252-64
- Barlev A, Song X, Ivanov B, et al. Payer costs for inpatient treatment of pathologic fracture, surgery to bone, and spinal cord compression among patients with multiple myeloma or bone metastasis secondary to prostate or breast cancer. J Manag Care Pharm 2010;16:693-702
- Kanis JA, McCloskey EV. Bisphosphonates in multiple myeloma. Cancer 2000;88(12 Suppl):3022-32
- Sonmez M, Akagun T, Topbas M, et al. Effect of pathologic fractures on survival in multiple myeloma patients: a case control study. J Exp Clin Cancer Res 2008;27:11
- Terpos E, Berenson J, Cook RJ, et al. Prognostic variables for survival and skeletal complications in patients with multiple myeloma osteolytic bone disease. Leukemia 2010;24:1043-9
- Wisloff F, Gulbrandsen N, Hjorth M, et al. Quality of life may be affected more by disease parameters and response to therapy than by haemoglobin changes. Eur J Haematol 2005;75:293-8
- National Comprehensive Cancer Network (NCCN). NCCN clinical practice guidelines in oncology: multiple myeloma, Version 3. NCCN; 2016. Fort Washington, PA. 2016. https://www.nccn.org/professionals/physician_gls/pdf/myeloma.pdf
- Moreau P, San Miguel J, Sonneveld P, et al. Multiple myeloma: ESMO clinical practice guidelines for diagnosis, treatment and follow-updagger. Ann Oncol 2017;28:iv52-iv61
- Terpos E, Kleber M, Engelhardt M, et al. European Myeloma Network guidelines for the management of multiple myeloma-related complications. Haematologica 2015;100:1254-66
- Nash Smyth E, Conti I, Wooldridge JE, et al. Frequency of skeletal-related events and associated healthcare resource use and costs in US patients with multiple myeloma. J Med Econ 2016;19:477-86
- Delea T, McKiernan J, Brandman J, et al. Retrospective study of the effect of skeletal complications on total medical care costs in patients with bone metastases of breast cancer seen in typical clinical practice. J Support Oncol 2006;4:341-7
- Lage MJ, Barber BL, Harrison DJ, et al. The cost of treating skeletal-related events in patients with prostate cancer. Am J Manag Care 2008;14:317-22
- Statistics. UBoL. Consumer Price Index. Washington, DC. 2017. https://www.bls.gov/cpi/
- Ghali WA, Hall RE, Rosen AK, et al. Searching for an improved clinical comorbidity index for use with ICD-9-CM administrative data. J Clin Epidemiol 1996;49:273-8
- Deyo RA, Cherkin DC, Ciol MA. Adapting a clinical comorbidity index for use with ICD-9-CM administrative databases. J Clin Epidemiol 1992;45:613-19
- Groot MT, Huijgens PC, Wijermans PJ, et al. Costs of multiple myeloma and associated skeletal-related events in The Netherlands. Expert Rev Pharmacoecon Outcomes Res 2004;4:565-72
- Hechmati G, Cure S, Gouepo A, et al. Cost of skeletal-related events in European patients with solid tumours and bone metastases: data from a prospective multinational observational study. J Med Econ 2013;16:691-700
- Zometa, Highlights of Prescribing Information. https://www.accessdata.fda.gov/drugsatfda_docs/label/2016/021223s034lbl.pdf
- Pamidronate, Highlights of Prescribing Information. https://www.accessdata.fda.gov/drugsatfda_docs/label/2014/021113s017lbl.pdf
- Kim CHRK, Cheng PC, Smith J, eds. Bone targeting agent treatment patterns among patients with multiple myeloma treated at oncology clinics across the United States: observations from real-world data. San Diego, CA: American Society of Hematology; 2016
- Mahmood AGH, Fink MG, Patel M, et al. Health-resource utilization attributable to skeletal-related events in patients with advanced cancers associated with bone metastases: results of the US cohort from a multicenter observational study. Community Oncol 2012;9:148-57