
Abstract
Aims: To assess and compare the direct healthcare and non-healthcare costs and government subsidies by body weight and diabetes status.
Methods: The Australian Diabetes, Obesity and Lifestyle study collected health service utilization and health-related expenditure data at the 2011–2012 follow-up surveys. Costing data were available for 4,409 participants. Unit costs for 2016–2017 were used where available or were otherwise inflated to 2016–2017 dollars. Age- and sex-adjusted costs per person were estimated using generalized linear models.
Results: The annual total direct cost ranged from $1,998 per person with normal weight to $2,501 per person with obesity in participants without diabetes. For those with diabetes, total direct costs were $2,353 per person with normal weight, $3,263 per person with overweight, and $3,131 per person with obesity. Additional expenditure as government subsidies ranged from $5,649 per person with normal weight and no diabetes to $8,085 per person with overweight and diabetes. In general, direct costs and government subsidies were higher for overweight and obesity compared to normal weight, regardless of diabetes status, but were more noticeable in the diabetes sub-group. The annual total excess cost compared with normal weight people without diabetes was 26% for obesity alone and 46% for those with obesity and diabetes.
Limitations: Participants included in this study represented a healthier cohort than the Australian population. The relatively small sample of people with both obesity and diabetes prevented a more detailed analysis by obesity class.
Conclusion: Overweight and obesity are associated with increased costs, which are further increased in individuals who also have diabetes. Interventions to prevent overweight and obesity or reduce weight in people who are overweight or obese, and prevent diabetes, should reduce the financial burden.
Introduction
Excess body weight is associated with the risk of diabetesCitation1–3. In Australia, the latest National Health Survey estimated that 11.2 million adults were overweight or obese and 1.2 million adults had diabetes in 2014–2015Citation4; a rise from 9.0 million and 0.9 million adults, respectively, in 2011–2012Citation5. The financial burden of these chronic conditions has been reported previouslyCitation6–11. By using data from the Australian Diabetes, Obesity and Lifestyle (AusDiab) study, a national population based study, we additionally showed a dose–response relationship between body weight categories and both total direct cost and government subsidiesCitation9. Similar dose–response relationships were observed between costs and glucose tolerance status, and between costs and complications in people with diabetesCitation10. A self-reported study in the US reported a similar relationship between direct cost and body weight categories, but, when participants were further divided by diabetes sub-groups, direct costs were significantly different only in the obese class III group compared to the normal weight group for those with pre-diabetes or diabetes, but not with normoglycemiaCitation12. In addition to a difference in total healthcare cost in the obese class III vs normal weight sub-groups for those with pre-diabetes, another US study, which used electronic medical records and insurance claims data, reported the incremental total costs relative to normal weight were significant for overweight and all obesity classes in both normoglycemia and type 2 diabetes subjectsCitation13.
Obesity and diabetes are strongly linked, and both are costly to society. However, little is known of the economic interaction and contribution to costs of the two conditions. A better understanding of this relationship would help inform strategies to prevent weight gain and diabetes and weight loss interventions in people with obesity and those with diabetes.
Costs associated with both obesity and diabetes combined have not been reported in Australia. We, therefore, aimed to assess and compare the annual direct healthcare and non-healthcare costs and government subsidies by body weight and diabetes status using the latest health service utilization and health-related expenditure data collected at the AusDiab 2011–2012 follow-up study.
Methods
Study participants
The AusDiab study is the largest population-based study on diabetes in Australia. Details of the AusDiab study have been published elsewhereCitation14. In brief, 11,247 adults aged ≥25 years participated in the baseline study in 1999–2000. The baseline study included physical examination and questionnaires. Follow-up studies of the baseline cohort were conducted in 2004–2005 and in 2011–2012. In addition to similar physical examination and questionnaires conducted at baseline, information on health service utilization and health-related expenditure were collected at follow-up. Participants were included for analysis if data on diabetes status, weight status, and cost estimation were available in 2011–2012. Participants with fasting plasma glucose ≥7.0 mmol/L, 2-h post-load plasma glucose ≥11.1 mmol/L, and/or self-reported as having diabetes and on glucose-lowering medications were considered to have diabetes. The World Health Organization body mass index (BMI) cut-points were used to define normal weight (BMI = 18.5–24.9 kg/m2), overweight (BMI = 25.0–29.9 kg/m2) and obesity (BMI ≥ 30.0 kg/m2)Citation15. Due to the small sample size (n = 20), participants who were underweight (BMI ≤18.5 kg/m2) were excluded from analysis.
AusDiab was approved by the human research ethics committees of Monash University and the Alfred Hospital, Melbourne. Written informed consent was obtained from all participants.
Costing data
Costing data were available for the estimation of direct healthcare and non-healthcare costs and government subsidies. Items included for cost calculation are summarized in . Where possible, we included items in the 2011–2012 cost calculation that were similar to those used in publications on the 2004–2005 costing dataCitation9,Citation10,Citation16. Unit costs were obtained from the Medicare Benefits Schedule (www.mbsonline.gov.au) and supplemented by the Australian Medical Association fee list (ama.com.au) for medical services and diagnostics; from the Pharmaceutical Benefits Scheme (www.pbs.gov.au) and supplemented by the Monthly Index of Medical Specialities Annual (www.mims.com.au) and online pharmacies (www.chemistwarehouse.com.au; www.pharmacydirect.com.au) for medications; from the Independent Hospital Pricing AuthorityCitation17 and Australian Bureau of StatisticsCitation18 for hospitalization; from the Australian Taxation Office cents per kilometre method, ambulance service, taxi service, and public bus fares for estimation of transport to hospital costs; from My Aged Care (www.myagedcare.gov.au) and randomly selected aged care home providers from each state and territory for estimation of aged care home costs; and from Centrelink (www.humanservices.gov.au/customer/dhs/centrelink) for pensions and allowances. Unit costs for 2016–2017 were used where available or were otherwise inflated to 2016–2017 dollars using the Campbell and Cochrane Economics Methods Group and the Evidence for Policy and Practice Information and Coordinating Centre cost converterCitation19.
Table 1. Summary of the AusDiab 2011–2012 study items included for cost calculation.
Questions on health service utilization and health-related expenditure enquired about costs over the previous 12 months. Participants self-reported medication use, but were asked to bring a list of medications from their general practitioner or the medications to the examination. Each medication was converted to the cost for 12 months considering tablet strength and daily dosage. When the strength of a medication was not specified, the cost of the lowest available strength was used. Likewise, the lowest dose was applied when the number of tablets per day was absent. The cost of a single packet of medication was used for antibiotics and medications used on an as required basis.
Statistical analysis
Generalized linear models with log link and family were used to estimate the age- and sex-adjusted annual costs per person for direct healthcare cost, direct non-healthcare cost, and government subsidies by weight status and with or without diabetesCitation20. Modified Park tests were used to identify the family for analysis of each of the three cost categories. A two-part model was used in the analysis of direct non-healthcare cost and government subsidies to account for the substantial number of participants who incurred zero cost for these two cost categories. Non-parametric bootstrapping with 500 replications were used to compute confidence intervals of the cost estimates. Age- and sex-adjusted estimated costs were compared between weight status separately for those with and without diabetes using unpaired t-tests. All statistical analyses were performed using Stata/SE 14.2 for Windows (Stata Corp LP, College Station, TX).
Results
Characteristics of participants
Costing data, BMI, and diabetes status in 2011–2012 were available from 4,418 participants. Nine participants with exceptionally high annual direct healthcare costs (>$50,000 per person) contributed mainly by frequent day clinic visits (mean = 37 visits vs 2 visits for those with at least one visit) and extended overnight stay in public hospitals (mean = 32 nights vs 4 nights for those with at least one overnight stay) were excluded, leaving 4,409 participants with mean (SD) age = 60.8 (11.3) years in the analysis. Of these participants, 55.2% were female, 9.9% had diabetes, 41.4% were overweight, and 27.7% were obese. For participants without diabetes, 33.0% had normal weight, 42.2% were overweight, and 24.8% were obese. The proportions for participants with diabetes were 11.9%, 34.6%, and 53.5%, respectively. Within each weight status group, participants with diabetes were older than their diabetes-free counterparts (mean age = 69.4 vs 59.9 years for normal weight, 69.0 vs 60.7 years for overweight, and 64.8 vs 59.5 years for obese; ).
Table 2. Age- and sex-adjusted annual per person cost (in 2016 Australian dollars) (95% CIs) by weight and diabetes status.
Direct healthcare and non-healthcare costs
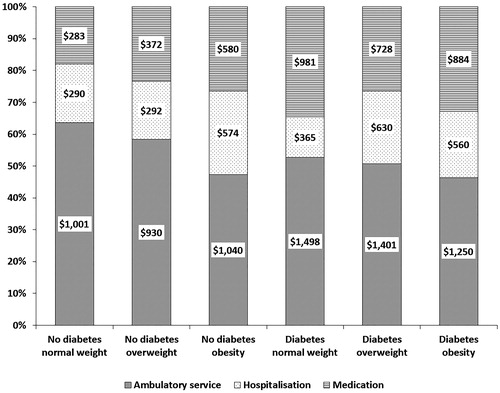
The age- and sex-adjusted annual direct healthcare costs in participants without diabetes were $1,359 (95% CI = 1,210–1,509) per person at normal weight, $1,328 (1,195–1,462) per overweight person, and $1,676 (1,413–1,939) per obese person (). For participants with diabetes, direct healthcare cost was $1,786 (929–2,642) per person at normal weight, $2,093 (1,495–2,691) per overweight person, and $1,925 (1,373–2,477) per obese person. In general, direct healthcare costs were higher in the overweight and obesity groups compared to the normal weight group, regardless of diabetes status (p < 0.001). The main contribution towards direct healthcare cost was ambulatory service, although it was proportionally smaller at higher body weight status (). Hospitalization and medication contributed equally (18% each) in those with normal weight and no diabetes and those with obesity and no diabetes (26% hospitalization and 27% medication); medication was, otherwise, a greater contributor to direct healthcare cost.
Figure 1. Contribution of direct healthcare cost components by weight and diabetes status. Annual per person costs were age- and sex-adjusted.
A similar trend was observed for annual age- and sex-adjusted per person direct non-healthcare costs (). In the no diabetes group, direct non-healthcare costs were $634 (381–954) per person at normal weight and $674 (396–1,024) per overweight person, and higher, at $957 (515–1,473) per obese person. For participants with diabetes, direct non-healthcare costs ranged from $520 (54–1,904) per person at normal weight, to $1,459 (576–2,550) per overweight person and $1,609 (587–2,890) per obese person. As for direct healthcare costs, direct non-healthcare costs were higher in the overweight and obesity groups compared to the normal weight group, regardless of diabetes status (p < 0.001).
When direct healthcare and non-healthcare costs combined (i.e. total direct cost) was considered, no difference in the age- and sex-adjusted per person cost was observed between normal weight and overweight in the no diabetes group (; p = 0.47).
Government subsidies
The annual age- and sex-adjusted per person expenditure on government subsidies are shown in . These ranged from $5,649 in the group with normal weight to $7,148 in the obese group for participants without diabetes. For participants with diabetes, costs per person were similar for overweight and obesity ($8,085 vs $8,058), but higher than those with normal weight ($6,117). Government subsidies were higher in people who were overweight and obese in comparison to people with normal weight, regardless of diabetes status (p < .001). The biggest contributor to government subsidies was the age pension, which formed ∼75–80% of government subsidies, regardless of weight and diabetes status. As the age limit for the age pension is ≥65 years, when age pension was excluded from the calculation for government subsidies, the costs per person were $1,404 (1,096–1,702) for normal weight, $1,158 (906–1,417) for overweight, and $1,821 (1,353–2,241) for obesity in the no diabetes group and $1,223 (354–3,091) for normal weight, $1,519 (706–2,453) for overweight and $1,966 (1,203–2,918) for obese in the diabetes group.
Discussion
Our study is the first to report on the cost of diabetes and obesity combined in Australia. Our results confirmed higher direct costs in people with diabetes compared to no diabetes at each BMI category. Direct costs and government subsidies were also higher for overweight and obesity compared to normal weight, regardless of diabetes status, but were more prominent in the diabetes sub-group. Of note, we estimated the costs jointly for participants with known diabetes and newly-diagnosed diabetes due to the relatively small sample sizes in the diabetes sub-groups. The costs are likely to be much higher in those with known diabetes, since our costing analysis by glucose tolerance status indicated the total direct cost and government subsidies were 62% and 24%, respectively, higher in those with known diabetes compared to those with newly-diagnosed diabetesCitation10.
An interesting but not surprising observation was the proportionally greater contribution of medication towards direct healthcare cost at higher BMI categories and with diabetes. As suggested by Li et al.Citation13, this is partly the result of treating obesity-related comorbidities such as diabetes, high blood pressure, and dyslipidemia, which are reliant on prescription medications.
A previous study reported that, for a given percentage reduction in BMI, reductions in medical expenditure were greater in those with obesity who have higher starting BMI than those with BMI close to the obesity cut-pointCitation21. Moreover, reduction in medical expenditure was greater in people with diabetes compared to their non-diabetic counterpart with the same starting BMI and reduction in BMI. The relatively small sample size precluded analyzing the relationship between direct costs and change in weight and diabetes status over time.
A strength of our study was the use of a “bottom-up” analytic approach to derive cost estimates. Information collected during interview and physical examination also allowed more accurate classification of body weight and diabetes status. Nevertheless, we were unable to provide the cost of obesity and diabetes combined to Australia as participants included in this study represented a healthier cohort. The distribution of normal weight, overweight, and obesity in the Australian Health Survey 2011–2012 aged ≥35 years were 29.0%, 38.5%, and 31.9%, respectively, in comparison to 30.9%, 41.4%, and 27.7% in our cohortCitation5. Furthermore, compared to participants with costing data at both follow-up studies, those with costing data in 2004–2005 only were older (mean age = 54.5 years vs 59.5 years), more likely to have diabetes (6.7% vs 12.7%) and to have died by the end of 2012 (0.4% vs 14.6%), and had higher direct healthcare cost (median = $536 vs $821). Therefore, the costs derived from this relatively healthier cohort are likely under-estimates. Moreover, we were unable to report costs separately for type 1 and type 2 diabetes as only 0.3% of participants included in the analysis had type 1 diabetes. Nevertheless, the costs remained relatively unchanged when participants with type 1 diabetes were excluded from analysis. The relatively small sample of people with both obesity and diabetes prevented a more detailed analysis by obese class I, II, and III, as presented in the US studiesCitation12,Citation13. We were also unable to report costs separately for known diabetes and newly-diagnosed diabetes as the number of people with either normal weight and known diabetes or normal weight and newly-diagnosed diabetes were too small to provide meaningful estimates. Information on indirect costs such as carers cost and loss of income were also not collected.
Conclusions
Obesity and diabetes are costly health conditions, and costs are greater when the two occur together. Compared with normal weight and no diabetes, the annual total excess cost was 26% for obesity alone and 46% with the addition of diabetes. Individual and government interventions to reduce the risk of developing diabetes by preventing weight gain or achieving weight loss in people who were overweight and obese should reduce the individual and societal financial burden of diabetes and obesity.
Transparency
Declaration of funding
Boden Institute has received funding from Novo Nordisk A/S to conduct this costing study. The AusDiab study, co-coordinated by the Baker Heart and Diabetes Institute, gratefully acknowledges the generous support given by: National Health and Medical Research Council (NHMRC grant 233200), Australian Government Department of Health and Ageing, Abbott Australasia Pty Ltd, Alphapharm Pty Ltd, AstraZeneca, Bristol-Myers Squibb, City Health Centre–Diabetes Service–Canberra, Department of Health and Community Services–Northern Territory, Department of Health and Human Services–Tasmania, Department of Health–New South Wales, Department of Health–Western Australia, Department of Health–South Australia, Department of Human Services–Victoria, Diabetes Australia, Diabetes Australia Northern Territory, Eli Lilly Australia, Estate of the Late Edward Wilson, GlaxoSmithKline, Jack Brockhoff Foundation, Janssen-Cilag, Kidney Health Australia, Marian & FH Flack Trust, Menzies Research Institute, Merck Sharp & Dohme, Novartis Pharmaceuticals, Novo Nordisk Pharmaceuticals, Pfizer Pty Ltd, Pratt Foundation, Queensland Health, Roche Diagnostics Australia, Royal Prince Alfred Hospital, Sydney, Sanofi Aventis, Sanofi Synthelabo, and the Victorian Government’s OIS Program. The sponsors had no influence on the preparation of this paper.
Declaration of financial/other interests
SC has served on advisory boards and/or received speaking fees from the following companies over the past 3 years: Astra Zenica, Merck Sharp & Dohme, Novo Nordisk, Sanofi and Servier. BG and EN are employed by Novo Nordisk A/S. JES reports grants from Commonwealth Department of Health and Aged Care, Abbott Australasia Pty Ltd, Alphapharm Pty Ltd, AstraZeneca, Aventis Pharmaceutical, Bristol-Myers Squibb Pharmaceuticals, Eli Lilly (Aust) Pty Ltd, GlaxoSmithKline, Janssen-Cilag (Aust) Pty Ltd, Merck Lipha s.a., Merck Sharp & Dohme (Aust), Novartis Pharmaceutical (Aust) Pty Ltd, Novo Nordisk Pharmaceutical Pty Ltd, Pharmacia and Upjohn Pty Ltd, Pfizer Pty Ltd, Sanofi Synthelabo, Servier Laboratories (Aust) Pty Ltd, the Australian Kidney Foundation, and Diabetes Australia during the conduct of the study. JME peer reviewers on this manuscript have no relevant financial or other relationships to disclose.
Previous presentations
Presentations of this costing study were made at the 2017 Australian Diabetes Society & Australian Diabetes Educators Association Annual Scientific Meeting and the Australian & New Zealand Obesity Society, Obesity Surgery Society of Australia & New Zealand, and Asia Oceania Association for the Study of Obesity 2017 Joint Scientific Meeting.
Acknowledgments
We are enormously grateful to the AusDiab team for their invaluable contribution to the set-up and field activities of AusDiab. No assistance in the preparation of this article is to be declared.
References
- Lundgren H, Bengtsson C, Blohme G, et al. Adiposity and adipose tissue distribution in relation to incidence of diabetes in women: results from a prospective population study in Gothenburg, Sweden. Int J Obes 1989;13:413-23
- Cassano PA, Rosner B, Vokonas PS, et al. Obesity and body fat distribution in relation to the incidence of non-insulin-dependent diabetes mellitus. A prospective cohort study of men in the normative aging study. Am J Epidemiol 1992;136:1474-86
- Ferrara CT, Geyer SM, Liu YF, et al. Excess BMI in childhood: a modifiable risk factor for type 1 diabetes development? Diabetes Care 2017;40:698-701
- Australian Bureau of Statistics. National health survey: first results, 2014–15. ABS Cat. 4364.0.55.001. Canberra. Available at: http://www.abs.gov.au/AUSSTATS/[email protected]/DetailsPage/4364.0.55.0012014-15?Open-Document [Last accessed June 9, 2017]
- Australian Bureau of Statistics. Australian health survey: first results, 2011–12. ABS Cat. 4364.0.55.001. Canberra. Available at: http://www.abs.gov.au/AUSSTATS/[email protected]/DetailsPage/4364.0.55.0012011-12?OpenDocument [Last accessed June 9, 2017]
- Colagiuri S, Colagiuri R, Conway B, et al. DiabCo$t Australia: assessing the burden of type 2 diabetes in Australia. Canberra: Diabetes Australia; 2003
- Access Economics. The economic costs of obesity. Canberra: Diabetes Australia; 2006
- Access Economics. The growing cost of obesity in 2008: three years on. Canberra: Diabetes Australia; 2008
- Colagiuri S, Lee CM, Colagiuri R, et al. The cost of overweight and obesity in Australia. Med J Aust 2010;192:260-4
- Lee CM, Colagiuri R, Magliano DJ, et al. The cost of diabetes in adults in Australia. Diabetes Res Clin Pract 2013;99:385-90
- PricewaterhouseCoopers. Weighing the cost of obesity: a case for action. Available at: http://www.obesityaustralia.org/publications-and-documents [Last accessed June 9, 2017]
- DiBonaventura M, Lay AL, Kumar M, et al. The association between body mass index and health and economic outcomes in the United States. J Occup Environ Med 2015;57:1047-54
- Li Q, Blume SW, Huang JC, et al. The economic burden of obesity by glycemic stage in the United States. Pharmacoeconomics 2015;33:735-48
- Tanamas SK, Magliano DJ, Lynch B, et al. AusDiab 2012. The Australian Diabetes, Obesity and Lifestyle Study. Melbourne: Baker IDI Heart and Diabetes Institute; 2013
- World Health Organization. Obesity: preventing and managing the global epidemic. Report of a WHO Consultation. Geneva: World Health Organization; 2000
- Wyld ML, Lee CM, Zhuo X, et al. Cost to government and society of chronic kidney disease stage 1-5: a national cohort study. Intern Med J 2015;45:741-7
- Independent Hospital Pricing Authority. National hospital cost data collection. Australian public hospitals cost report 2013–2014 round 18. Sydney. Available at: https://www.ihpa.gov.au/publications/australian-public-hospitals-cost-report-2013-2014-round-18 [Last accessed June 1, 2017]
- Australian Bureau of Statistics. Private hospitals Australia 2014–15. ABS Cat. 4390.0. Sydney. Canberra. Available at: http://www.abs.gov.au/ausstats/[email protected]/mf/4390.0 [Last accessed June 1, 2017]
- Shemilt I, Thomas J, Morciano M. A web-based tool for adjusting costs to a specific target currency and price year. Evid Policy 2010;6:51-9
- Glick HA, Doshi JA, Sonnad SS, et al. Chapter 5: Analyzing cost. In Economic evaluation in clinical trial. 2nd ed. Oxford: Oxford University Press; 2015
- Cawley J, Meyerhoefer C, Biener A, et al. Savings in medical expenditures associated with reductions in body mass index among US adults with obesity, by diabetes status. PharmacoEconomics 2015;33:707-22