
Abstract
Background: Comparative analyses of published cost effectiveness models provide useful insights into critical issues to inform the development of new cost effectiveness models in the same disease area.
Objective: The purpose of this study was to describe a comparative analysis of cost-effectiveness models and highlight the importance of such work in informing development of new models. This research uses genotypic antiretroviral resistance testing after first line treatment failure for Human Immunodeficiency Virus (HIV) as an example.
Method: A literature search was performed, and published cost effectiveness models were selected according to predetermined eligibility criteria. A comprehensive comparative analysis was undertaken for all aspects of the models.
Results: Five published models were compared, and several critical issues were identified for consideration when developing a new model. These include the comparator, time horizon and scope of the model. In addition, the composite effect of drug resistance prevalence, antiretroviral therapy efficacy, test performance and the proportion of patients switching to second-line ART potentially have a measurable effect on model results. When considering CD4 count and viral load, dichotomizing patients according to higher cost and lower quality of life (AIDS) versus lower cost and higher quality of life (non-AIDS) status will potentially capture differences between resistance testing and other strategies, which could be confirmed by cross-validation/convergent validation. A quality adjusted life year is an essential outcome which should be explicitly explored in probabilistic sensitivity analysis, where possible.
Conclusions: Using an example of GART for HIV, this study demonstrates comparative analysis of previously published cost effectiveness models yields critical information which can be used to inform the structure and specifications of new models.
JEL CLASSIFICATION CODE:
Introduction
Comparisons of cost effectiveness models are frequently undertaken and publishedCitation1–7 to assess quality, biasCitation8 and transferability of resultsCitation9,Citation10. When developing a new cost-effectiveness model, it is important to investigate and compare previous models to gain insight into analytical approaches, model assumptions and natural history of disease, which remain relevant over timeCitation11,Citation12. Such comparisons are less frequently published. Those which have been published use methods such as exchanging modelsCitation1,Citation13, “experimental” modelsCitation2 and sensitivity analyses to compare data and assumptionsCitation14. However, due to resource constraints and the proprietary nature of models, it is often necessary to perform comparisons based on publications alone, which is time consuming and challenging, in part due to inconsistency in outcome selection, discrepancies in terminology, and reportingCitation4–6,Citation11,Citation13.
This research expands on the limited published literature in this area by undertaking a comprehensive comparison of published models on a specific topic (genotypic antiretroviral resistance testing), to gain insight into critical issues which can be used to inform development of new cost-effectiveness models.
Methods
A systematic search identified models evaluating GART after first line (1 L) antiretroviral (ART) failure. Selection was restricted to manuscripts reporting results of full economic evaluations which measured both cost and consequencesCitation15 (full search criteria in Supplementary Appendix). A comprehensive, qualitative comparative analysis was undertaken to describe all aspects of the models using publicly-available primary publications and Supplementary Material. No direct contact was made with the authors regarding the published models. Uncertainty in interpretation of the models was resolved by economic and clinical study team members. Accepted principles of good practice in modeling were applied as a frame of reference for the comparative analysisCitation16–19 (full methodology described in the Supplementary Appendix).
Published model results were compared to understand how the factors modeled related to the overall results. Reported results were compounded to present day values according to the method by WelteCitation9. Reported costs were converted to original currency according to historic exchange rates. Values were adjusted for inflation according to country-specific GDP deflators for source year and latest year availableCitation20. Values were converted to USD according to price level ratio of Purchasing Price Parity (PPP) conversion factor (GDP) to market exchangeCitation20. Health benefits were assumed constant with no discounting of health outcomes (full methodology described in the Supplementary Appendix).
Results
Five published cost-effectiveness models met eligibility criteria for the comparative analysis (hereafter named according to first author)Citation21–25. The main results of the comparative analysis are presented below with the full comparative analysis provided as Supplementary Material.
Model comparator, time horizon and scope
Key differences were identified in comparator, time horizon and scope used across models. Weinstein, Corzillius, Sendi and Levison compared GART to no GART, whereas Phillips used “no monitoring and no second line (2 L) treatment”. For time horizon, Weinstein, Corzillius, Sendi and Levison use a lifetime model and Phillips reports a time horizon of ten years (2015–2025).
With respect to scope, some models were more comprehensive than others. Sendi and Levison modeled patients from time of 1 L initiation to 2 L treatment failure only, whereas Weinstein modeled treatment-naïve patients up to and including 2 L failure, including disease progression and death. Corzillius modeled patients at diagnosis through four treatment regimens and failures to death. By comparison, Phillip’s original HIV synthesis model begins with HIV incidence, progressing from treatment-naïve to 2 L failure, disease progression and death, accounting for adherence and transmissionCitation26–30. The paper included in this comparison (Phillips 2014) focuses on 1 L failure and follows patients for ten years, including disease progression and death.
Model assumptions of prevalence of drug resistance, ART “efficacy”, GART “efficacy” and whether to switch therapy to 2 L for GART positives
Both Weinstein and Levison used a base case prevalence of 20% for wild type virus and primary DR respectively. Corzillius, Sendi and Phillips did not explicitly report primary or secondary prevalence of DR.
Model assumptions for ART “efficacy” differed widely between studies. Weinstein assumed 40% of patients failed IL at 24 weeks and 30% at 48 weeks, with all patients assumed to fail 1 L at 24 months, based on a matrix derived from clinical study data. The 18% probability of 1 L failure in Corzillius was based on prior published dataCitation31 and Sendi varied their probability according to levels of HIV drug resistance (DR) defined by HauptsCitation32. Levison modeled an “initialization cohort” of which 25% fail 1 L, and at the start of the ten-year period Phillips assumed that 13% of patients have failed 1 L.
For GART “efficacy”, Weinstein considered the proportion of patients on suppressive ART as 34% after GART, versus 22% without GART. Corzillius reported a relative risk of 0.79 for the protective effect of GART, and the probability of virologic failure was reduced by 21%. Sendi assumed a relative risk of 1.27 for treatment failure without GART versus with use of GART. Assumptions about the effect of GART on virologic suppression were not explicitly stated in Levison and Phillips.
There was a wide range of assumptions about whether patients stay on 1 L or switch to 2 L after GART/no GART. Sendi assumed 67% of patients would change to 2 L after GART while 33% continued on 1 L, and for patients without GART, 97% would change to 2 L while 3% stayed on 1 LCitation32. Levison assumed a proportion of patients without DR would achieve viral load suppression (VLS) by continuing 1 L, and the proportion with DR switching to 2 L after GART was not reported. Phillips’s probability of switching to 2 L was assumed as 0.3 every 3 months, irrespective of the GART strategy used. The proportion of patients changing regimens after GART/no GART in the Weinstein and Corzillius models was not explicitly stated.
Modeling disease status (CD4, VL) and disease progression (AIDS, OI)
A wide range of approaches for modeling disease status and disease progression were used across studies. Weinstein used CD4 count and VL as surrogate markers for disease progression. Both CD4 count (cells/μL) and VL (copies/mL) were divided into six strata and associated with states of VLS and virologic failure. In those with VLS, CD4 increased by 0.083 (GART) or 0.060 cells/μL (no GART) per month and VL decreased to <500 copies/mL. In virologic failure, VL increased one stratum/month to viral set-point (not specified) and CD4 decreased at a monthly rate governed by VL. Weinstein then modeled disease progression based on CD4 count and risk of developing opportunistic infections (OI).
Corzillius had a starting CD4 count of 360 cells/μL, which increased by a mean of 150 cells/μL after every 6-month cycle. In virologic failure, CD4 count decreased 1 year after failure (two 6-month cycles). Corzillius used VL only as a surrogate for disease progression based on prior dataCitation33. Baseline VL was 10,000–30,000 copies/mLCitation34.
Sendi used a combined assessment of CD4 count, VL, and presence (or absence) of AIDS-defining conditions to determine disease progression. After year three, Sendi stratified AIDS-free patients according to CD4 strata 0–200, 201–500 and >500 cells/μL and VL <1,000, ≥1,000 copies/mL.
Levison set a mean starting CD4 count of 173 cells/μL. The paper describes a "CD4 count increase at 24 weeks (all strategies/cohorts)" of 148 cells/μL, which presumably impacted clinical risk, although it was unclear precisely how this was applied in the model. In 1 L failure, a mean monthly CD4 decrease was applied according to VL strata (0–500; 501–3,000; 3,001–10,000; 10,001–30,000; >30,000 copies/mL). VL decreased in VLS and the rate of virologic failure was not specified. Levison appeared to determine risk of developing an OI based on CD4 count.
Phillips included changes in CD4 and VL as a function of adherence, number of active drugs, time on the current regimen and VL (Phillips supplementary 1)Citation26. The original publication supplement describes VL as a mean change from VL maximum at <3 months, 3-6 months and >6 months (Phillips supplementary 1)Citation26. It also describes a patient-specific factor built into the model, which captured the variable tendency for CD4 count to rise on ART for any given level of VLS. The model considered (i) the rate of increase of CD4 count reduces over time in treated patients, (ii) this rate of increase is slower in patients who have been on ART >2 years, (iii) CD4 count decreases faster if patients are not on a PI based regimen, (iv) there is person-specific variability in the rate of CD4 count change, and (v) that CD4 count and VL changes will be different when ART is interrupted (Philips 2007 supplement)Citation26. How changes in VL were modeled was not fully evident from the primary paper and related publicationsCitation28–30,Citation35. Disease progression depended on CD4 count, age and OI prophylaxis. In Phillips, the risk of clinical disease (and death) reported in the 2007 Supplementary Methods link CD4 strata to WHO disease stage 3 and 4 (categories of AIDS-related OIs), which consequently inform risk of AIDS. OIs are not mentioned in the 2014 paper.
Modeling quality of life
Two of the five models include quality of life (QoL) as an outcome. Weinstein used utility derived from a previous studyCitation35, based on the single global health status question, “How would you rate your current state of health?” rated as excellent, very good, good, fair and poor, and data were transformed to utility weights according to TorranceCitation36. Sendi used utility derived from a previous study by Zinkernagel, who collected QoL data from the HIV Medical Outcome StudyCitation35–37 among 41 asymptomatic patients with a CD4 count >400Citation37. Data were transformed to utilities using methods described by MrusCitation38. The values used in Weinstein and Sendi are shown in .
Table 1. Weinstein and Sendi’s utility values according to CD4 count +/− AIDS status and VL.
Standardized base case results
This comparison provides insight into the impact of specifications on model results (full methodology described in the Supplementary Appendix). Weinstein, Corzillius, Sendi and Levison showed GART after 1 L failure was cost effective (CE) from the US, German, European and South African perspective, respectively. Phillips reported GART is not CE from a Zimbabwean perspective.
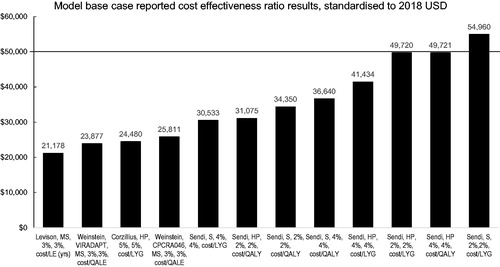
Of all the model results reported, the only instance where GART exceeded a willingness to pay (WTP) threshold of ≥$50,000 was Sendi’s societal perspective, which discounted at 2% for cost and outcomes and gave an incremental cost effectiveness ratio (ICER) of $54,960 USD 2018 per Life Year Gained (LYG) ($54,960), which was 9.92% over the WTP threshold. All other studies reported GART in routine practice after 1 L failure as a potentially cost-effective intervention, ranging from $21,178 to $49,721 (2018 USD). Although Phillips concluded GART was not CE, their results were reported as cost per Disability Adjusted Life Years (DALYs) averted preventing direct comparisons to the other models (cost/QALY).
The global comparison results are illustrated in .
Figure 1. Standardized incremental cost effectiveness ratios (2018 USD). Author, study (if relevant), perspective, cost discount rate, outcome discount rate, output measure. HP, healthcare payer (public); MS, modified societal; S, societal. Phillips results not directly comparable because results are reported as total (2015–2025) incremental cost of $191.1m per 139,589 Disability Adjusted Life Years (DALYs) averted over ten years compared to a no monitoring strategy (discounted at 3.5%) (Phillips 2014 referencing Figure 2)Citation25.
Sensitivity analysis
Comparing the sensitivity analysis of the models provides insight into the influence of model specifications on the direction and magnitude of potential uncertainty on model results. Weinstein described many one-way sensitivity analysis (SA) and used a sample size of 1 million to minimize sampling error. It was not clear if multivariate SA was performed, and Probabilistic Sensitivity Analysis (PSA) was not reported. Corzillius performed one-way SA for plausible ranges of all model parameters, multivariate scenario analysis and PSA. Sendi reported no univariate or multivariate SA, however, PSA was reported. Levison performed univariate and multivariate SA. Phillips conducted several one-way SA and undertook enough runs to minimize stochastic effects. No PSA was reported, although this may not have been possible for the individual patient simulation model.
Corzillius varied all model parameters simultaneously in PSA yielding a median ICER of 22,200 €/life year (LY) (95% CI: 16,900–34,600 €/LY). In 98.96% of simulated cases, ICER was below 50,000 €/LY. Sendi showed that, from a healthcare perspective, at a WTP threshold of ≥$35,000 GART had a higher probability of being CE than no GART.
Levison’s delay in switching to ART after GART overturned the CE of GART. From baseline 3 months delay, GART remained CE up to <5 months and greater than this threshold no GART was the preferred strategy.
GART remained CE under variation of GART test cost (Weinstein, Corzillius, Levison, Phillips); GART “efficacy” (Weinstein, Corzillius); ART “efficacy” (Levison); health related QoL (Weinstein); ART 2 L efficacy (Weinstein, Levison, Phillips); ratio of costs to charges (Weinstein), discount rate (Weinstein, Levison); prevalence of wild type virus (Levison), cost of 2 L care (Levison), time horizon (Phillips); CD4 count at 1 L (Levison, Phillips); monthly probability of late ART failure (Levison) and ART adherence (Phillips).
In summary, Weinstein, Corzillius, Sendi and Levison agreed that addition of GART to HIV care at 1 L failure is CE, and standardized results confirm it is highly likely this currently holds true. Both models with PSAs (Sendi and Corzillius) showed high probability of CE. Note that a key driver of the Corzillius model results was the costs of care in AIDS versus non-AIDS patients. For Levison the only factor overturning the results was a delay in receiving GART results before switching treatment. In contrast, Phillips concludes that GART is not cost-effective.
Discussion
This comparative analysis identified the following critical considerations which can be applied to improve the structure, specifications and validity of future cost effectiveness models.
The first critical consideration is the choice of comparator. Four of the models compared GART to a no GART scenario where 2 L treatment was available (Weinstein, Corzillius, Sendi, Levison), which appropriately represents current standard of careCitation39. This specification resulted in no potential for benefit from differential switching of patients to 2 L under a GART versus a no GART strategy, and results in the comparator strategy (no GART) being comparatively low-cost in all scenarios.
A second critical consideration is the time horizon used for the model. Four of the models used a lifetime horizon (Weinstein, Corzillius, Sendi, Levison). Phillips reported the results of a ten-year time horizon only, distributing the economic impact over a shorter duration.
A third critical consideration is the model scope. Phillips used the broadest scope which included adherence and HIV transmission and considers the widest range of costs/outcomes. Corzillius also used a relatively broad scope by including third- and fourth-line treatment failure (although CE results were still favorable for GART, in contrast to Phillips). Weinstein, Sendi and Levison used a comparatively narrower scope. In future models, the scope should sufficiently capture the differences between costs and outcomes of patients from time of 1 L failure to the time when all potential outcomes are realized after GART (death).
It is worth noting that Phillip's combination of these three considerations (absence of 2 L comparator, comparatively short time horizon and relatively broad model scope) likely contributed to their unfavorable CE results for a GART strategy.
The fourth critical consideration is the modeling of CD4 count, VL and disease progression. A wide range of starting values and approaches to modeling changes have been used across the models. The critical issue appears to be capturing differences in high cost/low QoL disease states versus low cost/higher QoL disease states, as these are likely to drive the CE results. Indeed, the SA by Corzillius confirmed a key driver in their model results was the difference in costs between patients with AIDS versus without AIDS. In future modeling, it is likely that a simple approach dichotomizing patients according to higher cost/lower QoL (AIDS) versus lower cost/higher QoL (non-AIDS) status will adequately capture potential costs and health outcomes.
The fifth critical consideration is the health outcome measure used for the model. Two models (Weinstein, Sendi) included QoL, and some variation was observed between the values used in the two models. Weinstein’s utility of “sicker” patients resulted in notably higher values than Sendi’s (). Weinstein reported varying QoL weights in the SA, with no notable impact on model results. It was presumed that utility was included in Sendi’s PSA, although this was not explicitly stated. The lack of influence on model results may be due to small changes in utility between categories of CD4 count strata (0.94–0.81 = 0.13 for Weinstein; 0.801–0.739 = 0.062 for Sendi). Future models will benefit from more recent data on utility of HIV patients with and without AIDS, using preference-based measures and explicitly exploring in a variety of SA, including PSA.
The final critical consideration is the compound effect of four sequential assumptions which can be likened to model “filters” (which direct patients in a cohort model through the different pathways), namely prevalence of DR (primary and secondary), ART efficacy, GART efficacy and which patients are switched to 2 L. Each “filter” potentially impacts the cost effectiveness results.
The first filter is prevalence of DR, including primary (transmitted, pre-treatment) resistance or secondary (acquired) DR. Note that prevalence of wild type HIV (which implies no DR) varies between countries and changes over timeCitation39. Only two of the models considered primary prevalence and this is likely to impact on model results. Corzillius acknowledged that the CE of GART inherently depends on the prevalence of DR.
The second filter is ART efficacy, defined as the proportion of patients who achieve VLS on 1 L. The models use varying assumptions including 13% (Phillips), 18% (Corzillius), 25% (Levison) and 30–40% (Weinstein). This is likely to drive results because the potential to benefit from GART is applied to patients with 1 L VLF.
The third filter is the test performance characteristics (diagnostic test accuracy) of GART which was not explicitly described in any of the models. Implicit in this is that GART is a ‘perfect’ and binary test. Although such an assumption is reasonable for the sake of simplicity, it arguably overlooks factors such as invalid test results, low levels and archived resistance, proper clinical management of resistance results, and the ability of some HIV drug resistance to be overcome with high adherenceCitation40.
The fourth filter is the clinical decision of when to switch patients to 2 L in the GART and no GART strategies, which is the probability of switching to 2 L after GART/no GART. Importantly, the models appear to be based on a wide range of assumptions relating to this, as clinical outcomes of switching patients after GART have not been well described in the published literature. Levison assumed that a proportion of patients without DR in the GART arm remain on 1 L and achieve VLS (although CE results remain favorable). Phillips appears to apply a constant probability of switching to 2 L (0.3/3 months) irrespective of whether GART has been used. This means that, of the 30% of patients switching to 2 L, some were assumed to have DR and some were non-adherent or had wild type virus. The VL outcomes for these two subgroups are likely to be different as the presence of drug resistance has been strongly associated with future rates of re-suppressionCitation41. By comparison, Sendi assumed 67% of GARTs were switched to 2 L and 97% of no GARTs switched to 2 L, therefore potential cost savings may arise from GART patients without DR who stay on 1 L. There is likely to be a better evidence base for these values in future modeling when the results of the REVAMP study become available, as they compare the efficacy of GART to VL monitoring and intensified adherence counseling alone in people failing 1 L in Uganda and South AfricaCitation42.
Based on the four filters above, it seems that GART has the potential to be CE if it impacts favorably on clinical outcome (VLS), QoL and/or cost of care of 1 L VLF patients over their lifetime. GART can achieve this if it directs patients with higher cost/lower quality of life (1 L VLF) to lower cost/better quality of life (VLS) states. However, it is less likely to prove CE if it either does not impact regimen choice or assumes that VLS will be achieved (post GART), in patients with DR by staying on 1 L therapy. For example, if the results of GART do not influence switch to 2 L (as in the Phillips study) or delay change of regimen (as in the SA in the Levison study), then it will have little chance of improving value of HIV care. To increase accuracy of future modeling, primary data on the impact of GART on treatment decisions, the impact of using both 1 L and 2 L among people with and without DR, and the impact of HIV disease status on progression and quality of life should be incorporated.
Conclusions
Using an example of GART testing in HIV, this research demonstrates that undertaking comparative analysis of published cost-effectiveness models can provide insight into critical issues which should be considered when developing a new cost-effectiveness model for a specific intervention.
Transparency
Declaration of funding
This study is funded by the National Institute of Allergy and Infectious Diseases with support from the President’s Emergency Plan for AIDS Relief (NIH R01 AI124718). MJS receives additional support from the National Institutes of Mental Health (K23 MH099916). VCM and RTG receive additional support from NIH/NIAID.
Declaration of financial/other interests
The authors have no relevant financial or other relationships to disclose.
JME peer reviewers on this manuscript have no relevant financial or other relationships to disclose.
Author contributions
Conception and design: all; analysis and interpretation of the data: TR, GG, MJS; drafting of the article: TR; critical revision of the article for important intellectual content: all; obtaining of funding: MJS.
Previous presentations
None.
Comparative_Analysis_Supplementary_Material_Resubmitted_2_clean_06.12.2019.docx
Download MS Word (1.8 MB)Acknowledgements
Thank you to Debra Kiss for review of the manuscript. Thank you to Ute Zerwes who performed the literature searches, Maggie Feng and Rebecca Fain Gilbert who sourced the literature and Michael Strauss who provided expertise in standardizing the results.
References
- Postma MJ, Jit M, Rozenbaum MH, et al. Comparative review of three cost-effectiveness models for rotavirus vaccines in national immunization programs; a generic approach applied to various regions in the world. BMC Med. 2011;9(1):84.
- Turner D, Raftery J, Cooper K, et al. The CHD challenge: comparing four cost-effectiveness models. Value Health. 2011;14(1):53–60.
- Critchlow S, Hirst M, Akehurst R, et al. A systematic review of cost-effectiveness modeling of pharmaceutical therapies in neuropathic pain: variation in practice, key challenges, and recommendations for the future. J Med Econ. 2017;20(2):129–139.
- van Mastrigt GAPG, Hiligsmann M, Arts JJC, et al. How to prepare a systematic review of economic evaluations for informing evidence-based healthcare decisions: a five-step approach (part 1/3). Expert Rev Pharmacoecon Outcomes Res. 2016;16(6):689–704.
- Wijnen BFM, Van Mastrigt G, Redekop WK, et al. How to prepare a systematic review of economic evaluations for informing evidence-based healthcare decisions: data extraction, risk of bias, and transferability (part 3/3). Expert Rev Pharmacoecon Outcomes Res. 2016;16(6):723–732.
- Thielen FW, Van Mastrigt G, Burgers LT, et al. How to prepare a systematic review of economic evaluations for clinical practice guidelines: database selection and search strategy development (part 2/3). Expert Rev Pharmacoecon Outcomes Res. 2016;16(6):705–721.
- Green C. Modelling disease progression in Alzheimer's disease: a review of modelling methods used for cost-effectiveness analysis. PharmacoEconomics. 2007;25(9):735–750.
- Evers SM, Hiligsmann M, Adarkwah CC. Risk of bias in trial-based economic evaluations: identification of sources and bias-reducing strategies. Psychol Health. 2015;30(1):52–71.
- Welte R, Feenstra T, Jager H, et al. A decision chart for assessing and improving the transferability of economic evaluation results between countries. Pharmacoeconomics. 2004;22(13):857–876.
- Daniel Mullins C, Onwudiwe NC, Branco de Araújo GT, et al. Guidance document: global pharmacoeconomic model adaption strategies. Value Health Reg Issues. 2014;5:7–13.
- Anderson R, Schemilt I. Chapter 3: The role of economic perspectives and evidence in systematic review. In: Shemilt I, Mugford M, Vale L, et al., editors. Evidence-based decision and economics: health care, social welfare, education and criminal justice. Oxford: Wiley-Blackwell; 2010. p. 23–39.
- Squires H, Chilcott J, Akehurst R, et al. A framework for developing the structure of public health economic models. Value Health. 2016;19(5):588–601.
- Pignone M. Challenges in systematic reviews of economic analyses. Ann Intern Med. 2005;142(12_Part_2):1073–1079.
- Drummond MF, Barbieri M, Wong JB. Analytic choices in economic models of treatments for rheumatoid arthritis: What makes a difference? Med Decis Making. 2005;25(5):520–533.
- Drummond MF. Methods for the economic evaluation of health care programmes. 3rd ed. 2011. Oxford: Oxford medical publications.
- Caro JJ, Briggs AH, Siebert U, et al. Modeling good research practices overview: a report of the ISPOR-SMDM Modeling Good Research Practices Task Force 1. Value Health. 2012;15(6):796–803.
- Caro JJ, Briggs AH, Siebert U, et al. Modeling good research practices overview: a report of the ISPOR-SMDM Modeling Good Research Practices Task Force 1. Med Decis Making. 2012;32(5):667–677.
- Roberts M, Russell LB, Paltiel AD, et al. Conceptualizing a model: a report of the ISPOR-SMDM Modeling Good Research Practices Task Force 2. Value Health. 2012;15(6):804–811.
- Roberts M, Russell LB, Paltiel AD, et al. Conceptualizing a model: a report of the ISPOR-SMDM Modeling Good Research Practices Task Force 2. Med Decis Making. 2012;32(5):678–689.
- Bank W. World Bank Database. 2017. [cited 2018 Aug 30]; Available from: https://data.worldbank.org/.
- Weinstein MC, Goldie SJ, Losina E, et al. Use of genotypic resistance testing to guide hiv therapy: clinical impact and cost-effectiveness. Ann Intern Med. 2001;134(6):440–450.
- Corzillius M, Mühlberger N, Sroczynski G, et al. Cost effectiveness analysis of routine use of genotypic antiretroviral resistance testing after failure of antiretroviral treatment for HIV. Antivir. Ther. 2004;9(1):27–36.
- Sendi P, for the Swiss HIV Cohort Study, Günthard HF, Simcock M, et al. Cost-effectiveness of genotypic antiretroviral resistance testing in HIV-infected patients with treatment failure. PLoS One. 2007;2(1):e173.
- Levison JH, Wood R, Scott CA, et al. The clinical and economic impact of genotype testing at first-line antiretroviral therapy failure for HIV-infected patients in South Africa. Clin Infect Dis. 2013;56(4):587–597.
- Phillips A, Cambiano V, Nakagawa F, et al. Cost-effectiveness of HIV drug resistance testing to inform switching to second line antiretroviral therapy in low income settings. PLoS One. 2014;9(10):e109148.
- Phillips AN, Sabin C, Pillay D, et al. HIV in the UK 1980-2006: reconstruction using a model of HIV infection and the effect of antiretroviral therapy. HIV Med. 2007;8(8):536–546.
- Phillips AN, Pillay D, Miners AH, et al. Outcomes from monitoring of patients on antiretroviral therapy in resource-limited settings with viral load, CD4 cell count, or clinical observation alone: a computer simulation model. Lancet. 2008;371(9622):1443–1451.
- Phillips AN, Pillay D, Garnett G, et al. Effect on transmission of HIV-1 resistance of timing of implementation of viral load monitoring to determine switches from first to second-line antiretroviral regimens in resource-limited settings. Aids. 2011;25(6):843–850.
- Cambiano V, Bertagnolio S, Jordan MR, et al. Transmission of drug resistant HIV and its potential impact on mortality and treatment outcomes in resource-limited settings. J Infect Dis. 2013;207(suppl_2):S57–S62.
- Cambiano V, Bertagnolio S, Jordan MR, et al. Predicted levels of HIV drug resistance: potential impact of expanding diagnosis, retention, and eligibility criteria for antiretroviral therapy initiation. Aids. 2014;28 (Suppl 1):S15–S23.
- Ledergerber B, Egger M, Opravil M, et al. Clinical progression and virological failure on highly active antiretroviral therapy in HIV-1 patients: a prospective cohort study. Swiss HIV Cohort Study. Lancet. 1999;353(9156):863–868.
- Haupts S, Swiss HIV Cohort Study, Ledergerber B, Böni J, et al. Impact of genotypic resistance testing on selection of salvage regimen in clinical practice. Antivir. Ther. 2003;8(5):443–454.
- Mellors JW. Plasma viral load and CD4+ lymphocytes as prognostic markers of HIV-1 infection. Ann Intern Med. 1997;126(12):946–954.
- Corzillius M, Mühlberger N, Sroczynski G, et al. Health Technology Assessment: Wertigkeit des Einsatzes der genotypischen und phänotypischen HIV-Resistenzbestimmung im Rahmen der Behandlung von HIV-infizierten Patienten [Health Technology Assessment: evaluating the medical benefits, costs, and cost-effectiveness of using genotypic and phenotypic antiretroviral resistance testing for the treatment of HIV-infected patients]. 2003.
- Freedberg KA. The cost-effectiveness of preventing AIDS-related opportunistic infections. JAMA. 1998;279(2):130–136.
- Torrance G. Social preferences for health states: an empirical evaluation of three measurement techniques. Socio-Eco Plan Sci. 1976;10(3):129–136.
- Zinkernagel C, Ledergerber B, Battegay M, et al. Quality of life in asymptomatic patients with early HIV infection initiating antiretroviral therapy. Swiss HIV Cohort Study. Aids. 1999;13(12):1587–1589.
- Mrus JM, Yi MS, Freedberg KA, et al. Utilities derived from visual analog scale scores in patients with HIV/AIDS. Med Decis Making. 2003;23(5):414–421.
- WHO. World Health Organisation HIV Drug Resistance Report 2019. 2019.
- Murphy RA, Sunpath H, Lu Z, et al. South Africa Resistance Cohort Study Team. Outcomes after virologic failure of first-line ART in South Africa. AIDS. 2010;24(7):1007–1012.
- Hill AM, Venter F. The unexpected success of NRTIs in second-line treatment. Lancet Infect Dis. 2018;18(1):3–5.
- Siedner MJ, Bwana MB, Moosa MS, et al. The REVAMP trial to evaluate HIV resistance testing in sub-Saharan Africa: a case study in clinical trial design in resource limited settings to optimize effectiveness and cost effectiveness estimates. HIV Clin Trials. 2017;18(4):149–155.