
Abstract
Aim
To characterize vaso-occlusive crises (VOCs) and describe healthcare costs among commercially-insured, Medicaid-insured, and Medicare-insured patients with sickle cell disease (SCD).
Materials and methods
The IBM Truven Health MarketScan Commercial (2000–2018), Medicaid Analytic eXtract (2008–2014), and Medicare Research Identifiable Files (2012–2016) databases were used to identify patients with ≥2 SCD diagnoses. Study measures were evaluated during a 12-month follow-up period, stratified by annual number of VOCs (i.e. 0, 1, and ≥2).
Results
Among 16,092 commercially-insured patients (mean age = 36.7 years), 35.3% had 1+ VOCs. Mean annual total all-cause healthcare costs were $15,747, $27,194, and $64,555 for patients with 0, 1, and 2+ VOCs, respectively. Total all-cause healthcare costs were mainly driven by inpatient (0 VOC = 31.0%, 1 VOC = 53.1%, 2+ VOCs = 65.4%) and SCD-related costs (0 VOC = 56.4%, 1 VOC = 78.4%, 2+ VOCs = 93.9%). Among 18,287 Medicaid-insured patients (mean age = 28.5 years, fee-for-service = 50.2%), 63.9% had 1+ VOCs. Mean annual total all-cause healthcare costs were $16,750, $29,880, and $64,566 for patients with 0, 1, and 2+ VOCs, respectively. Inpatient costs (0 VOC = 37.2%, 1 VOC = 64.3%, 2+ VOCs = 72.9%) and SCD-related costs (0 VOC = 60.9%, 1 VOC = 73.8%, 2+ VOCs = 92.2%) accounted for a significant proportion of total all-cause healthcare costs. Among 15,431 Medicare-insured patients (mean age = 48.2 years), 55.1% had 1+ VOCs. Mean annual total all-cause healthcare costs were $21,877, $29,250, and $58,308 for patients with 0, 1, and ≥2 VOCs, respectively. Total all-cause healthcare costs were mainly driven by inpatient (0 VOC = 47.9%, 1 VOC = 54.9%, 2+ VOCs = 67.5%) and SCD-related costs (0 VOC = 74.9%, 1 VOC = 84.4%, 2+ VOCs = 95.3%).
Limitations
VOCs managed at home were not captured. Analyses were descriptive in an observational setting; thus, no causal relationships can be inferred.
Conclusions
A high proportion of patients experienced VOCs across payers. Furthermore, inpatient and SCD-related costs accounted for a significant proportion of total all-cause healthcare costs, which increased with VOC frequency.
Introduction
Sickle cell disease (SCD) is an umbrella term that refers to a group of autosomal recessive disorders caused by mutations in the β globin geneCitation1. These β globin variants underlie the characteristic hemolytic anemia and vaso-occlusion observed in patients with SCD, which can lead to widespread organ dysfunctionCitation1. Although SCD prevalence data are scarce in the United States (US), a 2010 study estimated that as many as 100,000 individuals may be affected, most of whom are African-Americans and HispanicsCitation2.
SCD causes a wide range of acute and chronic complications that contribute to a lower life expectancy and poor quality-of-life of affected patientsCitation3,Citation4. Episodes of excruciating pain known as vaso-occlusive crises (VOCs) are the most common complication of SCDCitation5–8 and constitute a risk factor for early death in patients with SCDCitation5,Citation7. Furthermore, VOCs impair work productivity and are the leading cause of hospitalization in patients with SCDCitation3,Citation9–11.
Historically, few therapeutic options were available to manage and prevent VOCs, and there is evidence that VOCs are not optimally treated in real-world clinical practiceCitation1,Citation12. Opioids and non-steroidal anti-inflammatory drugs (NSAIDs) are recommended to relieve pain in patients presenting a VOCCitation6, but the ongoing national opioid crisis may have reduced prescription rates due to a variety of misconceptions among physiciansCitation13,Citation14. Furthermore, hydroxyurea remains underused due to safety concerns and lack of physicians’ experience with this agent despite its proven efficacy to reduce the frequency of VOCs, hospitalizations, and mortalityCitation6,Citation14–17.
In recent years, research efforts culminated in the approval of new agents that may help overcome these limitations. Initially, L-glutamine was granted approval based on phase III data which showed a significant reduction in the frequency of VOCs versus placebo (median: 3.0 vs. 4.0 VOCs over 48 weeks)Citation18,Citation19. More recently, voxelotor was approved by the Food and Drug Administration (FDA) in 2019 based on the results of the HOPE study, which demonstrated that the drug led to a significant increase in hemoglobin levels relative to placebo and a numerical reduction in the incidence of VOCsCitation20. In the same year, crizanlizumab was approved by the FDA based on results of the phase II SUSTAIN study, which demonstrated that this agent led to a significant reduction of 45% in the rate of VOC relative to placeboCitation21,Citation22.
VOCs entail substantial costs to the US healthcare system. According to the Agency for Healthcare Research and Quality, $811.4 million were spent in aggregate costs for SCD-related inpatient (IP) stays in 2016Citation23. A recent study showed that Medicaid-insured patients with SCD who received hydroxyurea incurred mean total annual healthcare costs of $36,253 per patient per year, including $23,000 in IP costsCitation24. In light of the rapidly changing treatment landscape of SCD, particularly with respect to VOC management, it is important to assess how the healthcare costs of patients with SCD are impacted by VOCs across the main private and public payer types. The purpose of the present study was to characterize VOCs and SCD healthcare costs of commercially-insured, Medicaid-insured, and Medicare-insured patients with SCD to gain a deeper understanding of VOCs and their associated economic burden.
Methods
Data sources
The IBM Truven Health MarketScan Commercial (MarketScan) database was used to identify commercially-insured patients with SCD (1 January 2000–30 June 2018). At the time of conducting the study, the database consisted of medical and pharmacy claims of over 150 employers, including more than 100 health plans (payers), representing approximately 43 million covered lives in the most recent year with complete data from all census regions. The database was de-identified and complied with the confidentiality requirements of the Health Insurance Portability and Accountability Act (HIPAA). Therefore, no institutional review was required.
Data from the Research Identifiable File (RIF) Medicaid Analytic eXtract (MAX) database were used to identify Medicaid-insured patients with SCD (1 January 2008–31 December 2014). This database contains administrative claims data on Medicaid eligible persons (i.e. low-income adults and their children, pregnant women, elderly adults, and people with disabilities). States and years with available data are presented in Supplementary Appendix S1.
The RIF Medicare encounter final files with drug event linkage (i.e. Part D) database was used to identify Medicare-insured patients with SCD (1 January 2012–31 December 2016). This database contains information collected by Medicare to pay for healthcare services or drug events of Medicare beneficiaries. Data are available for each institutional (Part A), non-institutional (Part B), and drug event (Part D) claim type, with each record being a claim.
The RIF Medicaid and RIF Medicare databases include enrollees from all 50 states and the District of Columbia and contained de-identified data. A letter for IRB exemption was obtained from the National Minority Quality Forum, Institutional Review Board.
Sample selection
To be included in the study, patients were required to meet the following criteria: (1) ≥ 2 diagnoses for SCD (International Classification of Diseases, Ninth Revision, Clinical Modifications [ICD-9-CM]: 282.41, 282.42, 282.6x; ICD-10-CM: D57.0x, D57.1x, D57.2x, D57.4x, D57.8x) on distinct dates, (2) ≥ 24 months of continuous plan eligibility (both medical and pharmacy health plan coverage), (3) ≥ 16 years of age as of the index date, and (4) valid information available on the state of residence on the index date. Patients with dual eligibility (e.g. dual Medicare and Medicaid coverage; Medicare Supplement Insurance), indicator of clinical trial enrollment (i.e. ICD-9-CM: V70.7; ICD-10-CM: Z00.6), or stem cell transplant were excluded. This study focused on patients aged ≥ 16 years owing to the higher risk of SCD-related complications and VOCs in this age groupCitation25. These patients have unmet medical needs and may benefit the most from medical interventions/treatments, hence their inclusion in our study.
Study design
The index date was randomly selected among calendar dates with ≥ 12 months of continuous plan eligibility before and after that date; therefore, it was not anchored to a medical service. This random process allowed the capture of a representative sample of the population with SCD regardless of the stage of the disease and patients’ treatment history. Patients’ baseline characteristics were evaluated during the baseline period, which was defined as the 12-month period prior to the index date. Study outcomes were evaluated during the follow-up period, defined as the 12-month period following the index date.
Study outcomes
SCD-related complications were evaluated during the follow-up period. The full list of complications and their associated ICD codes are presented in Supplementary Appendix S2.
An algorithm was developed in collaboration with clinical experts to identify visits coded as VOC to define VOC episodes requiring a healthcare visit that occurred in various types of healthcare settings (any among IP, emergency room [ER], and outpatient [OP] setting). Because one VOC episode may be associated with more than one (follow-up) healthcare visit, VOCs were identified using an episode-based framework instead of single time point events. Specifically, VOC episodes were defined as any event meeting one of the following criteria, which were determined based on what is observed in clinical practice when providing such medical services: (1) medical service claims with ≥ 1 VOC-related diagnosis (whether it be recorded at a primary or secondary position) among sickle-cell/Hb-SS with crisis, sickle-cell thalassemia with crisis, sickle-cell/Hb-SC with crisis, other SCD with crisis, priapism, splenic sequestration, acute chest syndrome (ACS), or acute hepatic sequestration recorded within ≤ 3 days of each other, irrespective of setting; (2) any follow-up medical services with a VOC-related diagnosis recorded ≤ 7 days following an initial VOC-related diagnosis in an ER or OP setting; or (3) IP readmission recorded ≤ 14 days of a previous IP stay, both with at least one VOC-related diagnosis. Each episode started with the initial healthcare visit and ended with the last visit that occurred within the aforementioned time periods.
The characteristics of VOC episodes requiring a healthcare visit occurring during the follow-up period were described. VOCs were classified as complicated if priapism, splenic sequestration, acute hepatic sequestration, or ACS were present, a definition consistent with that used in the SUSTAIN studyCitation21. VOCs without those complications were classified as uncomplicated. The proportions of VOCs managed in each type of setting (i.e. IP, ER, or OP setting) and their respective durations in each setting were also described.
All-cause healthcare resource utilization (HRU) (number of IP stays, ER visits and days with OP services) and healthcare costs (from a payer’s perspective in 2018 USD) were also evaluated. HRU and healthcare costs were stratified by the number of VOCs (0, 1, and 2 or more [2+]) experienced by patients during the follow-up period. SCD-related costs were also evaluated and were defined as medical services with a diagnosis for SCD or an SCD-related complication, a procedure for SCD management (including blood transfusion), or a prescription fill for the treatment of an SCD-related complication. For the Medicaid-insured population, cost outcomes were evaluated in the subset of patients with a fee-for-service plan.
Statistical analyses
Descriptive analyses were used to evaluate the aforementioned outcomes. Means, standard deviations, and medians were used to describe continuous variables, and frequencies and proportions were used to describe categorical variables. No comparisons were made between populations.
Results
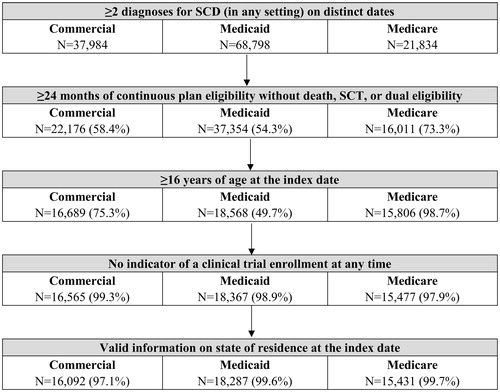
In total, 16,092 commercially-insured patients, 18,287 Medicaid-insured patients, and 15,431 Medicare-insured patients met all selection criteria and were included in the study (). The three states with the greatest number of patients with SCD were New York (10.6%), Texas (9.9%), and Florida (8.7%) among commercially-insured patients; New York (12.7%), Florida (7.3%), and California (7.1%) among Medicaid-insured patients; and Florida (9.1%), Texas (7.2%), and New York (6.8%) among Medicare-insured patients (Supplementary Appendix S3).
Figure 1. Patient selection flowchart. Abbreviations. SCD, sickle cell disease; SCT, stem cell transplant.
Baseline characteristics
Among commercially-insured patients, mean age was 36.7 years; 9.6% were aged 16–17, 89.5% were aged 18–64, and 0.9% were aged 65+ (). Most patients (61.4%) were female. In total, 6.3% of patients received blood transfusions, 9.7% used hydroxyurea, and 45.4% received prescription opioids. More than half (50.5%) of patients were adherent to hydroxyurea therapy based on a medication possession ratio (MPR) of ≥ 80%.
Table 1. Patient baseline characteristics.
On average, Medicaid-insured patients were aged 28.5 years; 18.7% were aged 16–17, 81.0% were aged 18–64, and 0.2% were aged 65+ (). Females represented 58.2% of the population, and 50.2% had a fee-for-service plan. In total, 29.5% of patients received blood transfusions, 24.9% used hydroxyurea, and 70.7% received prescription opioids; 45.1% of patients had an MPR ≥ 80% for hydroxyurea therapy.
Medicare-insured patients had a mean age of 48.2 years; none were aged 16–17, 77.4% were aged 18–64 and were mainly enrolled via disability status, and 22.6% were aged 65+ (). Most patients (59.6%) were females. In total, 34.3% of patients received blood transfusions, 22.6% used hydroxyurea, and 66.8% received prescription opioids; 48.9% of patients had an MPR ≥ 80% for hydroxyurea therapy.
Acute and chronic SCD-related complications
Among commercially-insured patients, 36.7% experienced acute complications during the 12-month follow-up period (). Infectious and parasitic diseases, venous thromboembolism (VTE), deep vein thrombosis (DVT), heart failure), and ACS were the top five most common acute complications. Chronic complications were observed in 36.8% of patients, with asthma, chronic pain, avascular necrosis, renal failure, and retinopathy being the most common ones ().
Figure 2. Occurrence of SCD-related complications during the 12-month follow-up period.
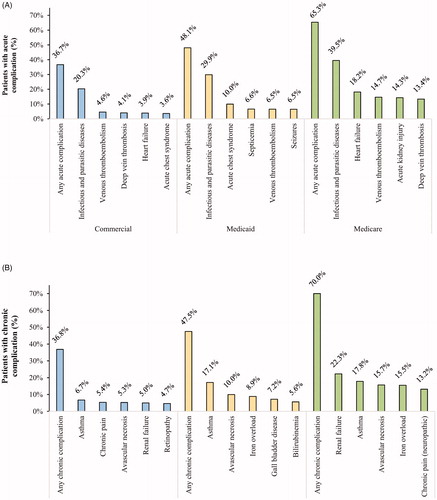
Among Medicaid-insured patients, 48.1% had acute complications (any; ). Infectious and parasitic diseases, ACS, septicemia, VTE, and seizures were the most frequent acute complications. In total, 47.5% experienced chronic complications (any), including asthma, avascular necrosis, iron overload, gall bladder disease, and bilirubinemia ().
Acute complications (any) occurred in 65.3% of Medicare-insured patients (). Infectious and parasitic diseases, heart failure, VTE, acute kidney injury, and DVT were the five most common acute complications. Chronic complications (any) were observed in 70.0% of patients (). The top five most common chronic complications were renal failure, asthma, avascular necrosis, iron overload, and chronic pain.
Characteristics of VOCs requiring a healthcare visit
Among commercially-insured patients, 35.3% had one or more (1+) VOCs during follow-up. Specifically, 14.0% had 1 VOC, and 21.2% had 2+ VOCs. On average, patients experienced 1.2 VOCs per year, and 7.3% of VOCs were classified as complicated. Among patients with 1+ VOCs, the mean annual number of VOCs was 3.3; this figure was 4.8 in patients with 2+ VOCs. VOCs most commonly occurred in the IP (37.4%) setting, followed by the OP (36.2%), and ER (26.4%) settings. The mean duration of each VOC episode was longest for those managed in the IP setting ().
Table 2. Frequency and characteristics of vaso-occlusive crises during the 12-month follow-up period.
Among Medicaid-insured patients, 63.9% experienced 1+ VOCs; 17.0% had 1 VOC, and 46.8% had 2+ VOCs. Overall, 3.1 VOCs per patient were observed, and 6.5% of VOCs were classified as complicated. The mean annual rate of VOC was 4.8 in the subset of patients with 1+ VOCs and 6.2 in the subset with 2+ VOCs. A majority of VOCs were managed in the IP (46.1%) or ER (35.0%) setting; 19.0% were in the OP setting. On average, VOC episodes managed in the IP setting were longest.
Among Medicare-insured patients, 55.1% had 1+ VOCs, including 11.4% with 1 VOC and 43.7% with 2+ VOCs. Overall, 3.4 VOCs per patient were observed, and 8.3% of these VOCs were classified as complicated. The mean annual rate of VOC was 6.2 in the subset of patients with 1+ VOCs and 7.5 in the subset with 2+ VOCs. VOCs most commonly occurred in the IP setting (37.7%), followed by the OP (32.2%), and ER (30.1%) settings. The mean duration of each VOC episode was longest for those managed in the IP setting ().
Healthcare resource utilization and healthcare costs
Among commercially-insured patients, the mean annual number of IP days (0 VOCs: 1.3, 1 VOC: 4.0, 2+ VOCs: 16.0), ER days (0 VOCs: 0.8, 1 VOC: 1.3, 2+ VOCs: 3.4), and days with OP services (0 VOCs: 12.5, 1 VOC: 13.7, 2+ VOCs: 20.3) increased with the number of VOCs (). Similar trends were observed in Medicaid- and Medicare-insured patients.
Table 3. Annual healthcare resource utilization of patients with SCD stratified by the annual number of VOCs during the 12-month follow-up period.
Among commercially-insured patients, total annual all-cause healthcare costs were $15,747 per patient for those without VOC, $27,194 for those with 1 VOC, and $64,555 for those with 2+ VOCs (). Mean IP costs were $4,883 (31.0% of total) per patient for those without VOC, $14,442 (53.1% of total) for those with 1 VOC, and $42,192 (65.4% of total) for those with 2+ VOCs; ER and OP costs also increased – albeit more modestly – with the number of VOCs (). SCD-related costs accounted for 56.4% of total all-cause healthcare costs for patients without VOC, 78.4% for those with 1 VOC, and 93.9% for those with 2+ VOCs ().
Figure 3. Mean all-cause healthcare costs and inpatient costs per patient stratified by number of VOCs during the 12-month follow-up period. Abbreviations. SCD, sickle cell disease; USD, United States dollars; VOC, vaso-occlusive crisis.
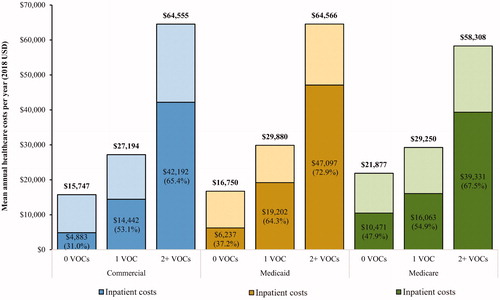
Figure 4. Mean all-cause and SCD-related healthcare costs per patient stratified by number of VOCs during the 12-month follow-up period. Abbreviations. SCD, sickle cell disease; USD, United States dollars; VOC, vaso-occlusive crisis.
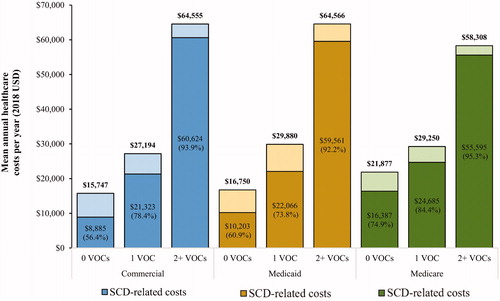
Table 4. Annual healthcare costs of patients with SCD stratified by the annual number of VOCs during the 12-month follow-up period.
Among Medicaid-insured patients, total annual all-cause healthcare costs were $16,750 per patient for those without VOC, $29,880 for those with 1 VOC, and $64,566 for those with 2+ VOCs (). Mean IP costs were $6,237 (37.2% of total), $19,202 (64.3% of total), and $47,097 (72.9% of total) for patients with 0, 1, and 2+ VOCs, respectively; more modest increases in ER and OP cost were also observed (). SCD-related costs accounted for 60.9% of total all-cause healthcare costs for patients without VOC, 73.8% for those with 1 VOC, and 92.2% for those with 2+ VOCs ().
Among Medicare-insured patients, total annual all-cause healthcare costs were $21,877 per patient for those without VOC, $29,250 for those with 1 VOC, and $58,308 for those with 2+ VOCs (). Mean IP costs were $10,471 (47.9% of total) per patient for those without VOC, $16,063 (54.9% of total) per patient for those with 1 VOC, and $39,331 (67.5% of total) for those with 2+ VOCs; ER and OP costs also increased – albeit more modestly – with the number of VOCs (). SCD-related costs accounted for 74.9% of total all-cause healthcare costs for patients without VOC, 84.4% for those with 1 VOC, and 95.3% for those with 2+ VOCs ().
Discussion
In this study, 35.3% of commercially-insured patients, 55.1% of Medicare-insured patients, and 63.9% of Medicaid-insured patients with SCD experienced 1+ VOCs requiring a healthcare visit over 1 year. VOCs were particularly common among Medicaid- and Medicare-insured patients, who had approximately three VOCs per year. All-cause healthcare costs and, in particular, SCD-related costs substantially increased with the number of VOCs across payer types. Healthcare services provided in the IP setting accounted for the large majority of this cost increase, and more modest increases in OP and ER costs were also observed.
Overall, 36.7% of commercially-insured patients, 48.1% of Medicaid-insured patients, and 65.3% of Medicare-insured-patients had evidence of an acute SCD-related complication, and similar proportions were observed for chronic SCD-related complications. Infectious and parasitic diseases and VTE were the two most common acute complications observed across payer types. Both are documented causes of ACS, another acute complication of SCD that was particularly common among Medicaid-insured patients in the current study. With respect to chronic complications, asthma and avascular necrosis consistently ranked among the most frequent complications; renal failure was particularly prevalent among Medicare-insured patients, possibly due to the older age of these patients as well as Medicare eligibility criteria (i.e. patients with end-stage renal disease are eligible to Medicare coverage, regardless of their age). While the relationship of these complications with VOCs is not completely understood, there is evidence that VOCs may be associated with the occurrence of subsequent SCD complications. In a recent study of patients with SCD in England, having 3+ VOCs (vs. 0) in the previous year was associated with a significantly higher risk of several acute and chronic SCD-related complications as well as a higher risk of mortalityCitation26,Citation27. Therefore, strategies to reduce the number of VOCs may also decrease the occurrence and mortality associated with other detrimental SCD complications.
The present study contributes to documenting the frequency and characteristics of VOCs across multiple payer types in the US. These outcomes were evaluated using a refined claims-based algorithm, which enabled an assessment of VOC characteristics under an episode-based framework rather than single time point events. While this algorithm shares several similarities with that of Shah et al.Citation24, a noteworthy difference is that the gap in time used to define distinct VOC episodes varied according to the setting in which care was dispensed. This approach was used to reflect what is observed in clinical practice with varying duration of care across settings, and the fact that the same pain episode may trigger more than one healthcare visit. Another methodological difference relates to the more specific definition of complicated VOC used in the current study. VOCs were classified as complicated when at least one of four complications causing severe pain was present, which is consistent with the definition used in the SUSTAIN studyCitation21. In contrast, Shah et al.Citation28 considered over 30 complications in their definition. Not all SCD-related complications will generate the same level of pain and, in this study, we focused on selected complications by the SUSTAIN trial that are associated with acute severe pain. This discrepancy likely explains the large difference in the observed rate of complicated VOC between the two studies (i.e. current study: 7–8%, Shah et al.: 30%). The claims-based algorithm developed in this study has not been validated. Nevertheless, we formulated an improved definition of VOCs that can be used to analyze health insurance claims data, which more accurately reflect real-world clinical practice.
Between 35–64% of patients had ≥ 1 VOC requiring a healthcare visit over 1 year. Regardless of the payer type considered, these figures are much lower than the proportion of 91% reported in a recent survey-based studyCitation29. This discrepancy may be largely explained by the fact that the latter figure included VOCs managed at home, which cannot be captured using insurance claims data. The observed annual rate of VOC among publicly-insured patients (∼3 per patient) was particularly high and was similar to that observed by Shah et al.Citation28 in a recent study conducted on a Medicaid population (3.3 per patient). This result is noteworthy given that a majority of patients with SCD are insured via Medicaid or MedicareCitation30–32. Furthermore, patients with 1+ VOCs tended to suffer multiple VOC episodes. For example, the subset of Medicare-insured patients with 1+ VOCs experienced, on average, more than six VOCs over 1 year. This result is consistent with prior evidence that a large proportion of overall HRU is driven by a relatively small subset of patients with SCD with high resource utilizationCitation33,Citation34. Another notable observation is that more than 60% of VOCs were managed in the IP or ER setting across all payer types, a proportion consistent with that reported by Rizio et al.Citation29 (IP: 40.1%, ER or urgent care: 70.4%). This proportion appeared even higher among Medicaid-insured patients (81%), which potentially signals gaps in care for this population. The fact that fewer physicians accept new Medicaid-insured patients than commercially-insured or Medicare-insured patients may contribute to Medicaid patients seeking healthcare in the IP settingCitation35,Citation36.
Annual all-cause healthcare costs substantially increased with the number of VOCs. Among commercially-insured and Medicaid-insured patients, all-cause healthcare costs were approximately 4-times higher among patients with 2+ VOCs relative to those without VOC, and a nearly 3-fold difference was observed among Medicare-insured patients. IP visits were a key driver of these cost differences. Relative to commercially-insured patients without VOC, IP costs were nearly 3-times higher among commercially-insured patients with 1 VOC and more than 8-times higher among those with 2+ VOCs. Similar observations were made in the Medicaid and Medicare populations. This result is consistent with a previous study from Shah et al.Citation24 in which IP costs represented 64% of total healthcare costs among Medicaid-insured patients, although the latter study did not stratify cost results based on the number of VOCs. Another study by Blinder et al.Citation37 reported that IP costs accounted for at least half of total healthcare costs among adult patients with SCD who did (67%) and did not (50%) receive iron chelation therapy. Furthermore, SCD-related costs accounted for the vast majority of the cost increase associated with a higher frequency of VOCs for all payer types. Previous studies also reported that SCD-related costs represented the majority of healthcare costs among all patients with SCD (i.e. pediatric and adult patients), but the present study is the first to describe the extent to which SCD-related costs increase with the frequency of VOCs in an adult population.
Annual healthcare costs varied among the different payer types evaluated in the current study; these differences may be explained by a number of factors. On average, Medicaid- and Medicare-insured patients experienced a higher number of VOCs than commercially-insured patients, which may lead to higher costs. In addition, the proportion of VOCs managed in the IP or ER setting, as well as the duration of these episodes of acute pain, was highest among Medicaid-insured patients, which may partially explain why patients in this population incurred higher healthcare costs than commercially-insured and Medicare-insured patients. Furthermore, the three study populations also significantly differed in terms of age and race. For example, total all-cause healthcare costs were higher among Medicaid-insured patients (mean age: 28.5 years) than commercially-insured patients (mean age: 36.7 years), despite the former population being younger than the latter. This observation may be explained by the fact that the frequency of VOCs peaks at approximately 30 years of age and tends to decrease afterwardCitation8. Among Medicare-insured patients, the fact that most patients were medically disabled and that more than 65% experienced acute or chronic SCD-related complications may also significantly contribute to the healthcare costs in this population. It is also worth emphasizing that Medicare-insured patients incurred numerically lower total all-cause healthcare costs than Medicaid-insured patients despite being, on average, 20 years older. While Medicaid-insured patients may have a more severe phenotype due to their younger ageCitation8, part of this cost difference may be attributable to a survival bias, since long-term survivors are more likely to have a milder form of the disease. Of note, we observed a higher proportion of White individuals in the Medicare population. This may in part be attributed to discrepancies in race across payers and probably reflects racial disparities in socio-economic status and health determinants. Further research is warranted to better understand the factors that underlie cost differences across payer types.
Limitations
The present study is subject to some limitations. First, claims data only include diagnoses and procedures that are recorded for reimbursement purposes; therefore, VOCs managed at home were not captured. This resulted in an underestimation of the proportion of patients with ≥1 VOC as well as the average number of VOCs per patient. Second, the following data were not available: (1) long-term care services (i.e. skilled nursing facility [SNF], mental hospital services, IP psychiatric facility, and intermediate care facility for intellectual disability), which accounted for 21% of Medicaid total health expenditure in 2018Citation38; (2) durable medical equipment use, home health agency, hospice, and SNF, which accounted for 11% of Medicare total spending in 2016Citation39; and (3) laboratory test results. Third, all analyses were descriptive in nature and in an observational setting, which means that no causal relationships can be inferred. Further research is required to better understand differences in treatment across the different populations and their associations with VOCs. Fourth, the study populations only included patients ≥16 years old and did not include patients with dual-eligibility (only), which may limit the generalizability of study findings. Fifth, we could not observe patients who received recent FDA-approved treatments for SCD due to data availability at the time the study was conducted. Lastly, administrative claims databases are subject to coding errors and inaccuracies on procedures or diagnosis codes.
Conclusions
In this study, a high proportion of patients with SCD had VOCs requiring healthcare services, and patients with 1+ VOCs tended to experience multiple VOC episodes. Total and SCD-related annual healthcare costs substantially increased with the annual number of VOCs, suggesting VOCs might be a major driver of costs in patients with SCD. When stratifying healthcare costs by the type of setting, VOCs managed in the IP setting accounted for the vast majority of the observed cost increase with the number of annual VOCs. Importantly, these conclusions held true for all payer types assessed in the current study (i.e. commercial, Medicaid, Medicare). Altogether, these results contribute to documenting the healthcare and cost burden associated with VOCs in patients with SCD. As new data become available, further research will be warranted to assess the extent to which new therapies may alleviate the high burden of VOCs.
Transparency
Declaration of funding
This study was funded by Novartis Pharmaceuticals Corporation.
Declaration of financial/other interests
NS received grants and personal fees from Novartis, grants and personal fees from GBT, personal fees from Alexion, and personal fees from CSL Behring, outside the submitted work. As an employee of Novartis, MB received salary, and dividends from Novartis, and owns Novartis stocks. DLV, PGS, ES, MD, and AG are employees of Analysis Group, Inc., which provided paid consulting services to Novartis for the conduct of the present study. GP has nothing to disclose. AK, VS, and MKS are employees of Novartis Healthcare Pvt. Ltd. LX has nothing to disclose.
JME peer reviewers on this manuscript have no relevant financial or other relationships to disclose.
Previous presentation
Part of the material in this manuscript was presented at the AMCP 2020 meeting held 21–24 April in Houston, TX, and at the ASH 2019 annual meeting held 7–10 December 2019 in Orlando, FL.
Online_Supplement.docx
Download MS Word (21.8 KB)Acknowledgements
Medical writing assistance was provided by Samuel Rochette, who is an employee of Analysis Group, Inc.
Data availability statement
Data used for this study are from IBM (used under license for the current study) and Centers for Medicare and Medicaid Services (CMS; administrative permissions were required to access the raw data under a data user agreement requesting HIPAA waiver and IRB exemption). Therefore, restrictions apply to the availability of these data, which are not publicly available.
References
- Kato GJ, Piel FB, Reid CD, et al. Sickle cell disease. Nat Rev Dis Primers. 2018;4:18010.
- Hassell KL. Population estimates of sickle cell disease in the US. Am J Prev Med. 2010;38(4 Suppl):S512–S521.
- McClish DK, Penberthy LT, Bovbjerg VE, et al. Health related quality of life in sickle cell patients: the PiSCES project. Health Qual Life Outcomes. 2005;3:50.
- Rees DC, Williams TN, Gladwin MT. Sickle-cell disease. Lancet. 2010;376(9757):2018–2031.
- Elmariah H, Garrett ME, De Castro LM, et al. Factors associated with survival in a contemporary adult sickle cell disease cohort. Am J Hematol. 2014;89(5):530–535.
- National Institute of Health – National Heart Lung and Blood Institute. Evidence-based management of sickle cell disease 2014; [cited 2019 November 4]. Available from: https://www.nhlbi.nih.gov/health-topics/evidence-based-management-sickle-cell-disease.
- Platt OS, Brambilla DJ, Rosse WF, et al. Mortality in sickle cell disease. Life expectancy and risk factors for early death. N Engl J Med. 1994;330(23):1639–1644.
- Platt OS, Thorington BD, Brambilla DJ, et al. Pain in sickle cell disease. Rates and risk factors. N Engl J Med. 1991;325(1):11–16.
- Ballas SK, Lusardi M. Hospital readmission for adult acute sickle cell painful episodes: frequency, etiology, and prognostic significance. Am J Hematol. 2005;79(1):17–25.
- Cronin RM, Hankins JS, Byrd J, et al. Risk factors for hospitalizations and readmissions among individuals with sickle cell disease: results of a U.S. survey study. Hematology. 2019;24(1):189–198.
- Houston-Yu P, Rana SR, Beyer B, et al. Frequent and prolonged hospitalizations: a risk factor for early mortality in sickle cell disease patients. Am J Hematol. 2003;72(3):201–203.
- Ballas SK, Kanter J, Agodoa I, et al. Opioid utilization patterns in United States individuals with sickle cell disease. Am J Hematol. 2018;93(10):E345–E347.
- Ruta NS, Ballas SK. The opioid drug epidemic and sickle cell disease: guilt by association. Pain Med. 2016;17(10):1793–1798.
- Su ZT, Segal JB, Lanzkron S, et al. National trends in hydroxyurea and opioid prescribing for sickle cell disease by office-based physicians in the United States, 1997–2017. Pharmacoepidemiol Drug Saf. 2019;28(9):1246–1250.
- Charache S, Terrin ML, Moore RD, et al. Effect of hydroxyurea on the frequency of painful crises in sickle cell anemia. N Engl J Med. 1995;332(20):1317–1322.
- McGann PT, Ware RE. Hydroxyurea therapy for sickle cell anemia. Expert Opin Drug Saf. 2015;14(11):1749–1758.
- Stettler N, McKiernan CM, Melin CQ, et al. Proportion of adults with sickle cell anemia and pain crises receiving hydroxyurea. JAMA. 2015;313(16):1671–1672.
- Niihara Y, Miller ST, Kanter J, et al. A phase 3 trial of L-glutamine in sickle cell disease. N Engl J Med. 2018;379(3):226–235.
- US Food and Drug Administration. Prescribing Information – ENDARI (L-glutamine) [cited 2020 Feb 26]. Available from: https://www.accessdata.fda.gov/drugsatfda_docs/label/2019/208587s001lbl.pdf.
- Vichinsky E, Hoppe CC, Ataga KI, et al. A phase 3 randomized trial of voxelotor in sickle cell disease. N Engl J Med. 2019;381(6):509–519.
- Ataga KI, Kutlar A, Kanter J, et al. Crizanlizumab for the prevention of pain crises in sickle cell disease. N Engl J Med. 2017;376(5):429–439.
- US Food and Drug Administration. Prescribing Information – ADAKVEO® (crizanlizumab-tmca); [cited 2020 Feb 25]. Available from: https://www.accessdata.fda.gov/drugsatfda_docs/label/2019/761128s000lbl.pdf.
- Fingar KR, Owens PL, Reid LD, et al. Characteristics of Inpatient Hospital Stays Involving Sickle Cell Disease, 2000–2016: Statistical Brief #251. Healthcare Cost and Utilization Project (HCUP) Statistical Briefs. Rockville (MD). 2019.
- Shah N, Bhor M, Xie L, et al. Treatment patterns and economic burden of sickle-cell disease patients prescribed hydroxyurea: a retrospective claims-based study. Health Qual Life Outcomes. 2019;17(1):155.
- Panepinto JA, Brousseau DC, Hillery CA, et al. Variation in hospitalizations and hospital length of stay in children with vaso-occlusive crises in sickle cell disease. Pediatr Blood Cancer. 2005;44(2):182–186.
- Bailey M, Abioye A, Morgan G, et al. Relationship between vaso-occlusive crises and important complications in sickle cell disease patients. Blood. 2019;134(Supplement_1):2167–2167.
- Herquelot E, Morgan G, Lamarsalle L, et al. PSY38 marginal structural model for studying the causal effect between vaso-occlusive crises and occurence of death or complications in the sickle-cell disease patients. Value in Health. 2019;22:S908.
- Shah N, Bhor M, Xie L, et al. Sickle cell disease complications: Prevalence and resource utilization. PLoS One. 2019;14(7):e0214355.
- Rizio AA, Bhor M, Lin X, et al. The relationship between frequency and severity of vaso-occlusive crises and health-related quality of life and work productivity in adults with sickle cell disease. Qual Life Res. 2020;29(6):1533–1547.
- Center for Disease Control and Prevention – National Center on Birth Defects and Developmental Disabilities. Sickle Cell Data Collection Program Report: Data to Action 2018; [cited 2018 Feb 27]. Available from: https://www.cdc.gov/ncbddd/hemoglobinopathies/data-reports/2018-summer/documents/sickle-cell-data-to-action-h.pdf.
- Nietert PJ, Abboud MR, Zoller JS, et al. Costs, charges, and reimbursements for persons with sickle cell disease. J Pediatr Hematol Oncol. 1999;21(5):389–396.
- Woods K, Karrison T, Koshy M, et al. Hospital utilization patterns and costs for adult sickle cell patients in Illinois. Public Health Rep. 1997;112(1):44–51.
- Carroll CP, Haywood C, Jr., Fagan P, et al. The course and correlates of high hospital utilization in sickle cell disease: evidence from a large, urban Medicaid managed care organization. Am J Hematol. 2009;84(10):666–670.
- Epstein K, Yuen E, Riggio JM, et al. Utilization of the office, hospital and emergency department for adult sickle cell patients: a five-year study. J Natl Med Assoc. 2006;98(7):1109–1113.
- Benenson I, Jadotte Y, Echevarria M. Factors influencing utilization of hospital services by adult sickle cell disease patients: a systematic review. JBI Database System Rev Implement Rep. 2017;15(3):765–808.
- Hing E, Decker S, Jamoom E. Acceptance of new patients with public and private insurance by office-based physicians: United States, 2013. NCHS Data Brief. 2015;(195):1–8.
- Blinder MA, Vekeman F, Sasane M, et al. Age-related treatment patterns in sickle cell disease patients and the associated sickle cell complications and healthcare costs. Pediatr Blood Cancer. 2013; 60(5):828–835.
- The Henry J. Kaiser Family Foundation. Distribution of Medicaid spending by service. 2018 [cited 2020 Mar 27]. Available from: https://www.kff.org/medicaid/state-indicator/distribution-of-medicaid-spending-by-service/view/print/?currentTimeframe=0&print=true&hx0026;sortModel=%7B%22colId%22:%22Location%22,%22sort%22:%22asc%22%7D.
- Medicare Payment Advisory Commission. Chapter 1: context for Medicare payment policy 2018 [cited 2020 Mar 27]. Available from: http://www.medpac.gov/docs/default-source/reports/mar20_medpac_ch1_sec.pdf?sfvrsn=0