
Abstract
Introduction
Health state utilities associated with weight change are needed as inputs for cost-utility analyses (CUAs) examining the value of treatments for obesity and type 2 diabetes (T2D). Although some pharmaceutical treatments currently in development are associated with substantial weight loss, little is known about the utility impact of weight decreases greater than 10%. The purpose of this study was to estimate utilities associated with body weight decreases up to 20% based on preferences of individuals with obesity, with and without T2D.
Methods
Health state vignettes were developed to represent respondents’ own current weight and weight decreases of 2.5, 5, 10, 15, and 20%. Health state utilities were elicited in time trade-off interviews in two UK locations (Edinburgh and London) with a sample of participants with obesity, with and without T2D. Mean utility increases associated with each amount of weight decrease were calculated. Regression analyses were performed to derive a method for estimating utility change associated with weight decreases.
Results
Analyses were conducted with data from 405 individuals with obesity (202 with T2D, 203 without T2D). Utility increases associated with various levels of weight decrease ranged from 0.011 to 0.060 in the subgroup with T2D and 0.015 to 0.077 in the subgroup without T2D. All regression models found that the percentage of weight decrease was a highly significant predictor of change in utility (p < .0001). The relationship between weight change and utility change did not appear to be linear. Equations are recommended for estimating utility change based on the natural logarithm of percentage of weight decrease.
Discussion
Results of this study may be used to provide inputs for CUAs examining and comparing the value of treatments that are associated with substantial amounts of weight loss in patients with obesity, with or without T2D.
Introduction
Cost-utility analyses (CUAs) conducted to inform healthcare resource allocation decisions have often accounted for the impact of weight change on health status and quality of lifeCitation1–3. These models have examined the cost-effectiveness of treatments for obesityCitation4–6 as well as medical conditions that tend to be related to obesity, such as type 2 diabetes (T2D)Citation7–10. To calculate quality-adjusted life years (QALYs), CUAs require health state utilities, which are values representing the strength of preference for various health statesCitation11. Therefore, utilities associated with weight change are needed as inputs for economic models examining the value of treatments for obesity and T2D.
A range of studies has been conducted to establish the link between body weight and health state utility. For individuals with body mass index (BMI) in the normal to obese range, lower BMI or body weight is generally associated with greater utilityCitation12–24. Despite the substantial amount of research linking utility and weight, the currently available data have some limitations. For example, most of these studies assessed weight or BMI at only a single point in time, rather than examining the impact of weight change on utilityCitation13,Citation14,Citation16–25. It is uncertain whether difference in utility across multiple patients at different BMIs would accurately represent the utility improvements associated with weight loss.
Another potential limitation is that many of these studies assessed utility with a generic preference-based measure such as the EQ-5DCitation14,Citation25–33. The EQ-5D has the advantage of maximizing comparability across studies, but it does not directly assess the impact of weight or weight loss. While responses to some dimensions of the EQ-5D could be indirectly affected by weight or weight loss (e.g. usual activities, anxiety/depression), the extent to which the instrument is sensitive to small or large changes in weight is uncertain.
Some published studies have focused on estimating the utility impact of changes in body weight. These studies have used a vignette-based approach to estimate the utility impact of relatively small changes in weight. For example, there are published estimates of utility changes associated with a 3–7% increase or decrease in body weightCitation34–39 and a weight gain or loss of one to five kilogramsCitation40,Citation41.
Several pharmaceutical treatments that are currently available or in development have been shown to be associated with greater amounts of weight loss. For example, QsymiaFootnotei is a combination of phentermine, an appetite suppressant, and extended-release topiramate, an antiepileptic agent. In one trial, 48.1% of participants with a BMI greater than 35 kg/m2 treated with Qsymia achieved a weight reduction of greater than 15%Citation42. In a sample of overweight and obese adults with BMI of ≥30 or ≥27 with a weight-related comorbidity, more than 50% of participants taking semaglutide achieved weight loss of more than 15%Citation43. In clinical trials of treatment for T2D, patients treated with tirzepatide have lost significantly more weight than placebo comparator groups, with weight loss frequently greater than 10%Citation44–47.
Despite these treatments associated with relatively large amounts of weight loss, little is known about the utility impact of body weight decreases in ranges greater than 10%. Three studies were located that have estimated utilities associated with 10 and 20% weight loss, but all three have limited applicability to newer treatments for diabetes and obesity. Two of these three studies were conducted in samples of patients seeking weight loss surgery, and mean BMI of the two samples was 46.5 and 47.1 kg/m2 Citation38,Citation48. Because of the relatively high BMI of this pre-surgical population, utilities from these two studies are unlikely to be relevant to most samples of patients with obesity or diabetes. The third study was conducted in a sample of 365 primary care patientsCitation39. Although 100 of the study participants were categorized as having obesity based on a BMI of at least 30, the majority of the sample had a BMI below the range of obesity. No studies were located that have estimated utility changes greater than or equal to 10% in the context of T2D.
To examine and compare the value of treatments that are associated with substantial amounts of weight loss, updated utility values are needed to represent the potential benefits of these larger decreases in weight in the context of general obesity and obesity with T2D. Therefore, the purpose of this study was to estimate health state utilities associated with body weight decreases up to 20% based on preferences of individuals with obesity, with and without T2D. Utilities were estimated in a vignette-based time trade-off (TTO) utility elicitation in the UK.
Methods
Overview of study design
This study was designed to estimate the change in health state utility associated with substantial decreases in body weight. Health state vignettes were developed to represent respondents’ own current weight and several lower weights. Utilities for these health states were elicited in TTO interviews with a sample of participants with obesity, with and without T2D. Interviews were conducted in two locations in the UK (Edinburgh and London) between October 2019 and September 2020. Descriptive analyses provided mean utility increases associated with decreases in body weight represented in the health states (i.e. 2.5, 5, 10, 15, 20%). Regression analyses were performed to derive a method for estimating utility change associated with weight decreases between those represented in the health states (e.g. a 12% decrease in weight).
Most interviews were conducted in person prior to the COVID-19 pandemic. Because of social distancing requirements due to the pandemic, the final interviews were conducted via videoconference. All participants provided written informed consent prior to participation. Study procedures and materials were approved by an independent institutional review board (Ethical & Independent Review Services; Study Number 19016).
Health state vignettes
Two sets of six health states were developed, one set to be valued by participants with obesity and T2D, and another set to be valued by participants with obesity without T2D. Each set included six health states: one corresponding to each participant’s own weight at the time of the interview and five other health states representing various levels of decreased weight (decreases of 2.5, 5, 10, 15, and 20% of current body weight).
In previous studies examining the link between weight change and utility change, weight change has been quantified in three ways. (1) Some studies have estimated the utility change associated with an absolute amount of weight change such as 5 kg weight lossCitation40,Citation41. (2) The second approach is to estimate the change in utility associated with a change in BMI category, such as transitioning from obese (BMI >30) to nonobese (BMI <30)Citation17,Citation48. (3) The third approach is to estimate the utility change associated with a relative amount of weight change linked to each respondent’s baseline weight, such as quantifying utility change associated with a weight loss of 3%Citation30,Citation34,Citation35,Citation37–39,Citation49.
The current study used this relative weight approach because the importance of a specific amount of weight loss depends on the person’s starting weight. For example, a weight loss of 8 pounds would likely be perceived differently by a person who weighs 180 pounds than by a person who weighs 350 pounds. The absolute weight loss approach is potentially problematic because an absolute amount of weight loss has different meaning to people at different weights, and therefore, it is difficult to interpret the impact of absolute weight loss without the context of the individual’s baseline weight. The categorical approach is also problematic because it fails to capture potentially important differences among patients. For example, two hypothetical patients could transition from obese to nonobese with BMI reductions of 1 (i.e. 30–29) or 9 (i.e. 34–25). Although both patients have the same category change, they differ significantly in the amount of weight loss and the likely impact of this weight loss on quality of life and utility.
The set of six health states for participants with obesity and T2D was developed by adapting language from health state vignettes that were used in previously published utility elicitation studiesCitation35,Citation36,Citation50–54. Like the current study, several of these previous studies were designed to estimate the utility impact of differences in weight. However, the previous studies focused on smaller amounts of weight change ranging from 3 to 5%Citation35,Citation36,Citation51. In the current study, these statements were adapted to represent the larger amounts of weight decreases observed in some patients receiving newer treatmentsCitation43–47,Citation55–57.
All six health states in the T2D set included the same introductory description of T2D, followed by a statement describing weight, which varied across the six health states representing the respondent’s current weight as well as weight decreases of 2.5, 5, 10, 15, and 20%. The T2D description included the following bullet point statements: “You have had type 2 diabetes for several years; You take oral medications (pills or tablets) and give yourself injections for your diabetes; Your blood sugar levels are generally in control; You very rarely have problems with excessive thirst, frequent urination, fatigue, irritability, and/or blurry vision.”
After the introductory bullet points describing T2D, each of these health states included a bullet point with the heading “weight.” The health state vignette depicting current weight stated, “You are at your current weight: [participant’s current weight in preferred units, which could be pounds, kilograms, or stones].” The other five health states included bullet points stating, “You weigh _____ (which is ______ LESS than you weight now).” The first blank was completed by the interviewer with the body weight that was 2.5, 5, 10, 15, or 20% lower than the participant’s current weight. The second blank included the amount of weight decrease from the participant’s current weight in the participant’s preferred unit of measurement. For example, if a participant weighed 300 pounds at the time of the interview, the 5% weight loss health state would say “You weigh 285 pounds (which is 15 pounds LESS than you weigh now).” The second set of health states (for participants without T2D) included only the single statement about weight with no description of diabetes or other clinical characteristics.
When the first health state describing current weight was introduced, interviewers said the following sentences to ensure that participants considered not only weight, but also the broader impact of weight on quality of life: “For this health state with your own current weight, you should assume that the hypothetical person’s overall quality of life is similar to your own. This includes your overall physical health, mental health, and ability to perform your usual activities.” Similarly, when introducing the five additional health states describing decreased weight, the interviewer said “Each of these health states is the same as the first one, except for the difference in weight. Depending on how much the weight is reduced, it is possible that quality of life may be affected.”
The health states were presented on individual cards. Participants were asked whether they thought about weight in terms of pounds, kilograms, or stones, and the blank spaces on the health state cards were completed using the participant’s preferred weight units. The full text for each health state is presented in Supplementary Appendix A.
As part of health state development, a pilot study was conducted with 31 participants with obesity in London (17 with T2D and 14 without T2D). The purpose of the pilot study was to evaluate the health states and the utility assessment method to ensure that they were clear to respondents before proceeding with the larger utility valuation study. Participants completed the utility valuation and then provided feedback. Health states were revised slightly based on feedback from participants and interviewer observations to ensure that the vignettes were easy to understand and value in a TTO task. The final versions of the health states were used in the last eight pilot interviews. Participants reported that the health states were clear and easy to understand, and they were able to follow the study procedures without difficulty. Results from the pilot interviews were not included in the subsequent analysis reported in the results section.
Participants
Participants were recruited via advertisements in several UK newspapers, online advertisements, and distribution of fliers. Potentially interested participants responded by email or voicemail to provide their contact information. They were then called for screening via telephone using a standardized screening script to determine eligibility and schedule interviews. Participants were recruited into two subgroups: obesity with T2D and obesity without T2D. All participants were required to be between the ages of 18 and 75 (inclusive), have a BMI ≥30, and reside in the UK. For the in-person interviews, each participant’s height and weight were measured prior to the utility elicitation to verify that BMI was ≥30. For the small number of interviews conducted by videoconference, participants were asked to weigh themselves and report their weight and height.
Participants in the subgroup with T2D were required to have been diagnosed with T2D. Participants currently receiving medication for T2D were required to provide proof of this treatment at the time of their interview (e.g. the medication itself, medication packaging, prescription note). Participants not currently receiving medication treatment for T2D were required to describe their diabetes symptoms, their treatment experience (which may include diet and exercise), and the diagnosis process in a way that clearly demonstrated personal experience with the disease.
Utility interview procedures and scoring
After the health states and interview procedures were finalized in the pilot study, health state utilities were elicited in a TTO valuation study in two locations in the UK (London and Edinburgh). In-person interviews were conducted one-on-one in offices to ensure privacy for the respondents. Virtual interviews were conducted one-on-one via videoconference using Microsoft Teams. For the in-person interviews, each participant was weighed prior to the utility elicitation so that the health state cards could be customized based on the participant’s weight at the time of the interview. Height was also measured so that BMI could be calculated. For the interviews conducted by videoconference, participants were asked to weigh themselves and report their weight and height.
Participants were introduced to the six health states within the appropriate set (i.e. either with or without T2D) and asked to rank the health states in order of preference. Health states were presented to each participant in random order. Respondents were asked to explain their reasons for the order of the health states in this introductory ranking exercise.
After the ranking was complete, utilities for each of the health states were elicited in a TTO task. When valuing each health state, participants were asked which of two options they preferred: a 20-year lifespan in the health state being rated or lifespans of varying duration in full health. The duration of time in full health alternated between longer and shorter periods of time (i.e. 20 years, 0 years [dead], 19 years, 1 year, 18 years, 2 years…). Utility (u) was calculated at the point of equal preference between y years in the health state being valued and x years in full health as u = x/y. Because no participants perceived any of the health states to be worse than dead, neither the task nor utility scoring approach needed to be altered to accommodate negative utility scores.
EQ-5D-5L
The EQ-5D-5L was administered to characterize the sample in terms of health status. The EQ-5D-5L is a self-administered, generic, preference-weighted measure with five items assessing mobility, self-care, usual activities, pain/discomfort, and anxiety/depressionCitation58. Each item has five response options, and the pattern of responses was used to calculate an index score using a published scoring approachCitation59.
Statistical analysis procedures
Statistical analyses were completed with SAS version 9.4 (SAS Institute, Cary, NC, USA). Continuous variables (including utilities and utility difference scores) were summarized as means and standard deviations. Categorical variables were presented as frequencies and percentages. Paired t-tests were conducted to test whether there were statistically significant pairwise differences between heath state utilities (e.g. the utility of the health state representing current weight vs. the utility of health states representing decreased weight). Paired t-tests were conducted to test for differences in utility by age and gender.
The mean utility increases reported for each health state may be used in cost-utility models to represent utility change associated with the percentage decreases in body weight that are represented in the health states. For future economic modeling, however, it may be necessary to estimate the utility increase associated with a specific amount of weight loss between those in the health states (i.e. 2.5, 5, 10, 15, and 20%). To derive equations that could be used to provide these estimates, a series of regression models accounting for repeated measures from participants were run to determine the optimal functional form (e.g. linear vs. logarithmic) for predicting utility change associated with any percentage of weight decrease between 2.5 and 20%.
In every model, the dependent variable was change in utility, and the key independent variable was the percentage of weight decrease (PWD) represented in each health state. Because cost-utility modeling will most likely be conducted separately for the two groups (with and without T2D), the regression models were run separately within each subgroup.
To understand the data and determine the optimal approach for predicting utility change based on PWD, a range of models were fitted to test different functional forms for the relationship between PWD and utility change. First, a linear relationship was considered with PWD as the independent variable. Values of this independent variable corresponded to the weight decrease described in the health states (i.e. 2.5, 5, 10, 15, 20%). To allow for a possible non-linear relationship between PWD and utility change, logarithmic and quadratic models were also run. In the logarithmic models, the natural logarithm (log) of PWD was included as an independent variable. In the quadratic models, a quadratic term for PWD was added to the linear model (i.e. PWD and PWD2 were included in the same model). All models were run with and without covariates hypothesized to modify the relationship between weight change and utility change. Covariates were gender (categorical), age (continuous), and BMI (continuous). Models included these covariates as main terms as well as in interaction with PWD. For instance, a model with PWD as a linear term could include an interaction between PWD and each of the three covariates to allow for a different slope between PWD and utility change depending on gender, age, and BMI. The optimal parameterization for PWD was selected based on model results while considering the expected shape of the relationship between PWD and utility change.
Results
Sample characteristics
Subgroup with obesity and type 2 diabetes
A total of 260 participants with obesity and T2D were scheduled for interviews, and 219 attended. Six participants had difficulty understanding the TTO procedures and were therefore unable to provide valid data. In addition, one participant did not consent to participate, and 10 were determined to be ineligible (e.g. BMI <30; no access to a desktop computer, laptop, or tablet with video capabilities and Google Chrome web browser). Thus, a total of 202 participants in this subgroup completed valid interviews, including 103 in Edinburgh and 99 in London. The majority of these interviews (n = 188) were conducted in person prior to the COVID-19 pandemic, and an additional 14 interviews were conducted via videoconference during the COVID-19 pandemic.
This subgroup was 51.5% male, with a mean age of 58.4 years (see for demographic characteristics). There were no differences in age or gender between the participant samples from Edinburgh and London, but the sample from Edinburgh had a higher percentage of White participants than the sample from London (92.2 vs. 67.7%, respectively). The mean BMI was 36.1, and nearly all participants (96.5%) reported wanting to lose weight, with an average desired weight loss of 44.6 lbs.
Table 1. Sample characteristics.
Participants reported being diagnosed with T2D an average of 9.5 years prior to data collection. Most participants were currently receiving medication to treat their diabetes (86.1%), with more than half of the sample taking only oral medication (60.9%) (see details in ). The most commonly reported comorbidities included: hypertension (29.7%), depression (27.2%), arthritis (25.2%), and anxiety (22.8%).
The mean EQ-5D-5L index score was 0.72 (SD = 0.22), which is similar to scores for patients with T2D and obesity in previous studiesCitation60.
Subgroup with obesity without type 2 diabetes
A total of 258 participants with obesity without T2D were scheduled for interviews, and 215 attended. Four of these participants had difficulty understanding the TTO procedures and were therefore unable to provide valid data. One participant did not consent to participate, and six were determined to be ineligible (e.g. BMI <30). A total of 204 interviews (197 in person; 7 via videoconference) were conducted with this subgroup, including 99 in Edinburgh and 105 in London.
During the analysis, one participant without T2D was identified as an outlier in the data set. This participant was the only respondent of 406 (including the subgroups with and without T2D) to have a utility decrease associated with weight loss. Although the participant’s BMI was in the obese range (i.e. ≥30), he reported during the interview that “I do not see myself as obese,” and “I would have to lose muscle to be at [a lower] weight and I would not want that.” Because this participant viewed the health states differently from the other 405 respondents, the participant was excluded from the analysis. Therefore, a total of 203 participants without T2D were included in the analysis sample.
This subgroup was 49.3% male, with a mean age of 52.3 years (). The mean BMI was 37.3, and most participants (98.5%) reported wanting to lose weight, with an average desired weight loss of 54.7 lbs. The most commonly reported comorbid health conditions were depression (34.5%), anxiety (26.6%), arthritis (22.7%), and hypertension (11.8%). The mean EQ-5D-5L index score was 0.73 (SD = 0.24), which is similar to scores for patients with obesity in previous studiesCitation61.
Health state rankings
Prior to the TTO utility elicitation, participants were asked to rank the health states in order of preference (). As expected, the great majority of participants preferred lower body weight over higher body weight. The health state representing a 20% decrease in weight was most commonly ranked as most preferred, while the health state with the respondents’ own current weight was most commonly ranked as least preferred.
Table 2. Health state rankingsa.
However, there were exceptions. A relatively small percentage of participants thought greater amounts of weight loss would be excessive. Some of these respondents perceived the lowest weights as being or appearing unhealthy (e.g. “I wouldn’t want to lose that much. I would look ill”). Others liked how they looked at a particular weight (e.g. “I think I would be becoming too skinny, I think my skin would hang off my neck. I like being big. It is all about appearance”) or were concerned about losing strength at a lower weight (e.g. “I want to maintain muscle mass”).
Health state utilities
Mean utility was inversely related to the body weight depicted in the health states, with greater utility associated with lower body weight (). Although mean utilities for each health state were consistently higher for the subgroup without T2D than for the subgroup with T2D, the pattern of scores was the same in both samples, with utility increasing as weight in the health states decreased. In the T2D subgroup, mean utilities ranged from 0.797 for diabetes with the respondents’ current weight to 0.857 for diabetes with 20% less weight. In the subgroup without T2D, mean utilities ranged from 0.817 for current weight to 0.894 for 20% less weight. In both subgroups, the mean utility for every health state representing decreased weight was significantly higher than the mean utility of the current weight health state (for all comparisons, p < .01).
Table 3. Health state utilities.
The utility increases associated with various levels of decreased body weight ranged from 0.011 to 0.060 in the subgroup with T2D and 0.015 to 0.077 in the subgroup without T2D (). These utility increases were compared between demographic subgroups, and no statistically significant between-group differences were found with regard to age or gender.
Nearly all participants (99.8%) rated all health states as better than dead, resulting in a positive utility value for every health state. No participants perceived any of the health states to be worse than dead, and therefore, there were no negative utility scores. One participant with T2D valued two of the health states (current weight and 2.5% weight decrease) as equal to dead, resulting in a utility score of 0 for these two health states. This participant said, “I know what health problems that weight brings…I have high blood pressure, high cholesterol, gallstones, pancreatitis, brought on by weight…It’s incredibly hard…I don’t want to die right now, but I don’t want to live like this for 20 years.”
Estimating utility change for weight change not represented in the health states
All regression models found that PWD was a highly significant predictor of change in health state utility (p < .0001 in all models). This was consistent across the linear, logarithmic, and quadratic models with and without covariates. The data were examined graphically to help determine which type of model best represented the relationship between these two variables.
As depicted in , the relationship between weight change and utility change did not appear to be linear. Both the quadratic term and the natural log of PWD were highly significant predictors of utility change (p < .0001) that allowed for a curvilinear relationship between the two variables. However, because utility increase continues to trend upward as PWD increases, the logarithm model appeared to best represent this relationship. Results of the two regression models predicting utility change based on the natural log of PWD, without covariates, are presented in .
Figure 1. Change in utility as a function of percentage change in weighta,b,c.
aThese are plots of the two regression models from that do not include covariates. Both models are log-linear regressions of change in utility as a function of the natural log of the weight change represented in the health states.
bModel for participants with diabetes: y = -0.00860970799921508 + 0.0216883437387603*log(x)
cModel for participants without diabetes: y = -0.00781776466699391 + 0.023685903755767*log(x)
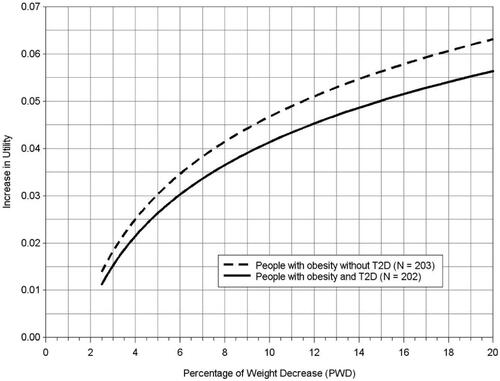
Table 4. Modeling weight change without covariates.
Covariates hypothesized to modify the relationship between weight change and utility change were added to the models above (i.e. gender, age, BMI). There were no significant main effects for any of these variables. Interactions of weight change with the covariates were also examined. Interaction with gender did not appear to add any predictive value. However, there did appear to be some interaction of weight change with age and BMI. In the subgroup with T2D, the relationship between the natural log of PWD and utility change is modified to some extent by age (p = .02 for the age by logPWD interaction) and BMI (p = .13 for the BMI by logPWD interaction). In the subgroup of patients without T2D, the interaction with BMI had no effect, but the relationship between the natural log of PWD and utility change is modified to some extent by the age of the respondent (p = .17 for the age by logPWD interaction).
Based on consideration of all regression models run for the current study, four potential equations are proposed for estimating utility change based on weight change. The first two equations in , which correspond to the models presented in , may be used to estimate utility change based on PWD without consideration of covariates. The third and fourth equations may be used when the covariates of age and BMI are available in the data set. presents examples of how the equations can be used to estimate utility increase associated with the percentage of weight decrease in hypothetical samples with varying T2D status, age, and BMI.
Table 5. Four equations proposed for estimating utility change based on weight decrease.
Table 6. Examples of how the equations can be used to estimate utility increase associated with percentage of weight decrease.
Discussion
Health states representing body weight reduction of 2.5% to 20% were associated with increases in health state utility based on preferences of individuals with obesity. Results followed similar patterns in the subgroups with and without T2D, with greater amounts of weight decrease associated with larger gains in utility. Results may be useful in cost-utility models examining and comparing the value of treatments for obesity and T2D that are associated with weight loss of up to 20%.
The mean utility increases in may be used in CUAs to represent utility change associated with the specific percentage decreases in body weight that are represented in the health states (i.e. 2.5, 5, 10, 15, and 20%). When it is necessary to estimate utility change associated with the percentage weight decreases between those represented in the health states (e.g. 7%), there are several possible approaches. One approach would be to round to the nearest percentage weight decrease represented in one of the health states. For example, to represent a 9% weight loss, one could use the utility increase associated with the health state describing a 10% weight loss (e.g. for a sample with T2D, the utility increase would be 0.048 as shown in ). A second approach would be to round down to the nearest health state, using the utility associated with a smaller amount of weight loss. Using this approach to represent a 9% weight loss, one could use the utility increase associated with the health state describing a 5% weight loss (e.g. 0.029 for a sample with T2D). This strategy is more conservative than the first because it is less likely to overestimate the utility benefit of weight loss.
A third and more precise approach would be to estimate the utility associated with a specific amount of weight loss based on modeling the relationship between weight change and utility change. Four equations were derived for this purpose and presented in . To determine which of these equations would be appropriate in each situation, researchers would first need to consider the population (i.e. obesity with or without T2D). Second, one must decide whether to use the equations with or without covariates. In general, the models with covariates should be used if age and BMI are available, but the equations without covariates are likely sufficient for most situations when the covariates are not available. Predictions from the model without covariates is most applicable to samples with age and BMI that are similar to the current sample.
Several previous studies have proposed similar equations that can be used to estimate utility based on BMI or body weightCitation12,Citation14,Citation15,Citation18,Citation22,Citation25,Citation29. The equations derived in the current study are different from those reported in previous research for several reasons. First, most of these previous equations modeled utility based on weightCitation14,Citation18,Citation22,Citation25, rather than modeling utility change based on weight change. Estimates of utility associated with body weight at a single point in time may not capture the quality of life benefits of weight loss.
Second, previously published equations assumed a linear relationship between weight and utilitiesCitation12,Citation14,Citation15,Citation18,Citation22,Citation25,Citation29. Results of the current study suggest that the relationship between weight change and utility change is not linear (see the logarithmic function in ). Therefore, previously published linear models may be underestimating the utility benefit of smaller amounts of weight loss and overestimating the utility gains associated with larger amounts of weight loss.
Third, much of the previous research estimated utility with generic instruments such as the EQ-5D or SF-36Citation14,Citation25–33,Citation62,Citation63. While generic instruments help to maximize comparability across studies, they were not designed to assess the impact of weight change. Scores on these generic instruments are influenced by many aspects of health, and their sensitivity to weight loss is unknown. The vignette-based design in the current study was able to isolate the impact of weight decrease on utility because body weight was the only difference between health states. Therefore, the mean utility increases in and equations in specifically represent preferences for various levels of weight loss.
When using the results of this study to derive utilities for use in CUAs, researchers should be aware of the limitations of the equations proposed in . First, because the health states only described weight loss, the resulting equations should not be used to estimate utility change associated with weight gain. It is likely that the magnitude of utility change associated with weight gain could be different than utility change associated with weight lossCitation35. The current study does not provide insight into preference values for weight gain. In addition, it is not recommended to use these equations to estimate utility change associated with weight decreases of greater than 20%. For each individual patient with obesity or T2D, there is a point at which weight loss would become too much, leading to health problems. Current results do not provide insight into how much weight loss would be too much for participants at various levels of BMI.
This study also has limitations associated with sample characteristics. Because there are cultural differences in perceptions of weight and physical appearance, preferences for these health states would likely vary across cultures and geographic regions. The extent to which the reported utilities would generalize to populations outside the UK is not known. Therefore, it may be useful to replicate this research in other locations before applying the resulting utilities in cost-effectiveness modeling to support decision-making in countries other than the UK. Furthermore, although efforts were made to recruit a sample that was diverse and consistent with the UK general population with regard to key demographic variables, the recruitment strategy based on advertising in two geographic locations does not allow for the sample to be considered nationally representative.
When using these utilities, modelers should be aware that the values are derived from a sample of people with obesity, some of whom were also diagnosed with T2D. The advantage of this approach is that the utilities are based on the perspectives of people who truly understand the impact of obesity on quality of life. However, utilities used in CUAs are often based on the values of general population samples, rather than patient samples. The extent to which the currently reported utilities may be consistent with general population values is not known. It should also be noted that the current sample included people across a broad spectrum of obesity, with BMI ranging from 30.0 to 69.9. Therefore, their perceptions of weight loss may differ from those gathered in previous studies focusing on samples of patients considering bariatric surgery, whose BMI is often over 40Citation27–29,Citation64.
In sum, this study provides two potentially useful approaches for estimating health state utility gains associated with weight loss of up to 20%. The mean utility increases associated with each health state may be used in cost-utility models to represent utility change associated with a specific percentage decrease in body weight. In addition, four equations have been proposed for estimating utility gains associated with any amount of weight loss up to 20% of one’s body weight, and the optimal equation can be selected depending on the target population (obesity with or without T2D) and modeling needs. All regression models revealed a highly significant relationship between weight change and utility change, suggesting that it is appropriate to predict utility change based on weight loss. Results of the study may be used to provide inputs for CUAs examining and comparing the value of treatments that are associated with substantial amounts of weight loss in patients with obesity and T2D.
Transparency
Declaration of funding
This study was funded by Eli Lilly and Company. The authors had independence in decisions related to the study design, study conduct, interpretation of data, and manuscript content.
Declaration of financial interests
Authors LM, KS, HA, TH, KM, and KJI are or were employed by Evidera at the time of this study. Authors KB, AS, and LFL are employed by Eli Lilly and Company, who provided funding for this research study.
Peer reviewers on this manuscript have no relevant financial or other relationships to disclose.
Author contributions
KB, LM, AS, and LFL were responsible for study conception and design. KB, LM, KS, KM, and KJI were responsible for data analysis and interpretation. LM, KS, TH, and HA drafted the manuscript while KB, LM, KS, TH, AS, and LFL provided revision for intellectual content. All authors gave final approval of the version to be published and all authors agree to be accountable for all aspects of the work.
Acknowledgements
The authors would like to thank Adebimpe Atanda, Melissa Garcia, Sonya Stanczyk, Karmjeet Kaur, Gordon Parola, Chris Langelotti, Melissa Ross, Jennifer Hill, Hayley Karn, Ella Brookes, Amara Tiebout, Natalie Taylor, Marissa Walsh, Kristen Deger, Katelyn Cutts, and Hannah Collacott for assistance with data collection; Karen Malley and Robyn Cyr for statistical programming; and Amara Tiebout for editorial assistance.
Previous presentations
Boye KS, Matza LS, Stewart KD, Andrews H, Howell TA, Stefanski A, Malley KG, Ishak KJ, Landó LF. Health State Utilities Associated with Weight Loss in Type 2 Diabetes and Obesity. Presented at ISPOR EU; December 1-3 2021.
Ethics/consent
All participants provided written informed consent prior to participation. Study procedures and materials were approved by an independent Institutional Review Board (Ethical & Independent Review Services; Study Number 19016).
Supplemental Material
Download MS Word (25 KB)Data availability statement
Data can be made available on reasonable request.
Notes
i Qsymia is a registered trademark of VIVUS LLC, Campbell, CA, USA.
References
- Borisenko O, Lukyanov V, Ahmed AR. Cost-utility analysis of bariatric surgery. Br J Surg. 2018;105(10):1328–1337.
- Hagberg LA, Brekke HK, Bertz F, et al. Cost-utility analysis of a randomized controlled weight loss trial among lactating overweight/obese women. BMC Public Health. 2014;14:38.
- Stanford FC, Alfaris N, Gomez G, et al. The utility of weight loss medications after bariatric surgery for weight regain or inadequate weight loss: a multi-center study. Surg Obes Relat Dis. 2017;13(3):491–500.
- Castilla I, Mar J, Valcárcel-Nazco C, et al. Cost-utility analysis of gastric bypass for severely obese patients in Spain. Obes Surg. 2014;24(12):2061–2068.
- McEwen LN, Coelho RB, Baumann LM, et al. The cost, quality of life impact, and cost-utility of bariatric surgery in a managed care population. Obes Surg. 2010;20(7):919–928.
- Xu H, Li Y, Du S, et al. Cost-utility and cost-benefit analyses of school-based obesity prevention program. BMC Public Health. 2020;20(1):1608.
- Assumpcao RP, Bahia LR, da Rosa MQM, et al. Cost-utility of gastric bypass surgery compared to clinical treatment for severely obese with and without diabetes in the perspective of the Brazilian public health system. Obes Surg. 2019;29(10):3202–3211.
- Clarke PM, Gray AM, Briggs A, UKPDS 72 United Kingdom Prospective Diabetes Study, et al. Cost-utility analyses of intensive blood glucose and tight blood pressure control in type 2 diabetes (UKPDS 72). Diabetologia. 2005;48(5):868–877.
- Gu S, Shi L, Shao H, et al. Choice across 10 pharmacologic combination strategies for type 2 diabetes: a cost-effectiveness analysis. BMC Med. 2020;18(1):378.
- Men P, Liu T, Zhai S. Empagliflozin in type 2 diabetes mellitus patients with high cardiovascular risk: a model-based cost-utility analysis in China. Diabetes Metab Syndr Obes. 2020;13:2823–2831.
- Brazier J, Ara R, Rowen D, et al. A review of generic preference-based measures for use in cost-effectiveness models. Pharmacoeconomics. 2017;35(Suppl 1):21–31.
- Ackermann RT, Edelstein SL, Narayan KMV, Diabetes Prevention Program Research Group, et al. Changes in health state utilities with changes in body mass in the diabetes prevention program. Obesity. 2009;17(12):2176–2181.
- Al-Rubaye AKQ, Johansson K, Alrubaiy L. The association of health behavioral risk factors with quality of life in Northern Sweden-a cross-sectional survey. J Gen Fam Med. 2020;21(5):167–177.
- Bagust A, Beale S. Modelling EuroQol health-related utility values for diabetic complications from CODE-2 data. Health Econ. 2005;14(3):217–230.
- Hakim Z, Wolf A, Garrison LP. Estimating the effect of changes in body mass index on health state preferences. Pharmacoeconomics. 2002;20(6):393–404.
- Kiadaliri AA, Gerdtham U-G, Eliasson B, et al. Health utilities of type 2 diabetes-related complications: a cross-sectional study in Sweden. Int J Environ Res Public Health. 2014;11(5):4939–4952.
- Kontodimopoulos N, Pappa E, Chadjiapostolou Z, et al. Comparing the sensitivity of EQ-5D, SF-6D and 15D utilities to the specific effect of diabetic complications. Eur J Health Econ. 2012;13(1):111–120.
- Kortt MA, Clarke PM. Estimating utility values for health states of overweight and obese individuals using the SF-36. Qual Life Res. 2005;14(10):2177–2185.
- Lee AJ, Morgan CL, Morrissey M, et al. Evaluation of the association between the EQ-5D (health-related utility) and body mass index (obesity) in hospital-treated people with type 1 diabetes, type 2 diabetes and with no diagnosed diabetes. Diabet Med. 2005;22(11):1482–1486.
- Lin VW, Wong ES, Wright A, et al. Association between health-related quality of life and body mass after adjustable gastric banding: a nonlinear approach. Value Health. 2013;16(5):823–829.
- Redekop WK, Koopmanschap MA, Stolk RP, et al. Health-related quality of life and treatment satisfaction in dutch patients with type 2 diabetes. Diabetes Care. 2002;25(3):458–463.
- Solli O, Stavem K, Kristiansen IS. Health-related quality of life in diabetes: the associations of complications with EQ-5D scores. Health Qual Life Outcomes. 2010;8:18.
- Trevino RP, Pham TH, Edelstein SL. Obesity and preference-weighted quality of life of ethnically diverse middle school children: the HEALTHY study. J Obes. 2013;2013:206074.
- Yfantopoulos J, Chantzaras A. Health-related quality of life and health utilities in insulin-treated type 2 diabetes: the impact of related comorbidities/complications. Eur J Health Econ. 2020;21(5):729–743.
- Kamradt M, Krisam J, Kiel M, et al. Health-Related quality of life in primary care: Which aspects matter in multimorbid patients with type 2 diabetes mellitus in a community setting? PLOS One. 2017; 12(1) :e0170883.
- Bentley TGK, Palta M, Paulsen AJ, et al. Race and gender associations between obesity and nine health-related quality-of-life measures. Qual Life Res. 2011;20(5):665–674.
- Campbell JA, Hensher M, Neil A, et al. An exploratory study of long-term publicly waitlisted bariatric surgery patients' quality of life before and 1 year after bariatric surgery, and considerations for healthcare planners. PharmacoEconomics Open. 2018;2(1):63–76.
- Fermont JM, Blazeby JM, Rogers CA, By-Band-Sleeve Study Management Group, et al. The EQ-5D-5L is a valid approach to measure health related quality of life in patients undergoing bariatric surgery. PLOS One. 2017;12(12):e0189190.
- Lester EL, Padwal R, Majumdar SR, et al. Association of preference-based health-related quality of life with weight loss in obese adults. Value Health. 2017;20(4):694–698.
- Nauck MA, Buse JB, Mann JFE, LEADER Publication Committee for the LEADER Trial Investigators, et al. Health-related quality of life in people with type 2 diabetes participating in the LEADER trial. Diabetes Obes Metab. 2019;21(3):525–532.
- Rothberg AE, McEwen LN, Kraftson AT, et al. The impact of weight loss on health-related quality-of-life: implications for cost-effectiveness analyses. Qual Life Res. 2014;23(4):1371–1376.
- Wang P, Luo N, Tai ES, et al. The EQ-5D-5L is more discriminative than the EQ-5D-3L in patients with diabetes in Singapore. Value Health Reg Issues. 2016;9:57–62.
- Zhang P, Brown MB, Bilik D, et al. Health utility scores for people with type 2 diabetes in U.S. managed care health plans: results from translating research into action for diabetes (TRIAD). Diabetes Care. 2012;35(11):2250–2256.
- Lane S, Levy AR, Mukherjee J, et al. The impact on utilities of differences in body weight among Canadian patients with type 2 diabetes. Curr Med Res Opin. 2014;30(7):1267–1273.
- Matza LS, Boye KS, Yurgin N, et al. Utilities and disutilities for type 2 diabetes treatment-related attributes. Qual Life Res. 2007;16(7):1251–1265.
- Matza LS, Yurgin N, Boye KS, et al. Obese versus non-obese patients with type 2 diabetes: patient-reported outcomes and utility of weight change. Curr Med Res Opin. 2007;23(9):2051–2062.
- Rajan N, Boye KS, Gibbs M, et al. Utilities for type 2 diabetes treatment-related attributes in a South Korean and Taiwanese population. Value Health Reg Issues. 2016;9:67–71.
- Wee CC, Davis RB, Huskey KW, et al. Quality of life among obese patients seeking weight loss surgery: the importance of obesity-related social stigma and functional status. J Gen Intern Med. 2013;28(2):231–238.
- Wee CC, Hamel MB, Davis RB, et al. Assessing the value of weight loss among primary care patients. J Gen Intern Med. 2004;19(12):1206–1211.
- Olofsson S, Norrlid H, Persson U. Preferences for improvements in attributes associated with basal insulin: a time trade-off and willingness-to-pay survey of a diabetic and non-diabetic population in Sweden. J Med Econ. 2016;19(10):945–958.
- Ridderstrale M, et al. Estimating the impact of changes in HbA1c, body weight and insulin injection regimen on health related quality-of-life: a time trade off study. Health Qual Life Outcomes. 2016;14:13.
- Lonneman DJ, Jr., Rey JA, McKee BD. Phentermine/topiramate extended-release capsules (qsymia) for weight loss. PT. 2013;38(8):446–452.
- Wilding JPH, Batterham RL, Calanna S, et al. Once-weekly semaglutide in adults with overweight or obesity. N Engl J Med. 2021;384(11):989–1002.
- Dahl D, Onishi Y, Norwood PAUL, et al. 80-LB: tirzepatide, a dual GIP/GLP-1 receptor agonist, is effective and safe when added to basal insulin for treatment of type 2 diabetes (SURPASS-5). Am Diab Assoc 81st Sci Sessions. 2021;70(Supplement 1): 80-LB.
- Frias JP, Davies MJ, Rosenstock J, et al. 84-LB: efficacy and safety of tirzepatide versus semaglutide once weekly as add-on therapy to metformin in people with type 2 diabetes (SURPASS-2). Am Diab Assoc 81st Sci Sessions. 2021;70(Supplement 1):84-LB.
- Ludvik B, Giorgino F, Jodar E, et al. 78-LB: efficacy and safety of tirzepatide, a dual GIP/GLP-1 receptor agonist, compared to insulin degludec in patients with type 2 diabetes (SURPASS-3) [abstract], in. Am Diab Assoc 81st Sci Sessions. 2021;70(Supplement 1):78-LB.
- Rosenstock J, Wysham CH, Frias JP, et al. 100-OR: efficacy and safety of once weekly tirzepatide, a dual GIP/GLP-1 receptor agonist versus placebo as monotherapy in people with type 2 diabetes (SURPASS-1) [abstract]. Am Diab Assoc 81st Sci Sessions. 2021;70(Supplement 1):100-OR.
- Cvetanovic G, Stojiljković M, Miljkovic M. Estimation of the relationship between hypoglycemia and body mass index on health-related quality of life, in patients with type 2 diabetes mellitus. Vojnosanitetski Pregled. 2016;74:98–98.
- Wee C, Jones D, Davis R, et al. Understanding patients' value of weight loss and expectations for bariatric surgery. Obes Surg. 2006;16(4):496–500.
- Boye KS, Matza LS, Stewart KD, et al. Patient preferences and health state utilities associated with dulaglutide and semaglutide injection devices among patients with type 2 diabetes in Italy. J Med Econ. 2019;22(8):806–813.
- Boye KS, Matza LS, Walter KN, et al. Utilities and disutilities for attributes of injectable treatments for type 2 diabetes. Eur J Health Econ. 2011;12(3):219–230.
- Matza L, Boye K, Jordan J, et al. Patient preferences in Italy: health state utilities associated with attributes of weekly injection devices for treatment of type 2 diabetes. PPA. 2018;12:971–979.
- Matza LS, Boye KS, Stewart KD, et al. Health state utilities associated with attributes of weekly injection devices for treatment of type 2 diabetes. BMC Health Serv Res. 2017;17(1):774.
- Matza LS, Cutts KN, Stewart KD, et al. Health state utilities associated with treatment process for oral and injectable GLP-1 receptor agonists for type 2 diabetes. Qual Life Res. 2021;30(7):2033–2043.
- Courcoulas AP, King WC, Belle SH, et al. Seven-Year weight trajectories and health outcomes in the longitudinal assessment of bariatric surgery (LABS) study. JAMA Surg. 2018;153(5):427–434.
- Maciejewski ML, Arterburn DE, Van Scoyoc L, et al. Bariatric surgery and long-term durability of weight loss. JAMA Surg. 2016;151(11):1046–1055.
- Welbourn R, Hollyman M, Kinsman R, et al. Bariatric surgery worldwide: Baseline demographic description and one-year outcomes from the fourth IFSO global registry report 2018. Obes Surg. 2019;29(3):782–795.
- Rabin R, Gudex C, Selai C, et al. From translation to version management: a history and review of methods for the cultural adaptation of the EuroQol five-dimensional questionnaire. Value Health. 2014;17(1):70–76.
- van Hout B, Janssen MF, Feng Y-S, et al. Interim scoring for the EQ-5D-5L: mapping the EQ-5D-5L to EQ-5D-3L value sets. Value Health. 2012;15(5):708–715.
- Janssen MF, Lubetkin EI, Sekhobo JP, et al. The use of the EQ-5D preference-based health status measure in adults with type 2 diabetes mellitus. Diabet Med. 2011;28(4):395–413.
- Sach TH, Barton GR, Doherty M, et al. The relationship between body mass index and health-related quality of life: comparing the EQ-5D, EuroQol VAS and SF-6D. Int J Obes. 2007;31(1):189–196.
- Keating CL, Peeters A, Swinburn BA, et al. Utility-based quality of life associated with overweight and obesity: the Australian Diabetes, Obesity, and Lifestyle Study. Obesity. 2013;21(3):652–655.
- Schunk M, Reitmeir P, Schipf S, et al. Health-related quality of life in women and men with type 2 diabetes: a comparison across treatment groups. J Diabetes Compl. 2015;29(2):203–211.
- Wiklund M, Olsén MF. Physical function and health related quality of life before and 18 months after bariatric surgery. TOOBESJ. 2015;7(1):12–16.