
Abstract
Objective
Describe the economic burden of COVID-19 on employers and employees in the United States (US).
Methods
A targeted literature review was conducted to evaluate the impact of COVID-19 on US-based employers and employees in terms of healthcare resource utilization (HCRU), medical costs, and costs associated with work-loss. Searches were conducted in MEDLINE, Embase, and EconLit using a combination of disease terms, populations, and outcomes to identify articles published from January 2021 to November 4, 2022. As data from the employer perspective were lacking, additional literature related to influenza were included to contextualize the impact of COVID-19, as it shifts into an endemic state, within the existing respiratory illness landscape.
Results
A total of 41 articles were included in the literature review. Employer and employee perspectives were not well represented in the literature, and very few articles overlapped on any given outcome. HCRU, costs, and work impairment vary by community transmission levels, industry type, population demographics, telework ability, mitigation implementation measures, and company policies. Work-loss among COVID-19 cases were higher among the unvaccinated and in the week following diagnosis and for some, these continued for 6 months. HCRU is increased in those with COVID-19 and COVID-19-related HCRU can also continue for 6 months.
Conclusions
COVID-19 continues to be a considerable burden to employers. The majority of COVID-19 cases impact working age adults. HCRU is mainly driven by outpatient visits, while direct costs are driven by hospitalization. Productivity loss is higher for unvaccinated individuals. An increased focus to support mitigation measures may minimize hospitalizations and work-loss. A data-driven approach to implementation of workplace policies, targeted communications, and access to timely and appropriate therapies for prevention and treatment may reduce health-related work-loss and associated cost burden.
PLAIN LANGUAGE SUMMARY
In January 2020, the US government declared COVID-19 a public health emergency. This lasted until May 2023. To fight this health emergency, the US government provided free testing, vaccination, and treatment. Although the US government has declared the emergency over, COVID-19 continues to infect people. For people with private health insurance, costs associated with COVID-19 patient healthcare have now been transferred from the government to employers. In this study, we collected information from published scientific articles about the costs of COVID-19 for employers and workers in the US. We found that people who were not vaccinated against COVID-19 required more medical care and cost more than people who were vaccinated. In some cases, this trend lasted for as long as 6 months. This was mostly because of workers missing work, not working effectively while sick, and needing to be hospitalized. People who could work from home, whose companies had policies to prevent infections, and who took steps to avoid getting infected needed less medical care and missed work less often. This information may be used to help develop policies, communications, and guidance to prevent COVID-19 and limit its impact on employers and workers.
Introduction
COVID-19 is a leading cause of death in the USCitation1,Citation2 and has caused repercussions for economies around the world, resulting in significant medical expenditures and work loss.Citation3 The COVID-19 pandemic caused dramatic changes to the U.S. workforce in terms of work loss due to illness, isolation protocols, and caregiver demands.Citation4 There is an abundance of literature focusing on the health impacts of COVID-19; however, published literature on the impact in the employed population is limited.
As of June 2021, the total estimated cumulative cost of the COVID-19 pandemic to employers in the US was estimated to be about $54 billion,Citation5 and this estimate has continued to rise as cases continue. Workers of any industry are susceptible to COVID-19 though workers in some industries may be at higher risk of infection due to variability in geography, transmission level, employee demographics, differential prevention measures and policies, job-specific activities, and telework ability. As a response to COVID-19, the US federal government implemented several measures to provide vaccines, treatments, and tests for COVID-19 free of charge to individuals regardless of insurance status. With the end of the public health emergency declaration, these costs for privately insured individuals will gradually transfer to employers, similar to other respiratory illnesses, such as influenza.Citation6
As of August 16, 2023, the World Health Organization (WHO) had reported more than 769 million COVID-19 cases, and over 6.9 million deaths from COVID-19 worldwide.Citation7 Global data show that the US has the highest raw number of confirmed deaths as registered by the WHO,Citation7 though cases of COVID-19 are underreported in the US.Citation8 While national incidence is no longer being reported by the Centers for Disease Control and Prevention (CDC), COVID-19–related deaths and hospitalizations continue, as do employer costs associated with healthcare resource utilization (HCRU) and business disruption from absences, defined as absenteeism, and lost productivity due to working while not feeling well, defined as presenteeism.
The focus of this paper is to review the available literature on the impact of COVID-19 on employer and employee costs through 2022. This period captures the bulk of literature on the COVID-19 and provides a benchmark for the costs for testing, vaccinations, and treatments of COVID-19 for commercially insured individuals. The increased utilization of the hybrid work model has made measuring work loss from COVID-19 challenging. Employer costs associated with influenza were incorporated into this analysis to emulate an endemic scenario where COVID-19 infections are considered in a similar manner as other acute respiratory illnesses.
Methods
A targeted literature review (TLR) was conducted to identify literature related to the economic burden of COVID-19 on employers and employees. As a best practice, the TLR followed the methodology set out in a prespecified review protocol, which ensured that the review followed the broad principles outlined in the Preferred Reporting Items for Systematic Reviews and Meta-Analyses guidelines and the Cochrane Handbook for Systematic Reviews of Interventions, with clear documentation of the review methodology, search strategy and yields, and study attrition.
Searches were conducted on November 4, 2022, in MEDLINE, Embase, and EconLit using a combination of disease terms (e.g. COVID-19), populations (e.g. workers, employers), and outcomes (e.g. absenteeism, presenteeism, healthcare resource use, costs) to identify articles published since January 2021. Preprints from bioRxiv, medRxiv, and Love of COVID were also eligible for inclusion. Database searches were supplemented by targeted searches of union and employee group websites, private insurance company websites, government websites, and additional Google searches. All records underwent a two-stage screening process and were screened by a single reviewer. In the first stage of screening, each title and abstract of all articles retrieved by the searches was assessed against the inclusion criteria (Supplementary Table S1). Those deemed relevant were moved to the second stage of screening where the full-text paper was reviewed by a single reviewer against the inclusion criteria. Validation of 25% of excluded studies at each stage of screening was conducted as a quality-control step. Following the screening process, a targeted approach was used to determine which studies to include for data extraction and reporting. Final targeted selection of the most relevant studies was determined according to the same criteria during full-text review of the publications that passed the first level of screening. Publications reporting the economic impact of COVID-19 on workers, employers, or employment sectors were eligible for inclusion. Studies reporting healthcare resource use, costs, or activity impairment due to confirmed cases of COVID-19 in the populations of interest were prioritized for inclusion in the TLR.
Given the limited body of relevant literature identified specific to COVID-19, grey literature searches were expanded to also include studies reporting outcomes of interest in eligible populations that experienced influenza and respiratory symptoms (Supplementary Table S2). The targeted searches of union and employee group websites, private insurance company websites, government websites, and additional Google searches were rerun on November 21, 2022, to identify relevant articles published since January 2016 on the economic impact of influenza or other respiratory symptoms on workers, employers, or employment sectors. No database searches were conducted for the influenza cohort. It should also be noted that clear separation of true employer and employee costs may not have always been available and hence, some of our findings reflect costs for both.
Results
Medical impact of COVID-19 in the US: HCRU, and costs
Approximately 70% of the total documented cases of COVID-19 in the US have occurred in people of the working-aged range (18 to 64 years).Citation9 Between August 1, 2020, and August 19, 2023, there were a total of 2,204,774 hospitalizations among the US population who were of working age (18 to 59) with COVID-19 associated hospitalizations reported to the CDC’s National Healthcare Safety Network. Hospitalizations (CDC COVID Data Tracker) in this age group account for approximately 35% of all COVID-19 hospitalizations.Citation10 There have been numerous studies evaluating HCRU and costs due to COVID-19, mainly related to hospitalization, intensive care unit (ICU) admissions, and mechanical ventilation (MV) yet there is limited evidence related to these outcomes within employed populations specifically.
In a study evaluating HCRU and costs derived from insurance claims of 150,731 commercially insured COVID-19 cases selected between January 1, 2018, and March 1, 2021, who were matched to pre-pandemic controls, the costs and HCRU were found to be significantly higher for those with COVID-19.Citation11 This was a matched cohort study where patients with an index diagnosis of COVID-19 were compared to a control group of individuals who had no record of COVID-19, personal history of COVID-19, or pneumonia caused by COVID-19. Patients were matched on region of residence, sex, and birth year, insurance plan type, Elixhauser Comorbidity Index (ECI), and total baseline health care costs as independent variables. The control group’s healthcare usage was analyzed during the year 2019, which was before the pandemic, and their index date was set as 1 year prior to the index date of their matched COVID-19 patient, i.e. the first observed diagnosis of COVID-19. The mean age in both groups after matching was 40 years, and prevalence of comorbidities was well balanced. The study found HCRU to be highest in the first month after diagnosis with COVID-19, with the increase persisting for several months ( and Supplementary Table S3). This may be due to the prolonged recovery period for some COVID-19 patients as well as the need for ongoing monitoring and management of symptoms. Long COVID, defined by the WHO as the continuation or emergence of novel symptoms that occur 3 months following the initial SARS-CoV-2 infection and persist for at least 2 months without any other rational explanation,Citation12 may also play a role in the increased HCRU over a period of 6 months, though it was not evaluated directly.Citation10 Additionally, all-cause HCRU among COVID-19 patients was significantly higher than in controls for almost all resource-use categories over the full 6-month follow-up period.Citation11 Costs for the COVID-19 group were also higher than controls for every month of follow-up, and results were statistically significant.
Figure 1. Monthly healthcare utilization, proportion of patients, 6 months following index date: COVID-19 (January 2020–March 2021)* vs. controls (2018–2019)** [Adapted from: DeMartino, 2022Citation11]. Abbreviations. CDC, Centers for Disease Control and Prevention; ED, emergency department; ICD-10-CM, International Classification of Diseases 10th Revision, Clinical Modification. *Claims with COVID-19 diagnoses using the ICD-10-CM code U07.1, introduced on April 1, 2020. For claims between January 1, 2020, and March 31, 2020, ICD-10-CM code for “other coronavirus as the cause of diseases classified elsewhere” (B97.29) was used to identify patients with COVID-19, per CDC recommendations. Categories are not mutually exclusive; hence the sum of proportions may exceed 100%. The index date was the date of diagnosis. **Controls represent individuals who had no record of COVID-19, personal history of COVID-19, or pneumonia caused by COVID-19. The control group’s healthcare usage was analyzed during the year 2019, which was before the pandemic, and their index date was set as 1 year prior to the index date of their matched COVID-19 patient, i.e. the first observed diagnosis of COVID-19. Data presented are the proportion of patients with claims associated with hospitalization, intubation or ventilation, emergency department, outpatient visit, mental health visit, and/or rehabilitation. Absence of a colored segment denotes data was zero or negligibly small for that variable. For example, the segment for intubation or ventilator use appears missing because of extremely small values.
![Figure 1. Monthly healthcare utilization, proportion of patients, 6 months following index date: COVID-19 (January 2020–March 2021)* vs. controls (2018–2019)** [Adapted from: DeMartino, 2022Citation11]. Abbreviations. CDC, Centers for Disease Control and Prevention; ED, emergency department; ICD-10-CM, International Classification of Diseases 10th Revision, Clinical Modification. *Claims with COVID-19 diagnoses using the ICD-10-CM code U07.1, introduced on April 1, 2020. For claims between January 1, 2020, and March 31, 2020, ICD-10-CM code for “other coronavirus as the cause of diseases classified elsewhere” (B97.29) was used to identify patients with COVID-19, per CDC recommendations. Categories are not mutually exclusive; hence the sum of proportions may exceed 100%. The index date was the date of diagnosis. **Controls represent individuals who had no record of COVID-19, personal history of COVID-19, or pneumonia caused by COVID-19. The control group’s healthcare usage was analyzed during the year 2019, which was before the pandemic, and their index date was set as 1 year prior to the index date of their matched COVID-19 patient, i.e. the first observed diagnosis of COVID-19. Data presented are the proportion of patients with claims associated with hospitalization, intubation or ventilation, emergency department, outpatient visit, mental health visit, and/or rehabilitation. Absence of a colored segment denotes data was zero or negligibly small for that variable. For example, the segment for intubation or ventilator use appears missing because of extremely small values.](/cms/asset/bb0cad40-7ce1-4a5e-95a6-36e4884b88c1/ijme_a_2309835_f0001_c.jpg)
A report from the Peterson-Kaiser Family Foundation (KFF) Health System Tracker using 2020 Marketscan data of patients with large employer coverageCitation13 found that hospital admissions for COVID-19 were typically longer than other admissions without a COVID-19 diagnosis, with an average stay of 7 days compared with 4 days for other admissions among patients without a COVID-19 diagnosis. Other studies have reported length of stay (LOS) values of up to 10 days for COVID-19.Citation14 Additional characteristics such as vaccination, treatment, and demographic or clinical profile may impact the LOS.Citation15,Citation16 The average total cost (i.e. the cost paid by the plan and the enrollee) of COVID-19–related hospitalization was $41,611 among enrollees with employer-sponsored insurance in 2020.Citation13 The average total costs were $26,952 for patients that did not require an ICU stay and $65,569 for those needing intensive care. Approximately 38% of COVID-19-related hospitalizations required ICU utilization.Citation13 The average out-of-pocket spending for an inpatient admission ranged from $1,219 for those without an ICU stay and with no cost-sharing to $1,966 in patients with an ICU stay and with cost-sharing.
In 2020, there were temporary waivers of out-of-pocket costs for COVID-19 hospitalizations by private insurers and employers, which were aimed at reducing the financial burden on individuals and families during the pandemic as over 20 million people lost their job and many had reduced working hours and income.Citation17 These waivers were discontinued in 2023, and therefore individuals and payors, including employer-sponsored healthcare plans, will now be responsible for paying out-of-pocket costs associated with their hospitalization.Citation18
Non-medical impact of COVID-19: workplace productivity loss
In addition to the direct health consequences for employees, COVID-19 has had a major economic impact on employers. Strategies implemented to contain the spread of the disease, such as business closure policies, and the increased absenteeism due to COVID-19 brought to the surface the financial fragility of many businesses.
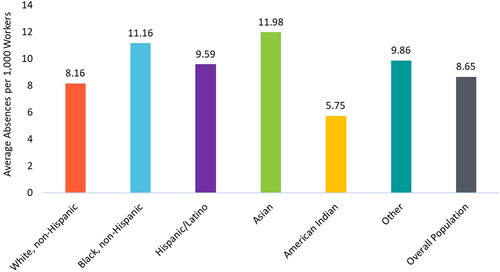
Absenteeism due to COVID-19 caused important reductions in labor supply. As many as 12 per 1,000 workers were found to have a week-long health-related absence due to COVID-19 between 2020 and 2021, an increase of 75% overall compared to pre-pandemic week-long health-related absences.Citation19,Citation20 The average number of absences was larger for Hispanic, Asian, and non-Hispanic Black workers compared with White or American Indian workers ().Citation20 Administrative data related to the unemployment insurance (UI) system reflect employment history and make it possible to have a cumulative measure to assess labor market health. In a study that collected data for Californian workers from March 2020 to March 2021,Citation21 31% of the California workforce applied for UI benefits and over 46% of recipients received benefits for more than 6 months, defined as long term unemployment by the Bureau of Labor Statistics (BLS). The Coronavirus Aid, Relief and Economic Security Act (CARES) offered extended unemployment benefits beyond the pre-pandemic maximum of 26 weeks. The mean unemployment insurance duration ranged from 24.8 for Hispanic/Latino workers to 29.2 weeks for non-Hispanic Black workers. For context, the mean duration in 2023 was 14.5 weeks.Citation22 These findings demonstrate the impact of COVID-19 on business but also reveal the larger effect on some racial/ethnic groups.
Figure 2. Total average number of week-long health-related absences (March 2020 to December 2021) per 1,000 employed workers.Citation20 Average number of absences per 1,000 employed workers. Duration of absence is unknown.
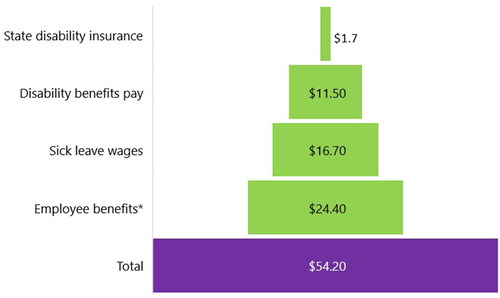
The Integrated Benefits Institute (IBI) analyzed data through June of 2021 for 13 million employed COVID-19 patients. The estimated cost of missed work to employers was $54.2 billion (),Citation5 which translates to $4,169 per COVID-19 case. Employee benefits, such as health insurance, retirement, and unemployment accounted for $24.4 billion of these costs. Disability benefit pay contributed $11.5 billion and sick leave wages accounted for $16.7 billion.Citation5 These findings highlight the impact of COVID-19 on businesses and the need for strategies to mitigate these costs. In another IBI report, the total lost work hours due to COVID-19 were estimated to be 6.6 billion as of January 2023, amounting to about $213.1 billion based on data from over 1,800 US-based employers.Citation4
Figure 3. Paid leave costs and lost wages for employers resulting from illness due to COVID-19 (in billions).Citation5 Employee benefits include health insurance, retirement, unemployment, etc. Disability insurance payments are specific to California and New York. Total represents the sum of all the categories above.
In addition to increased time away from work (absenteeism), the pandemic further burdened the US workforce by reduced productivity due to working while sick (presenteeism) as well as driving lay-off or working hour reductions. The ability to work remotely may also disproportionately benefit white-collar workers, who could continue working through illness, compared with essential workers, who would be required to take time away from work.Citation23
Among a general population of employed adults in the US who missed work, 20% of the absences were due to testing positive for COVID-19, and up to 26% of uninfected workers took time off to quarantine because of known exposure in a period of 3 months in 2022.Citation24 As many as 42% of US employees had to take time away from work to care for their hospitalized loved ones from December 2021 through February 2022.Citation24 In a 2023 CDC evaluation of US adults testing positive for COVID-19 since December 2020 from the Innovative Support for Patients with SARS-CoV-2 Infections Registry (INSPIRE), approximately 31% of individuals reported symptoms at 6 months following a positive test result and 18% at 12 months.Citation25
During the pandemic period from March 2020 to December 2021, absences due to COVID-19 resulted in an earnings loss of at least $9,000 per absence in multiple industries of labor supply in the US, which accounted for about 18% of the workers’ earnings.Citation20 Job loss due to business closure or reduced hours due to COVID-19 concerns was estimated to be about 13% as of February 2022 in the adult population of the USCitation24 and percentages as high as 49% have been reported for those who have experienced hospitalization due to COVID-19 in the earlier phases of the pandemic (August 2020 through January 2021).Citation26 For context, the unemployment rate in the US in 2019 was 3.6%, with 21.5% of the unemployed being long-term, defined as jobless for 6 months or more.Citation27 The impact of the COVID-19 pandemic on benefit leaves and lost wages for workers in the US was particularly evident for low-wage and Hispanic, Asian, and non-Hispanic Black workers as well as for those without access to paid sick leave (PSL).Citation19,Citation21
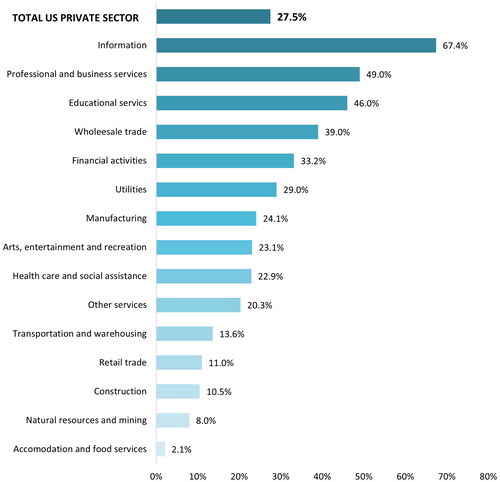
The ability to work from home is noted to be a protective factor against job loss and business closure as well as time away from work.Citation28–30 Approximately one-fourth of US workers were able to work from home at least part of the time in 2022, though this varies by industry ().Citation23
Figure 4. Ability to work from home some or all of the time, private US establishments, 2022. Data derived from a 2022 Bureau of Labor Statistics report.Citation23
Observed work-from-home percentages in the US also differed by race/ethnicity, with White workers more commonly able to work from home than Hispanic/Latino workers or Black workers (60% vs. 18% and 9%, respectively).Citation19 Furthermore, those with lower salaries were away from work more frequently for both illness and quarantine,Citation24 which may coincide with essential work and increased exposure as well as a limited ability to work from home. In a study evaluating data from the US Bureau of Economic Analysis and Bureau of Labor Statistics, it was found that industries with a high work-from-home intensity were less impacted by COVID-19, as indicated by within-industry productivity effects.Citation31 Productivity effects also varied by industry, with manufacturing representing the most stable industry over 2020.Citation31
Impact of COVID-19 vaccination on productivity
In addition to increased absenteeism, the increased ability to work remotely has resulted in issues of presenteeism. A study of US outpatients diagnosed with COVID-19 found that patient-reported absenteeism and work productivity loss and activity impairment were higher for unvaccinated individuals compared to individuals who received the BNT162b2 vaccine against COVID-19 ().Citation32 Additionally, those vaccinated were found to recover faster when comparing the presence of symptoms over time with an average of 2.5 vs 3.7 symptoms at 4 weeks, respectively. In this study, productivity was assessed using the Work Productivity and Activity Impairment questionnaire, which estimates the percentage changes in work productivity and activities outside of work during the past 7 days through four domains: absenteeism, presenteeism, overall work impairment, and impairment of non–work-related activities.Citation32 Scores are presented as an average percentage of time lost during a week.
Figure 5. Mean Work Productivity and Activity Impairment questionnaire scores by vaccination status: general health due to COVID-19 (%) (Adapted from DiFusco, 2022Citation32)
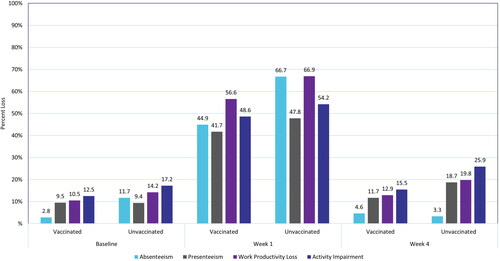
The first week following diagnosis was the most impacted for both the vaccinated and unvaccinated groups, with the highest impairment in work productivity loss (56.6% and 66.9%, respectively). None of the assessed domains returned to baseline at week 4 in either group. Results over the course of the study are presented in . A 6-month follow-up study assessing the impact of long COVID, measured as presence of self-reported COVID-19 symptoms beginning on week 4 following diagnosis, for vaccinated, boosted, and unvaccinated cohorts was also conducted.Citation33 The study found that work productivity loss and activity impairment increased relative to baseline over the entire 6-month period for all groups. Those who were unvaccinated had the greatest average work productivity loss (36.6%) and activity impairment (40.6%) compared to those who received the primary series (27.4% and 33.7%, respectively).Citation33
Industry-specific impacts of COVID-19
The impact of COVID-19 on different occupational groups has been an area of increasing interest during the pandemic. The impact of COVID-19 on healthcare workers has been well described because they are at a high risk of infection as a result of increased exposure to individuals infected with COVID-19. However, a study of workers in California has indicated that COVID-19-related mortality is higher in other occupational industries, such as construction, material moving, and agriculture ().Citation34,Citation35 In another study, approximately 9% of employees of the aerospace and defense industry who were required to work on-site had to take time off from work because of COVID-19 illness in the period of March to August 2020.Citation14 It is therefore possible that people working in nonhealthcare fields may also have a high risk of exposure to COVID-19 yet be less likely to utilize strategies to protect against and/or treat COVID-19. It is also possible that additional employment-related variables such as implementation of mitigation measures, PSL, and ability to work from home may contribute to exposure to illness and subsequent mortality rates.
Figure 6. COVID-19-related mortality (per 100,000 workers) among selected occupations in California (2020).Citation34 Nine select occupational groups with mortality rates higher than the overall of 30 per 100,000 along with values for healthcare support workers. Healthcare Support included the following occupations: nursing, psychiatric, and home health aides; occupational therapy assistants and aides; physical therapist assistants and aides; massage therapists; dental assistants; medical assistants; medical transcriptionists; pharmacy aides; veterinary assistants and laboratory animal caretakers; phlebotomists; and miscellaneous healthcare support occupations, including medical equipment preparers.
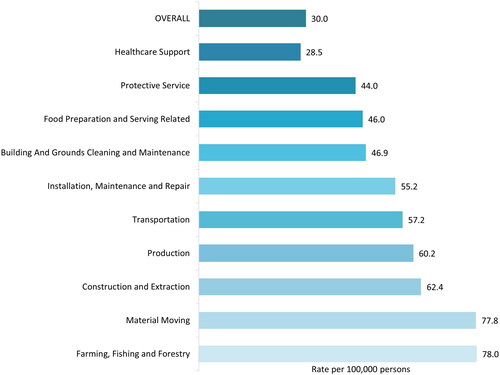
Considering 35% of COVID-19 hospitalizations are among individuals of working age,Citation10 this finding suggests a potential need for increased focus support mitigation measures to minimize hospitalizations and work-loss. The impact of COVID-19 on workers of specific sectors, other than those in healthcare occupations is not well documented. COVID-19–related mortality by industry type, such as healthcare, agriculture, and transportation, is outlined in . Data available in the published literature for specific employment sectors is reported in the subsections below.
Healthcare and social assistance
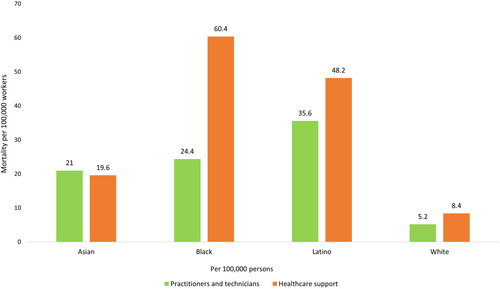
Mortality rates in California-based healthcare professionals indicated a substantial difference in mortality by race and between practitioners and support staff ().Citation34 The mortality rate for Black support staff was seven-fold higher than that for White support staff. Further, the mortality rate for support staff across races was approximately 1.5- to 2.5-fold higher than that of practitioners. This was not true of Asian workers, for whom mortality rates were similar across professions; however, mortality was again higher for Asian workers than that of White workers in either professional category. COVID-19–related hospitalizations and deaths occurred more often among those who were unvaccinated.Citation36
Figure 7. Age-adjusted COVID-19 mortality (per 100,000 workers) by race/ethnicity in healthcare workers among working Californians in 2020.Citation34 Healthcare support included the following occupations: nursing, psychiatric, and home health aides; occupational therapy assistants and aides; physical therapist assistants and aides; massage therapists; dental assistants; medical assistants; medical transcriptionists; pharmacy aides; veterinary assistants and laboratory animal caretakers; phlebotomists; and miscellaneous healthcare support occupations, including medical equipment preparers.
Healthcare workers with milder cases (i.e. non-hospitalized) of COVID-19 in New York reported a median of 15 days away from work (range: 7 to 73 days) following diagnosis.Citation37 More broadly, US-based healthcare workers in 2020 typically experienced an average of 13 days away from work after being diagnosed with COVID-19.Citation38
Agriculture, forestry, fishing, and hunting
As noted above, those working in agricultural industries may be subject to higher severity COVID-19. A cross-sectional analysis of California Department of Public Health death record data found overall mortality due to COVID-19 in California to be higher for those in farming, fishing, or forestry careers. The mortality in 2020 (pandemic vs. pre-pandemic) was found to be 1.52-fold higher than normal for this industry in a study of over 350,000 total workers.Citation39 A cross-sectional study of 729,293 US agricultural workers estimated up to 0.18% of workers may have died, which is equivalent to 1.8 out of every 1,000 workers died between March 2020 to March 2021, depending on subindustry.Citation35 Differences have also been observed in the proportions of hospitalizations (34.7% vs 57.6%), LOS greater than 48 hours (47.1% vs 64.8%), and use of mechanical ventilation (8.2% vs 11%) among COVID-19 positive agricultural workers with and without meatpacking exposure presenting to the emergency department; however, reports of these outcomes are based on small sample sizes.Citation40
Transportation and warehousing
Transit workers in NYC and California experienced high mortality rates during the pandemic.Citation34,Citation39,Citation41 Mortality due to COVID-19 for transit workers was estimated to be <0.5% between March 2020 and March 2021 from a pooled analysis of workers who were members of either the Amalgamated Transit Union (ATU) or Transport Workers Union (TWU). Out of the total decedents, 22 were identified as members of the ATU, and 96 were identified as members of the TWU. It was reported that the ATU had 9,374 members in the NYC metro area, while the TWU had 37,700 members. Based on these figures, mortality attributable to COVID-19 amongst transit workers was estimated to range between 0.20% and 0.30% from March 2020 to March 2021. Additionally, NYC transit workers required mechanical ventilation more often (47% among hospitalized workers, 7% overall). In California, excess mortality, measured as the ratio between the pandemic period and the pre-pandemic period, was about 1.47Citation41 and was higher for Black or Latino transportation or logistics workers than for White workers.
Learnings from influenza and other respiratory symptoms
The employer-specific literature related to COVID-19 was limited, and very few studies reported outcomes related to industry sectors. Because of the reduced severity of recent COVID-19 variants and increasing immunity, findings of studies evaluating influenza and other respiratory illnesses with similar symptoms may be of use when projecting future costs due to COVID-19 for employers.Citation42
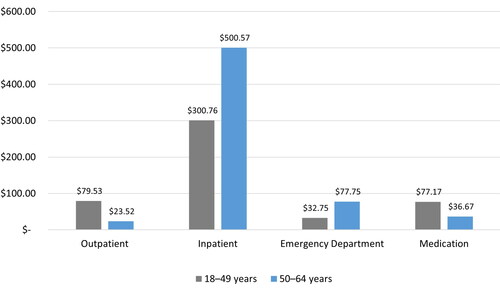
In a cost-of-illness analysis of the general US population aged 0 to 100 years in 2015, there were an estimated 26.2 million cases of influenza.Citation43 In the working-aged group (18 to 64 years), there were far more physician office-based outpatient visits and emergency department (ED) visits (1,384,781 and 189,466, respectively) compared to hospitalizations (66,557). Most hospitalizations (62%) and ED visits (70%) were among those aged 50 years and older, while most office-based outpatient visits (77%) were among those under 50 years. Those aged under 50 years spent more on outpatient visits and medications compared with their counterparts aged 50+ years. The average total cost, encompassing medical costs and lost productivity costs related to absenteeism from paid employment, for the group aged 50 to 64 years was found to be $638.5 million compared to $490.2 million for those aged 18 to 49 years ().Citation43
Figure 8. Impact of flu on total medical costs by age from Putri 2018Citation43 (millions of $).
An analysis of data from the Survey of Occupational Injuries and Illnesses estimated that workers in 2020 missed a median of 14 days away from work because of respiratory illness,Citation44 and approximately 58% of workers missed a total of 11 to 20 days of work in the calendar year. Further, an analysis of data from clinical laboratories in the US indicates the prevalence of influenza in 2020 dropped significantly following behavioral measures implemented to reduce the transmission rate of COVID-19, such as social distancing and masking.Citation45 Because of the overlap with the initial phase of the COVID-19 pandemic, the time away from work is unlikely to be primarily driven by influenza-like illnesses. It is also possible that the time away from work is inflated due to the mandatory quarantine put in place as a public health measure to control COVID-19 cases. In a pre-pandemic survey evaluating time away from work due to cough or cold, it was found that 47% of adult respondents to The United States Attitudes of Consumers Toward Health, Cough, and Cold survey in 2012 missed only 1 day of work or school per each episode of illness, 33% missed 2 days, and the remaining 20% missed 3 or more days.Citation46 Based on these findings, the average absenteeism was estimated to be 15.3 hours per cough or cold episode. On the other hand, presenteeism during infection with influenza-like illness was found to be 92% among a study of 2,886 healthcare providers in 2017.Citation47 It is to be noted that the assessment of presenteeism in this study was based on a binary “yes” or “no” response to the question, “Did you attend work while experiencing any of the symptoms mentioned above?”
Similar to COVID-19, there is little information regarding the impact of influenza and other respiratory infections on specific industry sectors. In a study of 15,933 working adults from multiple industries who completed the National H1N1 Flu Survey in 2010, 48.9% of workers with influenza-like illness and access to PSL sought treatment compared with only 30.7% of those without PSL.Citation48 In this study, occupation was associated with having or not having PSL benefits. The category of farm/blue collar occupations, which includes farming, fishing, and forestry; construction and extraction; and installation, maintenance, and repair, had a lower percentage of workers with PSL than other white-collar occupations (36% vs. 72%, respectively). Offering PSL is a driver for employees to seek care for treatment of symptoms, and a way to prevent working while sick and potentially infecting coworkers contributing to overall absenteeism within the workplace. A cost analysis of 7 years of influenza data from the Medical Expenditure Panel Survey estimated that offering PSL to employees reduced absenteeism costs, saving between $0.63 billion and $1.88 billion per year.Citation49 In a 2021 report, it was reported that the average annual cost of influenza to employers is approximately $15 billion.Citation50 These productivity loss estimates were calculated based on CDC influenza data and the employment-to-population ratio in the US along with the average hourly wage applied to four lost 8 hour shifts. According to the 2018 report released by Challenger, Gray & Christmas, Inc. (a global outplacement and executive coaching firm), the estimated wages lost due to missing four 8-h shifts during influenza season was $855.68 and the total cost to employers was estimated to be over $21 billion.Citation51
Discussion
This review aimed to identify the economic burden on employers and employees due to COVID-19 as it shifts into an endemic state with existing respiratory illness. Findings indicate that respiratory illnesses, including COVID-19, influenza, and other respiratory pathogens, impact the US workforce in a variety of ways, including time away from work due to illness, quarantine, and reduced performance related to working while not feeling well. Severe outcomes of COVID-19 result in economic burden from both a worker and employer perspective. In the reviewed literature, COVID-19 related HCRU was driven by outpatient utilization and medical costs were driven by hospitalization. Data were derived from a time when some private insurers were waiving out-of-pocket costs and symptoms were more severe because of SARS-CoV-2 variant type and lack of vaccine availability, treatments, and natural immunity. Now that costs for vaccinations, testing, and medications, are no longer waived, it is expected that the cost burden to employees will increase. Further, with the end of the public health emergency, it is likely there will be an increased cost burden to employers in the US, as costs previously covered by the government will shift to the employer.Citation52
The estimated time away from work due to COVID-19 is high, given public health isolation policies and recommendations. At the beginning of the pandemic, those experiencing COVID-19 symptoms or who were in contact with someone with symptoms were required to remain in quarantine for at least 14 days. There were also numerous travel restrictions, which resulted in mandatory quarantine if travel was necessary. These combined factors led to extended time to return to work. Employers that offer flexibility with respect to remote work may be less impacted. Alternately, limited sick time or inability to work from home may promote presenteeism, working when ill, or working while contagious but asymptomatic, which may induce further infections among coworkers.
The total estimated cost of the COVID-19 pandemic to employers is about $213.1 billion as of January 2023Citation4 and is still rising, while the average annual cost of influenza to employers is reported to be $15 billion.Citation50 The costs to individual employers depend upon various factors within their covered population, such as comorbidities, vaccination status, access to treatment, employment industry, race/ethnicity, income level, and circulating variants. Symptom burden and work and activity impairment can continue for six months or longer following COVID-19 diagnosis.Citation32,Citation33 Given limited information related to the impact of long COVID specifically on economic burden, there is no clear indication on how long COVID may impact employers and employees. Prevention of COVID-19 cases will be instrumental in helping to reduce the impact of long COVID on productivity. Vaccination along with timely access to outpatient treatment for COVID-19 may help patients avoid more severe outcomes.Citation53 In addition, antiviral drugs have received FDA approval for the treatment of COVID-19 in certain adults and have been found to be effective at preventing severe outcomes and reducing the duration of illness.Citation54,Citation55
We encountered several limitations in this review. Most notably, there was significant heterogeneity in study measures, timepoints, and study design among the sparse data reported from employers’ perspective. Certain caveats are inherent to some of the data used to inform the review. Misclassification bias was likely impactful for retrospective analyses from the beginning of the pandemic: COVID-19 cases that occurred before April 2020 may have been underreported or miscoded in claims data due to the absence of a specific ICD-10-CM diagnosis code for COVID-19 prior to April 1, 2020. In addition, data related to the impact of long COVID in these populations has not been widely reported so it is hard to predict what long-term economic burden might look like from an employee and worker perspective for those with long COVID. It is also important to note that historical costs presented in this review are likely to change based on the evolving landscape. For example, increased operating costs for employers in specific sectors such as costs associated with providing personal protective equipment, additional cleaning supplies, plexiglass installation, etc., were not considered.
There were limited published articles reporting economic data from the worker or employee perspective, especially for individual employment sectors. The review was subsequently expanded via targeted searches to include grey literature relevant to influenza to help fill data gaps. It is difficult to draw meaningful conclusions on the comparison of the COVID and influenza populations because no studies directly assessed both. Publications reporting data for influenza covered various time frames and reported outcomes which were either defined differently or measured differently which complicates indirect comparisons of COVID-19 and influenza from the employer perspective. Due to these limitations, real-time monitoring of health trends and work impairment would be beneficial to employers to understand how employees and their employers are affected by respiratory illnesses such as COVID-19 and influenza in order to mitigate illness and economic burden through workplace policies, communications, and access to timely and appropriate therapies for prevention and treatment.
It is well established that there can be skepticism and reluctance from employees to receive the vaccination.Citation56 Employers can play a critical part in encouraging vaccination as part of employees’ responsibility to help reduce workplace risk. It is key for employees to understand that vaccinations will not only reduce risk, but also reduce symptom burden, allowing them to come back to work earlier or avoid missing work.Citation57 Educating all employees about the importance of vaccination alongside early treatment for employees with an increased risk for severe disease may reduce the burden of COVID-19 for employers.Citation25,Citation58 Employers may benefit from a data-driven approach to workplace policy implementation, targeted communications, and healthcare benefit decisions.
Transparency
Declaration of financial/other relationships
HS, JJ, JAG, AY, DM, MD, ASC, KMA, LN, and SL are employees and shareholders of Pfizer Inc. KS and CR are employees of Evidera, a Thermo Fisher Scientific Company, who have been contracted by Pfizer Inc. Peer reviewers on this manuscript have received an honorarium from JME for their review work but have no other relevant financial relationships to disclose.
Author contributions
All authors contributed to the design and execution of the research as well as the writing and revision of the manuscript.
Supplemental Material
Download MS Word (31.9 KB)Acknowledgements
No assistance in the preparation of this article is to be declared.
Reviewer disclosure statement
Peer reviewers on this manuscript have no relevant financial or other relationships to disclose.
Additional information
Funding
References
- Flaxman S, Whittaker C, Semenova E, et al. Assessment of COVID-19 as the underlying cause of death among children and young people aged 0 to 19 years in the US. JAMA Netw Open. 2023;6(1):e2253590-e2253590. doi: 10.1001/jamanetworkopen.2022.53590.
- Ahmad FB, Cisewski JA, Xu J, et al. Provisional mortality data—United States, 2022. MMWR Morb Mortal Wkly Rep. 2023;72(18):488–492. doi: 10.15585/mmwr.mm7218a3.
- Richards F, Kodjamanova P, Chen X, et al. Economic burden of COVID-19: a systematic review. Clinicoecon Outcomes Res. 2022;14:293–307. doi: 10.2147/CEOR.S338225.
- Bonner C. Lost hours and costs attributed to the COVID-19 pandemic. San Francisco (CA): Integrated Benefits Institute; 2023.
- The cost of missed work due to COVID-19 [Internet]. Oakland (CA): Integrated Benefits Institute; 2021 [cited 2023 Nov 8]. Available from: https://www.ibiweb.org/resources/infographic-the-cost-of-missed-work-due-to-covid-19#.
- Kates J, Cox C, Cubanski J, et al. Commercialization of COVID-19 vaccines, treatments, and tests: implications for access and coverage. San Francisco (CA): Kaiser Family Foundation; 2023.
- WHO coronavirus (COVID-19) dashboard [Internet]. Geneva (CH): World Health Organization; 2023 [updated 2023 Mar 29; cited 2023 Mar 16]. Available from: https://covid19.who.int/.
- Kolb JJ, Radin JM, Quer G, et al. Prevalence of positive COVID-19 test results collected by digital self-report in the US and Germany. JAMA Netw Open. 2023;6(1):e2253800-e2253800. doi: 10.1001/jamanetworkopen.2022.53800.
- Rates of COVID-19 Cases or Deaths by Age Group and Vaccination Status [Internet]. Atlanta (GA): US Department of Health and Human Services; 2023 [updated 2023 Mar 30; cited 2022 Nov 7]. Available from: https://data.cdc.gov/Public-Health-Surveillance/Rates-of-COVID-19-Cases-or-Deaths-by-Age-Group-and/3rge-nu2a/about_data.
- New admissions of patients with confirmed COVID-19, United States [Internet]. Atlanta (GA): US Department of Health and Human Services; 2023 [updated 2023 Aug 19; cited 2023 Aug]. Available from: https://covid.cdc.gov/covid-data-tracker/#new-hospital-admissions.
- DeMartino JK, Swallow E, Goldschmidt D, et al. Direct health care costs associated with COVID-19 in the United States. J Manag Care Spec Pharm. 2022;28(9):936–947. doi: 10.18553/jmcp.2022.22050.
- Post COVID-19 condition (long COVID) [Internet]. World Health Organization; 2022 [cited 2023 Dec 5]. Available from: https://www.who.int/europe/news-room/fact-sheets/item/post-covid-19-condition.
- Wager E, Claxton G, Amin K, et al. Cost of COVID-19 hospital admissions among people with private health coverage. Peterson center on healthcare and kaiser family foundation health system tracker. San Francisco (CA): Peterson-KFF Health System Tracker; 2022.
- Haigh KZ, Gandhi M. COVID-19 mitigation with appropriate safety measures in an essential workplace: lessons for opening work settings in the United States during COVID-19. Open Forum Infect Dis. 2021;8(4):ofab086.
- Lee SW, Ma D, Davoodian A, et al. COVID-19 vaccination decreased COVID-19 hospital length of stay, in-hospital death, and increased home discharge. Prev Med Rep. 2023;32:102152. doi: 10.1016/j.pmedr.2023.102152.
- Sanyaolu A, Okorie C, Marinkovic A, et al. Comorbidity and its impact on patients with COVID-19. SN Compr Clin Med. 2020;2(8):1069–1076. doi: 10.1007/s42399-020-00363-4.
- Statistics USBoL. Labor Market Dynamics during the COVID-19 Pandemic 2022. Available from: https://www.bls.gov/blog/2022/labor-market-dynamics-during-the-covid-19-pandemic.htm#:∼:text=The%20U.S.%20labor%20market%20experienced,the%20survey%20began%20in%201939.
- Ortaliza J, Rae M, Amin K, et al. Most private insurers are no longer waiving cost-sharing for COVID-19 treatment. Peterson center on healthcare and kaiser family foundation health system tracker. San Francisco (CA): Peterson-KFF Health System Tracker; 2021.
- Angelucci M, Angrisani M, Bennett DM, et al. Remote work and the heterogeneous impact of COVID-19 on employment and health. Cambridge (MA): National Bureau of Economic Research; 2020.
- Goda GS, Soltas EJ. The impacts of COVID-19 illnesses on workers (NBER working paper no. 30435). Cambridge (MA): National Bureau of Economic Research; 2022.
- Bell A, Hedin TJ, Mannino P, et al. Estimating the disparate cumulative impact of the pandemic in administrative unemployment insurance data. AEA Pap Proc. 2022;112:78–84. doi: 10.1257/pandp.20221008.
- Labor USDo. Unemployment Insurance Data. 2023.
- Employees teleworked at least some of the time at 27.5 percent of private establishments in 2022 [Internet]. Washington (DC): U.S. Bureau of Labor Statistics; 2023 [updated 2023 Apr 19; cited 2023 Nov 7]. Available from: https://www.bls.gov/opub/ted/2023/employees-teleworked-at-least-some-of-the-time-at-27-5-percent-of-private-establishments-in-2022.htm.
- Kirzinger A, Sparks G, Hamel L, et al. The pandemic’s toll on workers and family finances during the omicron surge. Kaiser family foundation (KFF) COVID-19 vaccine monitor. San Francisco (CA): Kaiser Family Foundation; 2022.
- Montoy JCC, Ford J, Yu H, et al. Prevalence of symptoms </=12 months after acute illness, by COVID-19 testing status among adults – United States, December 2020-March 2023. MMWR Morb Mortal Wkly Rep. 2023;72(32):859–865. doi: 10.15585/mmwr.mm7232a2.
- Iwashyna TJ, Kamphuis LA, Gundel SJ, et al. Continuing cardiopulmonary symptoms, disability, and financial toxicity 1 month after hospitalization for third-wave COVID-19: early results from a US nationwide cohort. J Hosp Med. 2021;18:531–537.
- TED: The Economics Daily Unemployment rate was 3.6 percent in October 2019 [Internet]. Washington (DC): U.S. Bureau of Labor Statistics; 2019 [cited 2023 Dec 6]. Available from: https://www.bls.gov/opub/ted/2019/unemployment-rate-was-3-point-6-percent-in-october-2019.htm.
- Couch KA, Fairlie RW, Xu H. The evolving impacts of the COVID‐19 pandemic on gender inequality in the US labor market: the COVID motherhood penalty. Econ Inq. 2022;60(2):485–507. doi: 10.1111/ecin.13054.
- Fabrizio S, Gomes DBP, Tavares MM. COVID-19 she-cession: the employment penalty of taking care of young children (IMF working paper WP/21/58). Washington (DC): International Monetary Fund; 2021. doi: 10.5089/9781513571157.001.
- Garrison ST, Rampold SD, Vasquez K, et al. Parents’ employment, income, and finances before and during the COVID-19 pandemic. J Consum Aff. 2022;56(1):276–291. doi: 10.1111/joca.12443.
- de Vries K, Erumban A, van Ark B. Productivity and the pandemic: short-term disruptions and long-term implications: the impact of the COVID-19 pandemic on productivity dynamics by industry. Int Econ Econ Policy. 2021;18(3):541–570. doi: 10.1007/s10368-021-00515-4.
- Di Fusco M, Sun X, Moran MM, et al. Impact of COVID-19 and effects of BNT162b2 on patient-reported outcomes: quality of life, symptoms, and work productivity among US adult outpatients. J Patient Rep Outcomes. 2022;6(1):123. doi: 10.1186/s41687-022-00528-w.
- Di Fusco M, Sun X, Moran MM, et al. Impact of COVID-19 and effects of booster vaccination with BNT162b2 on six-month long COVID symptoms, quality of life, work productivity and activity impairment during omicron. J Patient Rep Outcomes. 2023;7(1):77. doi: 10.1186/s41687-023-00616-5.
- Cummings KJ, Beckman J, Frederick M, et al. Disparities in COVID-19 fatalities among working Californians. PLoS One. 2022;17(3):e0266058. doi: 10.1371/journal.pone.0266058.
- Lusk JL, Chandra R. Farmer and farm worker illnesses and deaths from COVID-19 and impacts on agricultural output. PLoS One. 2021;16(4):e0250621. doi: 10.1371/journal.pone.0250621.
- Robilotti EV, Whiting K, Lucca A, et al. Clinical and genomic characterization of severe acute respiratory syndrome coronavirus 2 (SARS CoV-2) infections in mRNA vaccinated health care personnel in New York city. Clin Infect Dis. 2022;75(1):e774–e782. doi: 10.1093/cid/ciab886.
- Ganz-Lord FA, Segal KR, Rinke ML. COVID-19 symptoms, duration, and prevalence among healthcare workers in the New York metropolitan area. Infect Control Hosp Epidemiol. 2021;42(8):917–923. doi: 10.1017/ice.2020.1334.
- Chaudhry ZS, Cadet L, Sharip A. Return to work, demographic predictors, and symptomatic analysis among healthcare workers presenting for COVID-19 testing: a retrospective cohort from a United States academic occupational medicine clinic. Cureus. 2021;13(11):e19944. doi: 10.7759/cureus.19944.
- Chen YH, Glymour M, Riley A, et al. Excess mortality associated with the COVID-19 pandemic among Californians 18-65 years of age, by occupational sector and occupation: March through November 2020. PLoS One. 2021;16(6):e0252454. doi: 10.1371/journal.pone.0252454.
- House HR, Vakkalanka JP, Behrens NG, et al. Agricultural workers in meatpacking plants presenting to an emergency department with suspected COVID-19 infection are disproportionately black and hispanic. Acad Emerg Med. 2021;28(9):1012–1018. doi: 10.1111/acem.14314.
- Tomasi SE, Ramirez-Cardenas A, Thiese MS, et al. COVID-19 mortality among amalgamated transit union (ATU) and transport workers union (TWU) workers-March-July 2020, New York city metro area. Am J Ind Med. 2021;64(9):723–730. doi: 10.1002/ajim.23281.
- Coronavirus disease (COVID-19): similarities and differences between COVID-19 and influenza [Internet]. Geneva (CH): world Health Organization; 2021 [cited 2023 Nov 8]. Available from: https://www.who.int/news-room/questions-and-answers/item/coronavirus-disease-covid-19-similarities-and-differences-with-influenza.
- Putri WCWS, Muscatello DJ, Stockwell MS, et al. Economic burden of seasonal influenza in the United States. Vaccine. 2018;36(27):3960–3966. doi: 10.1016/j.vaccine.2018.05.057.
- Survey of occupational injuries and illnesses data [Internet]. Washington (DC): U.S. Bureau of Labor Statistics; 2021 [updated 2021 Jun 4; cited 2023 Aug]. Available from: https://www.bls.gov/iif/overview/soii-overview.htm.
- Olsen SJ, Azziz-Baumgartner E, Budd AP, et al. Decreased influenza activity during the COVID-19 pandemic—United States, Australia, Chile, and South Africa, 2020. MMWR Morb Mortal Wkly Rep. 2020;69(37):1305–1309. doi: 10.15585/mmwr.mm6937a6.
- Dicpinigaitis PV, Eccles R, Blaiss MS, et al. Impact of cough and common cold on productivity, absenteeism, and daily life in the United States: ACHOO survey. Curr Med Res Opin. 2015;31(8):1519–1525. doi: 10.1185/03007995.2015.1062355.
- Mossad SB, Deshpande A, Schramm S, et al. Working despite having influenza-like illness: results of an anonymous survey of healthcare providers who care for transplant recipients. Infect Control Hosp Epidemiol. 2017;38(8):966–969. doi: 10.1017/ice.2017.91.
- Zhai Y, Santibanez TA, Kahn KE, et al. Paid sick leave benefits, influenza vaccination, and taking sick days due to influenza-like illness among U.S. workers. Vaccine. 2018;36(48):7316–7323. doi: 10.1016/j.vaccine.2018.10.039.
- Asfaw A, Rosa R, Pana-Cryan R. Potential economic benefits of paid sick leave in reducing absenteeism related to the spread of influenza-like illness. J Occup Environ Med. 2017;59(9):822–829. doi: 10.1097/JOM.0000000000001076.
- 2021 Flu report: should employers embrace post-pandemic mask-wearing? [Internet]. Chicago (IL): Challenger Gray & Christmas; 2021 [cited 2023 Dec 5]. Available from: https://www.challengergray.com/blog/2021-flu-report-should-employers-embrace-post-pandemic-mask-wearing/
- Update 2: flu season to cost employers $21B [Internet]. Chicago (IL): Challenger Gray & Christmas; 2018 [cited 2023 Nov 8]. Available from: https://www.challengergray.com/blog/update-2-flu-season-cost-employers-21b-2/.
- Cox CKJ, Cubanski J, Tolbert J. The End of the COVID-19 Public Health Emergency: Details on Health Coverage and Access: Kaiser Family Foundation; 2023. Available from: https://www.kff.org/policy-watch/the-end-of-the-covid-19-public-health-emergency-details-on-health-coverage-and-access/.
- Shah MM, Joyce B, Plumb ID, et al. Paxlovid associated with decreased hospitalization rate among adults with COVID-19 – United States, April-September 2022. MMWR Morb Mortal Wkly Rep. 2022;71(48):1531–1537. doi: 10.15585/mmwr.mm7148e2.
- Bajema KL, Berry K, Streja E, et al. Effectiveness of COVID-19 treatment with nirmatrelvir-ritonavir or molnupiravir among U.S. Veterans: target trial emulation studies with one-month and six-month outcomes. Ann Intern Med. 2023;176(6):807–816. doi: 10.7326/M22-3565.
- Lewnard JA, McLaughlin JM, Malden D, et al. Effectiveness of nirmatrelvir-ritonavir in preventing hospital admissions and deaths in people with COVID-19: a cohort study in a large US health-care system. Lancet Infect Dis. 2023;23(7):806–815. doi: 10.1016/S1473-3099(23)00118-4.
- COVID-19 vaccine-reluctant in U.S. likely to stay that way [Internet]. Washington (DC): Gallup; 2021 [cited 2023 Dec 6]. Available from: https://news.gallup.com/poll/350720/covid-vaccine-reluctant-likely-stay.aspx.
- Tofarides AG, Christaki E, Milionis H, et al. Effect of vaccination against SARS-CoV-2 on long COVID-19: a narrative review. Life (Basel). 2022;12(12):2057. doi: 10.3390/life12122057.
- Sah P, Vilches TN, Moghadas SM, et al. Return on investment of the COVID-19 vaccination campaign in New York city. JAMA Netw Open. 2022;5(11):e2243127-e2243127. doi: 10.1001/jamanetworkopen.2022.43127.