
Abstract
Aims
Urea cycle disorders (UCDs) can cause ammonia accumulation and central nervous system toxicity. Nitrogen-binding medications can be efficacious, but certain attributes may negatively impact adherence. This study sought to quantify the administration-related attributes influencing overall prescription selection and patient adherence.
Methods
A web-based, quantitative survey including discrete choice experiment (DCE) methodology captured responses from health care providers for patients with UCDs. A series of hypothetical treatment profile sets with attributes such as route of administration, taste/odor, preparation instructions, packaging, dose measurement, and weight use restrictions were presented. From 16 sets of 3 hypothetical product profiles, respondents evaluated attributes most preferred for prescription selection or patient adherence. Attributes assumed a higher overall preference if relative importance (RI) scores were >16.67% (the value if all attributes were of equal importance). Preference weight scores were assessed. A nine-point Likert scale assessed respondent attitudes, such as satisfaction.
Results
A total of 51 respondents completed the survey. Respondents reported dissatisfaction with current treatments (mean [SD] = 5.4 [1.7]). For prescription selection, four attributes achieved RI >16.67%: taste/odor (24%), weight restrictions (21%), preparation instructions (18%), and route of administration (17%). For adherence, three attributes related to administration achieved RI >16.67%: taste/odor (28%), preparation instructions (21%), and route of administration (17%). Preference weights for “taste/odor masked” were higher than “not taste/odor masked” for prescription selection (mean [SD]; 1.52 [1.10] vs −1.52 [1.10]) and treatment adherence (73.8 [55.2] vs −73.8 [55.2]).
Limitations
This study contained a relatively small sample size. Survey respondent selection, the use of hypothetical product profiles, and exclusion of non-pharmacologic treatment options could have contributed to potential biases.
Conclusions
Among attributes tested, taste/odor was the most important attribute influencing overall preference for both prescribing and patient adherence, with taste/odor masking preferred. Optimizing nitrogen-binding medications through masking taste/odor may support improved patient adherence and outcomes in UCDs.
Introduction
Urea cycle disorders (UCDs) are rare, inherited metabolic disorders caused by a missing or dysfunctional protein in the urea cycle, resulting in the inability to normally convert ammonia to urea for excretionCitation1. With an incidence estimated at 1:35,000 live births, there are approximately 1,100 patients in the United States (US) living with UCDsCitation2,Citation3. If left untreated, patients with UCDs can experience elevations in ammonia and its metabolites that lead to serious central nervous system toxicities, resulting in brain damage and deathCitation2,Citation4–6.
The current standard of care for chronic management of UCDs consists of a low-protein diet that balances nitrogen restriction with growth requirements, along with supplementation with essential amino acid mixtures and L-citrulline or L-arginineCitation2,Citation7. Nutritional interventions alone, however, are insufficient to prevent complications in most patients with UCDs, necessitating the use of nitrogen-binding medications for additional ammonia controlCitation8. Current US Food and Drug Administration (FDA)-approved nitrogen-binding medications for UCD include sodium phenylbutyrate, as either tablets or powder, and glycerol phenylbutyrate, as an oral liquid. All currently approved nitrogen-binding medications for the treatment of UCDs have similar mechanisms of action, with glycerol phenylbutyrate being metabolized to phenylbutyrateCitation5,Citation6,Citation9,Citation10.
Despite the ability of nitrogen-binding medications to reduce ammonia levels, patients with UCDs receiving such pharmaceutical treatment may still experience acute hyperammonemic crises (HACs) that are associated with substantial morbidity, mortality, and costCitation2. Nitrogen-binding medications are generally efficacious when patients receive the appropriate dose on the appropriate schedule, but many patients with UCDs are not adherent with their UCD medicationCitation11,Citation12. Poor treatment adherence can have an adverse impact on outcomes; in one longitudinal interventional study, 25% of HACs in patients with UCDs were precipitated by a lack of adherence to medications and/or dietCitation13.
Because the efficacy of nitrogen-binding medications in UCD therapy requires strict adherence, it is important to determine the key characteristics of nitrogen-binding medications that may influence patient ability to take the medication as prescribed. Previous research identified common reasons for discontinuation from the patient perspective, including poor taste, large amount of medication taken per dose, frequent dosing, and gastrointestinal side effectsCitation11. Health care providers treating patients with UCDs also indicated that palatability of nitrogen-binding medications was a key consideration in prescribing decisions in UCDs and considered the amount of medication taken per dose, difficulty in swallowing the medication, dosing frequency, side effects, and difficultly keeping the medication down as key factors in patient discontinuation of medicationsCitation4,Citation11.
Identifying key treatment characteristics that may improve adherence to treatment with nitrogen-binding medications can inform future research and development and improve the lives of patients living with UCDs. We performed a discrete choice experiment (DCE) among health care providers treating patients with UCDs to analyze their preferences with respect to product attributes, including route of administration, taste and odor, preparation instructions, packaging, requirement to measure doses (i.e. pre-measured vs not pre-measured), and weight use restrictions. Additionally, the DCE sought to quantify the relative importance (RI) perceived by health care providers of these same attributes for patient adherence.
Methods
Recruitment
The study aimed to recruit an equal distribution of dietitians and physicians (board-certified or board eligible), 25 in each group, to a web-based quantitative survey including a DCE (see below). Health care providers in the US were recruited from an online panel and were eligible to participate if they: were in health care practice for 3 to 35 years; spent at least 50% of their time in direct patient care; managed/treated at least 3 unique patients with UCDs in the last 5 years, with at least 1 patient prescribed chronic pharmaceutical management; had primary treatment selection decision-making authority or provided guidance and influenced decisions around treatment selection; have used currently-approved nitrogen-binding medications to treat patients with UCDs (sodium phenylbutyrate or glycerol phenylbutyrate); and were able to read and understand English and provide informed consent. Physicians were additionally required to have a post-residency specialization in metabolic disorders (e.g. clinical biochemical genetics, medical biochemical genetics, or clinical genetics).
Health care providers were excluded if they were affiliated with a pharmaceutical company or contract research organization; medical equipment manufacturer; government agency; market research/advertising firm; Kaiser Permanente, the Kaiser Foundations, or Permanente Medical Group and its affiliates; long-term care facilities; or a Veteran’s Affairs hospital. Government agency members are often restricted from participating in this type of research, and care provided by Veteran’s Affairs, Kaiser Permanente facilities, and long-term care facilities may not be generalizable.
Experimental design
Data were captured via a 30-minute, web-based, cross-sectional quantitative survey containing questions addressing: (1) health care providers’ demographics; (2) UCD disease state attitudes; (3) UCD treatment perceptions and satisfaction; (4) the DCE; and (5) a hypothetical static product profile exercise. Ratings of importance, preference, and unmet need were conducted on a Likert scale from 1 (not at all important/not at all satisfied/low unmet need) through 9 (extremely important/extremely satisfied/high unmet need). Questions assessing disease state attitudes also used a Likert scale from 1 (strongly disagree) through 9 (strongly agree).
All questions within the survey instrument were mandatory for all respondents, and data from participants who did not complete all the assessments were excluded from the analysis. Prior to fielding the survey, two cognitive interviews were conducted with health care providers to examine the overall completeness of the survey and to identify probable areas of response error (Changes to the instrument are logged in Supplemental Table 1). All survey data were blinded and de-identified, and the study received exemption from Institutional Review Board (IRB) oversight from Advarra, an independent IRB (Advarra, Columbia, MD). Participants provided written informed consent and were compensated for their participation according to fair market values.
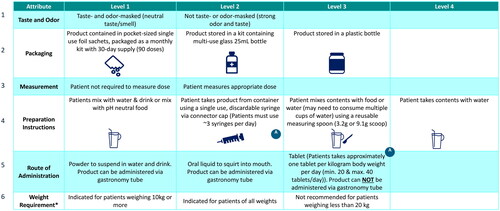
The survey included two exercises to elicit health care provider preference for attributes of nitrogen-binding medications for UCD: a DCE and an assessment of hypothetical static product profiles. Both exercises utilized an identical set of attributes and attribute levels of nitrogen-binding medications for UCDs. Attributes included: route of administration, taste, odor, preparation instructions, packaging, measurement (pre-measured vs not pre-measured), and weight use restrictions (treatment indicated for patients over a certain weight [>10kg, >20kg] or indicated for patients of all weights, presented as “weight requirements”, ).
Figure 1. Discrete choice experiment grid.
The attributes and attribute levels depicted in the grid were shown to respondents in the discrete choice experiment to assess overall preference for treatment and preference for adherence and compliance. A = Attribute 4, Level 2 not shown with Attribute 5, Level 3 due to incompatibility.
*Weight requirement describes restrictions for product use based on patient weight.
Discrete choice experiment
In the DCE, respondents were presented with a series of 16 hypothetical treatment profile sets, each containing three nitrogen-binding medications for UCDs. Each hypothetical treatment profile was described by characteristics (attributes) and options for that characteristic (levels), as outlined in . In order to assess the relative importance (RI) of these attributes and their impact on overall preference for treatment selection, and on patient adherence and compliance, HCPs were shown product profiles with attributes that had orthogonally varying predefined levels within those attributes in a series of questions that elicited respondents’ stated preferencesCitation14. A restriction/prohibition based on incompatible attribute levels was introduced in the case of preparation instructions requiring a syringe and routes of administration not applicable to a syringe. From each set of three medications, respondents first selected the hypothetical treatment profile that they most preferred for overall treatment. Second, respondents selected the hypothetical treatment profile that would be mostly likely to support adherence. Respondents were asked to assume that all hypothetical treatment profile sets had a similar efficacy, mechanism of action, insurance coverage, out of pocket costs for patients, and similar rates and types of adverse events in randomized clinical trials.
Hypothetical static product profile exercise
For the hypothetical static product profile exercise, respondents viewed pre-specified, hypothetical product profiles of treatments for patients with UCDs (Product Profiles X, Y, Z and AA, detail provided in Supplemental Table 2). The static profiles were comprised of attributes and attribute levels consistent with those used in the DCE (described in ) but the profiles remained the same throughout the exercise. The hypothetical product profiles were first shown to respondents comparatively with one other hypothetical product profile side by side. Respondents were then asked which product was preferred, the level of preference (based on a scale from 1 [least preferred] through 9 [most preferred]) and the likelihood of patient adherence (based on a scale, with 0 = not at all adherent/compliant; 1 = moderately adherent/compliant; and 2 = highly adherent/compliant). Respondents were then shown each hypothetical product profile individually and asked to rate their satisfaction with pre-specified attributes of the hypothetical product profile based on a scale from 1 (not at all satisfied) through 9 (extremely satisfied).
Statistical analysis
The DCE conjoint was designed, conducted, and analyzed using Lighthouse Studio 9.8.0 (a Sawtooth software). A hierarchical Bayesian model was used to investigate the respondents’ relative preferences (RI) of UCD treatment attributes in the DCE, consistent with the International Society for Pharmacoeconomics and Outcomes Research guideline for conjoint analysisCitation15. Continuous variables were evaluated using t-tests (mean), and categorical variables were evaluated using chi-squared tests (proportion). An alpha of 0.05 was used for all analyses.
Attributes were considered of higher overall preference among tested attributes if the RI scores were >16.67%. An RI score of 16.67% represents the level of equal preference for all attributes (i.e. the equal distribution of 100% over 6 attributes); therefore, a value greater than 16.67% shows a preference for an attribute. Preference for attribute levels was assessed using mean relative preference weight scores. Differences between the mean relative preference weight scores for the least preferred levels of an attribute and the level associated with a product of interest may be interpreted as preference-based utilities. Using this assumption, preference-based utilities for each attribute can be aligned to chosen hypothetical profiles and an overall preference-based utility score calculated by adding the preference-based utilities for the attribute levels associated with each profile (Product Profile A - D). A relative preference weight of 100% represents an ideal product in UCD treatment (based only on the attributes assessed and assuming that the attribute levels tested cover all possible attributes and levels of treatments). Paired t-tests with Bonferroni correction were used to compare the relative preference weights between hypothetical profiles and between static product profiles.
Results
Respondent demographics and practice setting characteristics
A total of 1,145 health care providers initiated the screener for the online survey, of which 95 (8%) met eligibility criteria and 51 (54%) completed the survey. Simultaneous completion of the survey by 2 dietitians resulted in the inclusion of an additional dietitian in the sample, for a total of 26 dieticians and 25 physicians.
The demographics and characteristics of included health care providers are presented in . The majority of respondents reported being female (51%) and <60 years of age (67%). Health care providers most commonly practiced in teaching hospitals (45%) or office-based (43%) practice settings, in urban areas (51%). The payer mix in health care providers’ practices (independent of UCD status) was reported as mainly private/commercial insurance (53%), with dietitians reporting significantly more patients covered by government plans (52%) compared to physicians (38%, p < 0.05). Physicians were more likely to be the primary decision-makers regarding treatment for patients with UCDs (64%), whereas dietitians were more involved in providing guidance and influence around treatment selection, while not directly initiating treatment (62%).
Table 1. Health care provider demographics and practice setting characteristics.
Current treatment perceptions and satisfaction
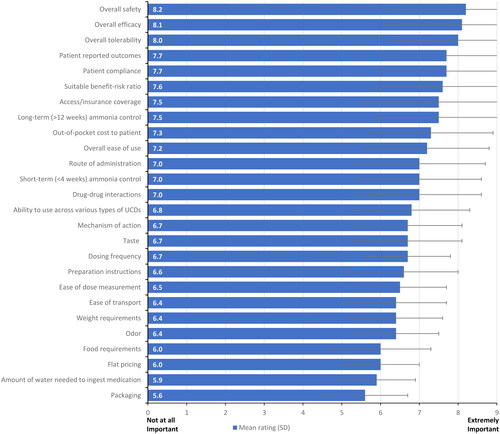
When asked to consider the importance of attributes when selecting a treatment for patients with UCDs, safety (mean [SD] = 8.2 [1.1]), efficacy (8.1 [1.0]), and tolerability (8.0 [1.0]) were rated as the most important attributes (, additional detail provided in Supplemental Table 3), while ease of dose measurement (6.5 [1.3]), preparation instructions (6.6 [1.5]), and mechanism of action (6.7 [1.4]) were viewed as less important.
Figure 2. Product attribute importance rating reported by health care providers.
Respondents were asked to rate the importance of the indicated product attributes for the selection of a nitrogen-binding medication treatment for UCDs using a 9-point Likert scale. Attributes rated on 1–9 scale; 1 = not at all important; 9 = extremely important; error bars show one standard deviation.
Abbreviation. UCD, urea cycle disorder.
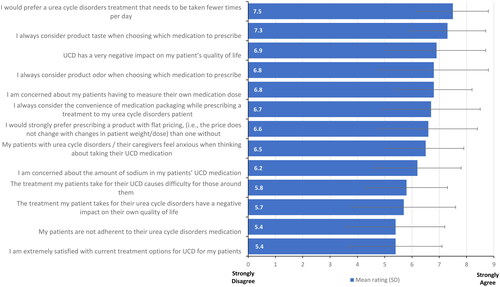
Health care providers also expressed a strong preference for a treatment with fewer daily administrations (mean [SD] = 7.5 [1.3]) and consideration of product taste in their prescription decisions (7.3 [1.4]) (, additional detail provided in Supplemental Table 4). When asked for their agreement with a statement of extreme satisfaction with current treatment options for UCD on a scale of 1–9, with 1 equal to strongly disagree and 9 equal to strongly agree, health care provider responses produced a mean of 5.4 (1.7) (, Supplemental Table 5), with dieticians more likely to express satisfaction with the current therapies (dietitians = 6.0 [1.5]; physicians = 4.8 [1.7]; p = 0.01).
Figure 3. Disease state attitudes reported by health care providers.
Respondents were asked to rate their agreement with the indicated statements regarding existing nitrogen-binding medications for UCDs using a 9-point Likert scale. Attributes rated on 1–9 scale; 1 = strongly disagree; 9 = strongly agree; error bars show one standard deviation.
Abbreviation. UCD, urea cycle disorder.
Discrete choice experiment
Attribute preference
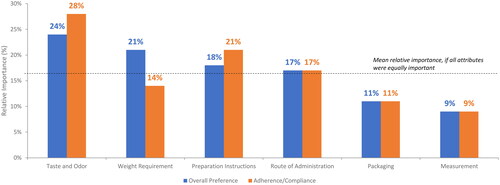
The mean RI scores for overall treatment preference and treatment adherence and compliance from the DCE are presented in . For overall treatment preference, four attributes were considered of higher-than-average preference (i.e. a RI score greater than 100 divided by the 6 attributes [>16.67%]) among the tested attributes. Taste and odor emerged as the most important attribute (RI: 24%), with health care providers showing a strong preference for taste and odor masked treatments. Health care providers also placed greater importance on weight use restrictions (21%), preparation instructions (18%), and route of administration (17%). When considering treatment adherence and compliance, three attributes were associated with higher preference. Taste and odor emerged as the most important attribute (28%). Health care providers also placed importance on preparation instructions (21%) and route of administration (17%).
Figure 4. Drivers of product overall preference and product adherence and compliance.
The bar graph shows the results from the discrete choice experiment for overall preference and adherence and compliance by attribute. The dotted line represents the level anticipated if all attributes were of equal importance (i.e., 100 divided by the number of attributes).
Attribute levels preference
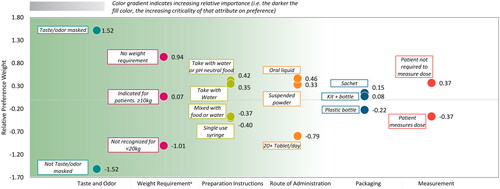
The mean relative preference weight scores for attribute levels for overall treatment preference are presented in (additional detail provided in Supplemental Table 5). For overall treatment preference across the attributes, the most preferred levels (in order of highest-ranking attribute) were taste and odor masked, no weight use restrictions, taking medication with water or pH neutral foods, oral liquid formulation, sachet packaging, and patient not required to measure the dose. Notably, taste/odor masked was relatively more preferred than not taste/odor masked (mean [SD]; 1.52 [1.10] versus −1.52 [1.10]), and no weight use restriction was relatively more preferred (0.94 [0.76]) than having weight use restrictions of less than 20 kg (-1.01 [0.80]) or weight use restriction of 10 kg or more (0.07 [0.58]).
Figure 5. Mean relative preference weights for overall treatment preference.
The chart shows the results from the discrete choice experiment for levels within each attribute for overall preference. Attributes are found along the x-axis, relative preference weights are on the y-axis, and colored dots show relative preference weights for specific attribute levels. The green gradient background reflects the overall importance of the attributes, with attributes ordered from most important to least important, left to right (see also ).
*In the context of individual attribute levels, attribute refers to weight restrictions rather than weight-based dosing.
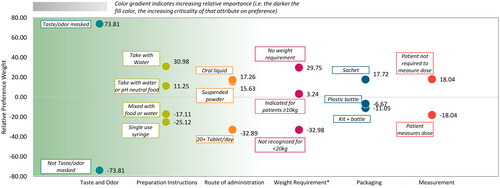
For overall treatment adherence and compliance across the attributes, the most preferred levels (in order of highest-ranking attribute) were taste and odor masked, taking medication with water, oral liquid, no weight restrictions, sachet packaging, and patient not requiring measuring the dose (, additional detail provided in Supplemental Table 6). Taste/odor masked was relatively more preferred than not taste/odor masked (mean [SD]; 73.8 [55.2] versus −73.8 [55.2]), and preparation instructions to take contents with water (31.0 [41.9]) was relatively more preferred than mixing contents with water or pH neutral food (11.2 [47.8]); single use, discardable syringe (-25.1 [68.4]); or mixing content with food or water and potentially having to drink multiple glasses of water (-17.1 [37.8]).
Figure 6. Mean relative preference weights for treatment adherence and compliance.
The chart shows the results from the discrete choice experiment for levels within each attribute for treatment adherence and compliance. Attributes are found along the x-axis, relative preference weights are on the y-axis, and colored dots show relative preference weights for specific attribute levels. The green gradient background reflects the overall importance of the attributes, with attributes ordered from most important to least important, left to right (see also ).
*In the context of individual attribute levels, attribute refers to weight restrictions rather than weight-based dosing.
Preference-based treatment utility
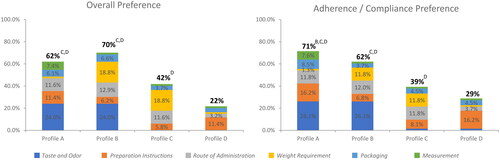
Preference-based treatment utilities were used to calculate dosing and administration scores for four product profiles that align closely with currently available products (see for profiles). Based on the sum of normalized attribute level preference weights across all attributes, Profile B demonstrated the highest overall relative preference weight (70%), which was significantly greater than either Profiles C (42%, p < 0.001) or D (22%, p < 0.001) (). Profile A demonstrated a significantly higher adherence and compliance relative preference weight (71%) versus the other profiles (Profile B: 62% [p = 0.035]; Profile C: 39% [p < 0.001]; Profile D: 29% [p < 0.001]) ().
Figure 7. Composite of the normalized preference weights (preference-based utilities*) for overall treatment preference and treatment adherence and compliance.
The figure shows four product profiles for overall preference and adherence and compliance preference, based on the sum of normalized attribute level preference weights across six key attributes as indicated by the figure legend, including: taste and odor; preparation instructions; route of administration; weight requirement; packaging, and measurement. An ideal product would have a composite of normalized preference weights of 100%. Profiles that are statistically significantly different (α < 0.05) are labeled with the letter of the comparator.
*Sum of all utilities for each treatment’s corresponding level per attribute, out of a hypothetical 100% representing an ideal product.
Static product profile exercise
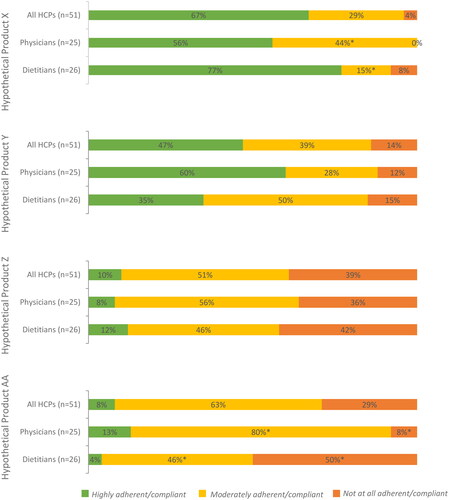
Profile ratings of pre-specified product attributes for static product profiles are presented in the Supplemental Results, Tables 7–10. The profile for Product X was statistically significantly preferred over the profiles for Products Z and AA across multiple characteristics, including taste (Product X compared to Product Z, p = 0.003; Product X compared to Product AA, p < 0.001) and odor (Product X compared to Product Z, p = 0.002; Product X compared to Product AA, p < 0.001), tolerability (Product X compared to Product Z, p = 0.007; Product X compared to Product AA, p = 0.006), ease of dose measurement (Product X compared to Product Z, p < 0.001; Product X compared to Product AA, p = 0.001) and compliance to treatment (Product X compared to Product Z, p < 0.001; Product X compared to Product AA, p = 0.004) (). Product Y was statistically significantly preferred over Products Z and AA, due to taste (Product Y compared to Product Z, p = 0.001; Product Y compared to Product AA, p < 0.001) and odor (Product Y compared to Product Z, p < 0.001; Product Y compared to Product AA, p < 0.001), tolerability (Product Y compared to Product Z, p = 0.009; Product Y compared to Product AA, p = 0.009), and food requirement (Product Y compared to Product Z, p = 0.001; Product Y compared to Product AA, p = 0.003). Product X had a significantly higher rating than Product Y on the attribute of ease of dose measurement (7.5 vs 6.8; p = 0.04), and although no significant differences were seen, Product X had higher ratings on other attributes, including packaging (7.3 vs 1.5), compliance to treatment (7.3 vs 7.1) and ease of transportation (7.4 vs 6.8). Product Y had a significantly higher rating than Product X on the attribute of weight use restrictions (7.5 vs 6.8; p = 0.006). When the hypothetical product profiles were assessed holistically for overall preference and adherence, the majority of respondents expressed preference for Product X overall and for potential adherence, consistent with results of the DCE ( and Citation10).
Figure 8. Static product profile ratings.
Respondents were asked to rate the importance the indicated product attributes of hypothetical nitrogen-binding medication treatments (see Supplemental Table 2 for profiles) for UCDs using a 9-point Likert scale.
XStatistically significantly different from product profile X at an α level of 0.05.
YStatistically significantly different from product profile Y at an α level of 0.05.
ZStatistically significantly different from product profile Z at an α level of 0.05.
AAStatistically significantly different from product profile AA at an α level of 0.05.
*In the context of individual attribute levels, attribute refers to weight restrictions rather than weight-based dosing.
Abbreviation. UCD, urea cycle disorder.
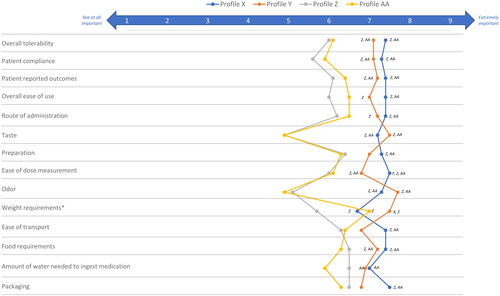
Figure 9. Most preferred UCD treatment by health care provider type.
Respondents were asked to indicate their overall preference for a hypothetical nitrogen-binding medication treatment (see Supplemental Table 2 for profiles) for UCDs using a 9-point Likert scale.
Abbreviation. UCD, urea cycle disorder.
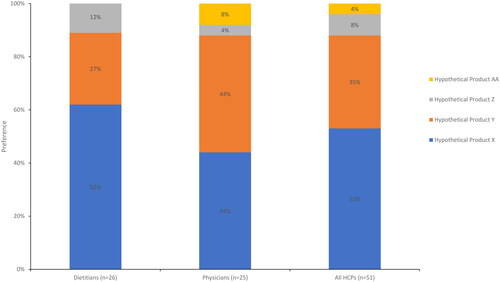
Figure 10. Expected level of adherence of UCD treatment by health care provider type.
Respondents were asked to indicate the anticipated patient adherence and compliance with each hypothetical nitrogen-binding medication treatment (see Supplemental Table 2 for profiles) for UCDs.
*Significant at α level of 0.05.
Abbreviation. UCD, urea cycle disorder.
Discussion
When prescribed and administered correctly (i.e. including both proper dose and adherence), nitrogen-binding medications can be efficacious in patients with UCDs in preventing central nervous system complications, but reduced adherence to UCD therapy (including medication and/or diet) has been reported to be the cause of nearly 25% of HACsCitation11. In this study among health care providers for patients with UCDs, respondents rated agreement with being extremely satisfied with current pharmaceutical treatment of UCDs (i.e. nitrogen-binding medications) as an average of 5.4 on a scale of 1 (strongly disagree) to 9 (strongly agree), suggesting unmet needs with existing treatments. Furthermore, a quantitative DCE methodology identified taste and odor, route of administration, and preparation instructions as key attributes driving preference and adherence among examined attributes. Notably, existing nitrogen-binding treatments for UCDs share common labels for efficacy and safety due to approval of successive medications by the 505(b)2 pathway (i.e. based on bioequivalence), and, therefore, these factors were not examined in the DCE.
Prior research with patients and physicians has also identified poor taste/palatability as a factor in patient adherence. Sodium phenylbutyrate, an existing, FDA-approved nitrogen-binding medication in either powder or tablet form, is known to be associated with aversive taste and odor, and side effects such as nausea, vomiting, and headaches that can potentially lead to medication discontinuationCitation4,Citation12. The present study suggests that amelioration of taste and odor may support increased adherence for nitrogen-binding medications. This concept is corroborated by a study of a taste-masked nitrogen-binding medication approved in Canada, the European Union, and the US for the treatment of patients with UCD, which demonstrated improved patient compliance, quality of life, and reductions in HACsCitation4.
While taste and odor are critical factors in driving preference, results from the current study also reaffirm the importance of packaging, weight use restrictions, and dose measurement to overall preference and adherence. Glycerol phenylbutyrate, which is not associated with the aversive taste of sodium phenylbutyrate, is also FDA-approved for patients with UCDs. Similar to sodium phenylbutyrate powder, however, glycerol phenylbutyrate requires the patient or caregiver to properly measure and administer the medication. In the DCE, respondents expressed preferences for sachet packaging (versus a kit with a multi-use glass bottle or plastic bottle packaging) and not having to measure dose (versus having to measure dose). In studies beyond patients with UCDs, pre-packaged/pre-measured dosing has been shown to improve adherenceCitation16–19. Pre-measured dosing may be particularly impactful in the treatment of UCDs because up to 65% of patients may have cognitive impairment due to even moderately elevated levels of ammoniaCitation4,Citation20.
Notably, this DCE did not assess drug price or cost to patients within the tested attributes, as it is not intrinsic to medications and was considered likely to polarize the outputs given the experience with existing FDA-approved nitrogen-binding medications. For example, the high price of glycerol phenylbutyrate has been reported to contribute to patient access issues and may also contribute to treatment decisionsCitation21. Overall, the assessment of treatment attributes via the DCE methodology combined with health care provider attitudes towards existing UCD therapies suggest a high level of unmet need supporting the development of novel therapies.
The findings of this study need to be interpreted alongside certain limitations. The results of this study may not be generalizable due to the small sample size associated with a rare genetic disease. Data collection occurred via an online survey methodology, and the use of convenience sampling to recruit respondents could have inherent selection biases toward populations that choose to participate in and complete surveys. Non-response bias could not be assessed because the characteristics of non-reponders/non-completers were not collected. Notably, the characteristics provided by those completing the survey indicate active treatment of relevant patients. The online survey methodology also relies upon self-reported data from health care providers, and Likert-type rating questions in a survey may be subject to response/social desirability bias. Due to the cross-sectional nature of the study casual associations could not be established, and the limited sample size inherent in rare disease population may affect the power to detect significance. The DCE required health care providers to consider the use of hypothetical products, and as such these profiles cannot fully reflect real-word products. As the present study limited its examination to nitrogen-binding medications for UCDs, health care provider preferences for non-pharmacologic treatments, such as low-protein diet and amino acid supplementation, were not explicitly examined. Finally, preference can only be established among tested attributes in a DCE, and additional factors, including efficacy, safety, and cost were not included in the DCE. However, it is notable that existing, FDA-approved nitrogen-binding UCD therapies share a label with respect to efficacy and safety due to their approval processes. Despite these limitations, the results from this study provide important information on health care provider preferences for UCD treatments.
Conclusions
Most health care providers indicated unmet needs in the treatment of UCDs by reporting only moderate levels of satisfaction with existing nitrogen-binding medications for UCDs. Among the attributes tested, taste and odor were the most important attributes driving overall preference in prescribing and likelihood of patient adherence and compliance to nitrogen-binding medications for UCD treatment. The development of additional nitrogen-binding treatment alternatives for UCD should focus on reducing, masking, or otherwise improving taste and odor, as well as optimizing packaging and pre-measured administration to increase medication adherence. These attributes are likely to enhance the patient experience of nitrogen-binding medications for UCD treatment and may support improved outcomes in this rare genetic disease.
Transparency
Declaration of financial/other relationships
JRS, KM, and NH are employees and equity holders of Trinity Life Sciences, which was contracted for this study by Acer Therapeutics. Since the conclusion of this study, Acer Therapeutics has become a wholly-owned subsidiary of Zevra Therapeutics. JE was an employee of Trinity Life Sciences during the conduct of this study. AQ is an employee of Zevra Therapeutics with stock/stock options. MS and JH were employees of Acer Therapeutics with stock/stock options during the conduct of this study. RDS was formerly a consultant for Acer Therapeutics. He has received consulting fees from PTC Therapeutics, Leadiant, and Mirum. He is an employee with equity interest in Exact Sciences. He reports research funding from the Smith Lemli Opitz Foundation. RDS received no funding/support for this manuscript.
Author contributions
JE, JRS, KM, NH, JH, and MS conceived/designed the study. JE, JRS, KM, and NH collected the data, performed the analysis, and generated the results. All authors provided input on the analyses and results. All authors participated in the drafting of the manuscript and/or revised it critically for intellectual content. All authors provided their approval to the final form of the manuscript and agreed to be accountable for all aspects of the work.
Data availability statement
All data generated or analyzed during this study are included in this published article, uploaded as supplementary information, or available upon request from the authors.
Previous presentations
Preliminary findings from this study were presented at the 2023 Society for Inherited Metabolic Disorders Meeting, March 18–23, 2023, in Salt Lake City, UT, USA.
Reviewer disclosures
Peer reviewers on this manuscript have no relevant financial or other relationships to disclose.
Supplemental Material
Download MS Word (37.2 KB)Acknowledgements
The authors thank Meghan Gavaghan and Elizabeth Wheatley for medical writing and editorial assistance.
Additional information
Funding
References
- Summar ML, Mew NA. Inborn errors of metabolism with hyperammonemia: urea cycle defects and related disorders. Pediatr Clin North Am. 2018;65(2):231–246. doi:10.1016/j.pcl.2017.11.004.
- Batshaw ML, Tuchman M, Summar M, et al. A longitudinal study of urea cycle disorders. Mol Genet Metab. 2014;113(1–2):127–130. doi:10.1016/j.ymgme.2014.08.001.
- Summar ML, Koelker S, Freedenberg D, et al. The incidence of urea cycle disorders. Mol Genet Metab. 2013;110(1–2):179–180. doi:10.1016/j.ymgme.2013.07.008.
- Enns GM, Porter MH, Francis-Sedlak M, et al. Perspectives on urea cycle disorder management: results of a clinician survey. Mol Genet Metab. 2019;128(1–2):102–108. doi:10.1016/j.ymgme.2019.07.009.
- Häberle J, Boddaert N, Burlina A, et al. Suggested guidelines for the diagnosis and management of urea cycle disorders. Orphanet J Rare Dis. 2012;7(1):32. doi:10.1186/1750-1172-7-32.
- Häberle J, Burlina A, Chakrapani A, et al. Suggested guidelines for the diagnosis and management of urea cycle disorders: first revision. J Inherit Metab Dis. 2019;42(6):1192–1230. doi:10.1002/jimd.12100.
- Peña-Quintana L, Llarena M, Reyes-Suárez D, et al. Profile of sodium phenylbutyrate granules for the treatment of urea-cycle disorders: patient perspectives. Patient Prefer Adherence. 2017;11:1489–1496. doi:10.2147/PPA.S136754.
- Ficicioglu C, Liu N, Sun Q, et al. Perceptions and use of phenylbutyrate metabolite testing in urea cycle disorders: results of a clinician survey and analysis of a centralized testing database. Mol Genet Metab. 2022;135(1):35–41. doi:10.1016/j.ymgme.2021.12.007.
- RAVICTI Prescribing Informatoin. https://www.accessdata.fda.gov/drugsatfda_docs/label/2021/203284s012lbl.pdf: US FDA; 2023. [cited 2023 January 12, 2023]; RAVICTI Prescribing Information]. Available from: https://www.accessdata.fda.gov/drugsatfda_docs/label/2021/203284s012lbl.pdf.
- BUPHENYL Prescribing Information: US FDA. 2023. [cited 2023 January 12]. Available from: https://www.accessdata.fda.gov/drugsatfda_docs/label/2009/020572s016,020573s015lbl.pdf.
- Shchelochkov OA, Dickinson K, Scharschmidt BF, et al. Barriers to drug adherence in the treatment of urea cycle disorders: assessment of patient, caregiver and provider perspectives. Mol Genet Metab Rep. 2016;8:43–47. doi:10.1016/j.ymgmr.2016.07.003.
- Yeowell G, Burns DS, Fatoye F. The burden of pharmacological treatment on health-related quality of life in people with a urea cycle disorder: a qualitative study. J Patient Rep Outcomes. 2021;5(1):110. doi:10.1186/s41687-021-00387-x.
- Summar ML, Dobbelaere D, Brusilow S, et al. Diagnosis, symptoms, frequency and mortality of 260 patients with urea cycle disorders from a 21-year, multicentre study of acute hyperammonaemic episodes. Acta Paediatr. 2008;97(10):1420–1425. doi:10.1111/j.1651-2227.2008.00952.x.
- Ryan M. Discrete choice experiments in health care. BMJ. 2004;328(7436):360–361. doi:10.1136/bmj.328.7436.360.
- Hauber AB, González JM, Groothuis-Oudshoorn CGM, et al. Statistical methods for the analysis of discrete choice experiments: a report of the ISPOR conjoint analysis good research practices task force. Value Health. 2016;19(4):300–315. doi:10.1016/j.jval.2016.04.004.
- Conn VS, Ruppar TM, Chan KC, et al. Packaging interventions to increase medication adherence: systematic review and meta-analysis. Curr Med Res Opin. 2015;31(1):145–160. doi:10.1185/03007995.2014.978939.
- Gutierrez PM, Wortzel HS, Forster JE, et al. Blister packaging medication increases treatment adherence in psychiatric patients. J Psychiatr Pract. 2017;23(5):320–327. doi:10.1097/PRA.0000000000000252.
- Shah G, Erickson JL, Luxenburg J, et al. Impact on patients’ compliance with medication using prepacked blisters for multidrug medical therapy: I-COMPLY study. Am J Health Syst Pharm. 2021;78(18):1713–1719. doi:10.1093/ajhp/zxab193.
- Yeboah-Antwi K, Gyapong JO, Asare IK, et al. Impact of prepackaging antimalarial drugs on cost to patients and compliance with treatment. Bull World Health Organ. 2001;79(5):394–399.
- Waisbren SE, Stefanatos AK, Kok TMY, et al. Neuropsychological attributes of urea cycle disorders: a systematic review of the literature. J Inherit Metab Dis. 2019;42(6):1176–1191. doi:10.1002/jimd.12146.
- Drug Removals for Clients with Advanced Control Specialty Formulary: CVS Caremark. 2023. [cited 2023 January 12]. Available from: https://www.caremark.com/portal/asset/Formulary_Drug_Removals_JPMC.pdf.