
 ?Mathematical formulae have been encoded as MathML and are displayed in this HTML version using MathJax in order to improve their display. Uncheck the box to turn MathJax off. This feature requires Javascript. Click on a formula to zoom.
Abstract
Context: Marrubium vulgare Linn (Lamiaceae) was generally extracted by conventional methods with low yield of marrubiin; these processes were not considered environment friendly.
Objective: This study extracts the whole plant of M. vulgare by microwave assisted extraction (MAE) and optimizes the effect of various extraction parameters on the marrubiin yield by using Central Composite Design (CCD).
Materials and methods: The selected medicinal plant was extracted using ethanol: water (1:1) as solvent by MAE. The plant material was also extracted using a Soxhlet and the various extracts were analyzed by HPTLC to quantify the marrubiin concentration.
Results: The optimized conditions for the microwave-assisted extraction of selected medicinal plant was microwave power of 539 W, irradiation time of 373 s and solvent to drug ratio, 32 mL per g of the drug. The marrubiin concentration in MAE almost doubled relative to the traditional method (0.69 ± 0.08 to 1.35 ± 0.04%). The IC50 for DPPH was reduced to 66.28 ± 0.6 μg/mL as compared to conventional extract (84.14 ± 0.7 μg/mL). The scanning electron micrographs of the treated and untreated drug samples further support the results.
Discussion and conclusion: The CCD can be successfully applied to optimize the extraction parameters (MAE) for M. vulgare. Moreover, in terms of environmental impact, the MAE technique could be assumed as a ‘Green approach’ because the MAE approach for extraction of plant released only 92.3 g of CO2 as compared to 3207.6 g CO2 using the Soxhlet method of extraction.
Introduction
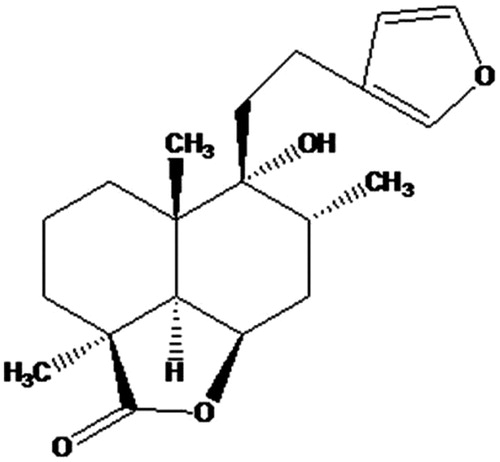
Since ancient times herbs have been the source of a huge range of bioactive compounds such as terpenoids, flavonoids, alkaloids, etc. The safe, effective, and energy efficient extraction of natural products from herbs has always been a challenging task for researchers. The limitations of conventional methods such as high solvent requirement, low quality of extract, huge time consumption, and possible thermal decomposition of target molecules paves the way for the emergence of novel extraction techniques for herbals (Luque de Castro & Garcia-Ayuso Citation1998). The various techniques have been developed to overcome such limitations like microwave assisted extraction (MAE), ultrasound assisted extraction (UAE), supercritical fluid extraction (SFE), accelerated solvent extraction (ASE), enzyme assisted extraction (EAE), and pressurized liquid extraction (PLE) (Cuoco et al. Citation2009; Devgun et al. Citation2009; Gao et al. Citation2010; Hossain et al. Citation2011; Mustafa & Turner Citation2011; Sowbhagya et al. Citation2011). Moreover, these methods can be assumed as ‘Green approach’ for the extraction of plants. Nowadays the MAE technique is highly acceptable as powerful alternative to traditional methods for the extraction of bioactive compounds from plants. Microwaves are the electromagnetic radiations with a frequency range of 0.3 to 300 GHz. The intensification of extraction process in MAE is mainly attributed to rapid increase in temperature due to high ionic conduction and change in dipole rotations of solvent molecules (Eskilsson & Bjorklund Citation2000). The heating by microwave is also contributed by the dissipation factor (tan δ) which in turn depends upon the dielectric constant of the material surrounding the solvent (Mandal et al. Citation2007). Moreover, the moisture inside the plant cell vaporizes due to intense heating and causes the rupturing of cell membrane. The cell disruption facilitates the movement of solvent and solubilization of plant actives thus resulting in high yield of secondary metabolites in relatively less time and with low volume of solvent (Rostagno et al. Citation2009). The furane labdane diterpene, marrubiin () is assumed as the chemotaxonomic marker among the various species of Marrubium genus (Lamiaceae). Generally, marrubiin is isolated from the whole plant of Marrubium vulgare Linn which exhibits a vast number of pharmacological properties such as analgesic, antinociceptive, hypotensive, vasorelaxant, antispasmodic, antioxidant, cardioprotective, gastroprotective, antioedematogenic, and antidiabetic activities (De Souza et al. Citation1998; De Jesus et al. Citation2000; El Bardai et al. Citation2001, Citation2003; Meyre-Silva et al. Citation2005; Mnonopi et al. Citation2011; Paula de Olivera et al. Citation2011; Zaabat et al. Citation2011; Zhang et al. Citation2011; Mnonopi et al. Citation2012). M. vulgare is a perennial herb distributed in Kashmir (5000–6000 ft), Europe and North Africa region of world (Kirtikar & Basu Citation1996). The whole plant is generally extracted by conventional techniques for the isolation of marrubiin (0.3–0.7%) (Rodrigues et al. Citation1998). For scale-up and industrial purpose of plant actives, the different extraction parameters for medicinal plant could be optimized using various designs. In the present study the central composite design (CCD) coupled with response surface methodology was selected to optimize the extraction conditions for M. vulgare using microwaves as heating source. The extracts obtained by Soxhlet method of extraction (SME) and optimized batch of microwave assisted extraction (MAE) were comparatively evaluated for the estimation of marrubiin by high performance thin layer chromatography (HPTLC) and for antioxidant potential. The plant samples were also analyzed by scanning electron micrograph (SEM) for possible microstructural changes.
Figure 1. Marrubiin, the chemotaxonomic marker of Marrubium genus.
Materials and methods
Plant sample and reagents
The whole plant of M. vulgare Linn was collected in the month of June 2013 from the Pulwama district of Jammu and Kashmir state, India. Before processing, the plant was identified by a Dr. Sunita Garg, Chief Scientist, National Institute of Science Communication and Information Resources (NISCAIR) vide reference no NISCAIR/RHMD/Consult/2013/2336-116 dated- 19-11-2013. A voucher specimen was kept in the department for future reference. The marker compound, marrubiin, was purchased from Extrasynthese (France). All the solvents used in the study were of HPLC grade. The ascorbic acid and 2, 2-diphenyl-1-picrylhydrazyl was purchased from Loba Chemie Pvt. Ltd, Mumbai.
Extraction of plant sample
The selected plant material was dried in shade to remove the moisture and pulverized through a mixer grinder. The powdered sample was sieved to a size of 60–80 mesh before extraction by different methods.
Soxhlet method of extraction (SME)
The powdered plant sample (10 g) was extracted with ethanol (500 mL) at 80 °C in a Soxhlet apparatus until complete exhaustion of drug.
Microwave-assisted extraction (MAE)
The processed plant sample (5 g) was kept in a four necked round bottom flask with solvent ethanol (50%). The sample was extracted in U-Wave 1000 Microwave synthesis reactor (SINEO Microwave Chemistry Technology, China) at Power-time mode. The instrument operates at an input power of 2000 W with operating frequency of 2450 MHz and works at atmospheric pressure. The real time temperature was monitored by high precision platinum resistance temperature sensor. The flask was connected to outside condenser through a glass connecting tube (19 mm Φ) and a Ч shaped tube. The pulverized drug was extracted at different operating conditions (Microwave power, irradiation time and different volume of solvent/g of drug) as suggested by experimental design. The extracts obtained by different techniques were cooled and centrifuged at 2000 rpm for 5 min before filtration. Further the extract was filtered and concentrated under reduced pressure by a rotary evaporator at 60 °C. The experiment was conducted in triplicate and percentage yield (w/w) was determined using following formula:
The extracts were kept in a desiccator before further analysis (Devgun et al. Citation2013).
Experimental design
In the present study three process variables like microwave power (X1), irradiation time (X2) and volume of solvent per g of drug (X3) were selected to investigate the effect of these factors on response, i.e. % yield of marrubiin (R) using central composite design (CCD). The optimum conditions for the microwave assisted extraction of selected plant were also determined with the help of response surface methodology (RSM). As described by design, total sixteen experiments were conducted representing eight factorial points, six axial points and two central points for validation and suitability of model. The actual and coded values of independent factors are given in . A polynomial second order EquationEquation (1)(2)
(2) was used to determine the linear (βi), quadratic (βii), and interaction terms (βij), for coded independent variable xi and xj where β0 represents the coefficient of interception and ɛ is the error (Prakash Maran et al. Citation2013a).
(1)
(1)
Table 1. Coded levels with actual values of different independent factors.
The statistical analysis and significance of proposed model was determined by the application of analysis of variance (ANOVA). The design expert software (7.0.3, Statease Inc, Minneapolis, MN, trial version) was employed for design, analysis and to draw the response surfaces.
Quantification of marrubiin by HPTLC
A previously developed and validated analytical method, using high performance thin layer chromatography (HPTLC) system (CAMAG, Muttenz, Switzerland), in our laboratory was used for the quantification of marrubiin in various extracts. The extracts were dissolved in methanol (1 mg/mL) and filtered through 0.45 μm membrane filter before analysis. The standard solution of marrubiin was prepared in a concentration of 1 mg/mL and was further diluted to get a final concentration of 10 μg/mL. The precoated plates of silica gel 60 F254 (20 × 10 cm) supported on aluminum sheet were used as stationary phase. The ten spots of marker compound was applied (40–400 ng) using CAMAG automatic sample applicator (Linomat V) with the help of micro-syringe (100 μL). The chromatogram was developed using toluene, ethyl acetate, and acetic acid (5:4:1) as mobile phase. The chromatogram was developed by ascending technique up to 80% height of plates. The developed plates were dried at room temperature and heated at 110 °C for 5 min on CAMAG TLC plate heater. The spots were visualized in short UV light and scanned in UV-Visible range using CAMAG TLC densitometric scanner. The WINCATS 1.4.8 software was used to analyze the data. The area under curve (AUC) for different concentration of standard compound (marrubiin) was calculated and standard curve was plotted of AUC versus concentration. The concentration of marrubiin in different extracts was determined using equation of straight line derived from calibration curve (Samaddar et al. Citation2013; Nanda & Mittal Citation2016).
Measurement of DPPH scavenging potential
The antioxidant potential of extracts was measured as capacity to scavenge the free radical of DPPH (2,2-diphenyl-1-picrylhydrazyl). The test solution was prepared by diluting the 2 mL of DPPH solution (0.5 mM in ethanol) with 0.2 mL of extract/ascorbic acid and 2 mL of ethanol. The absorbance of the test solution was measured after 0 min and 30 min of incubation by spectrophotometric method at 517 nm. The % inhibition of extracts has been calculated by using following formula:
where Ab (t = 0) is the absorbance of test solution before the reaction at 0 min and Ab (t = 30) represents the solution absorbance after 30 min of incubation. The concentration of the solution to scavenge the 50% DPPH (IC50) was determined by analysis of dose response graph plotted between the different concentration of test solution (20–40 μg of sample/mL of ethanol) and inhibition (%). All the experiments were carried out in triplicate and results were expressed as mean ± S.D. The significance of results was determined by ANOVA followed by Tukey test (Bersuder et al. Citation1998).
Scanning electron microscopy (SEM)
After extraction with different methods, any change in the microstructure of drug sample was confirmed by SEM analysis. The micrographs of treated sample were compared with the untreated plant sample. The samples were subjected to thermal treatment at 40°–50 °C under vacuum for 2 h, sputter coated and then examined with scanning electron microscope (Zhou & Liu Citation2006).
Results and discussion
The whole plant of M. vulgare was extracted by the Soxhlet method of extraction (SME) and the yield of extract was 11.27 ± 1.45% (w/w). The linear regression equation for calibration curve was Y = 4.132 X + 13.02; where Y was area under curve (AUC) and X stands for the concentration of marrubiin (μg). The significant value (0.99) of coefficient of determination (R2) suggests that the equation can be used to evaluate the concentration of marrubiin in different extracts. The percentage yield (%) of marrubiin in the extract obtained by SME was 0.69 ± 0.08.
Generally, a variety of factors influence the productivity of active constituents by MAE process. It includes the particle size, microwave power, irradiation time, extraction temperature, nature of solvent, solvent concentration, solvent to feed ratio, etc. In the present study the ethanol was used as solvent as it is a nontoxic and universal solvent. Also the mechanism of MAE suggested that the generation of heat during extraction also depends upon the dielectric constant of solvent. The solvent absorbs the radiations and dissipates it in the form of heat. The dissipation factor is directly proportional to dielectric constant of the solvent therefore the solvent with high dielectric constant, like water (near 78 at about 80 °C) and alcohol (near 25 at about 70 °C) can be mixed to have a solution which can be used for the efficient extraction in MAE. Moreover, the ethanol is a good absorber of microwaves and is generally considered the best for microwave based extraction of active constituents from herbs (Zhou & Liu Citation2006). Keeping in mind the stability, yield of active constituent (marrubiin) and physical properties of solvent, the temperature for extraction was kept at 80 °C (Chan et al. Citation2011). Also on the basis of some of our preliminary experiments the concentration of solvent was selected as 50% for all the extraction procedure by MAE. Many researchers had applied the different designs for the optimization of MAE process for herbs (Zheng et al. Citation2009). In the present study the response surface methodology (RSM) using central composite design (CCD) was successfully employed for optimization of various extraction parameters in MAE for M. vulgare. A total of 16 experiments were conducted to study the effect of three selected independent factors (X1, X2 and X3) on the % yield of marrubiin (R). A chromatogram of all the sixteen extracts and pure marrubiin was simultaneously developed to confirm the presence of marrubiin (Rf 0.48) in each extract (). The developed plates were scanned by CAMAG TLC densitometric scanner and 3 D diagram showing area under curve (AUC) corresponding with same Rf (0.48) was considered for the quantitative estimation of marrubiin in each extract (). The marrubiin yield (%) for various experimental conditions as prescribed by CCD was calculated by straight line equation ().
Figure 2. TLC chromatogram of different extracts of MAE obtained in 16 experiments (2–17) along with pure marrubiin (1) at 254 nm (UV light).
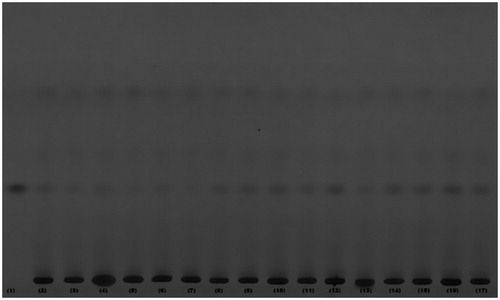
Figure 3. 3 D diagram showing AUC for marrubiin in different extracts of MAE.
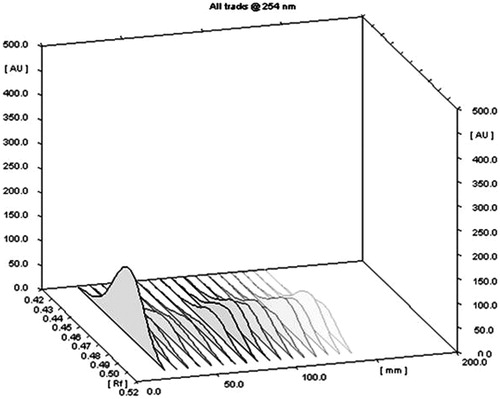
Table 2. % Yield of marrubiin (R) under various experimental conditions as prescribed by CCD.
The design expert software was used to apply the analysis of variance (ANOVA) to experimental data to find out statistical significance of the model (). The model exhibits the F value of 16.13 which implies that there was only 0.15% chance that such large F value occurs due to noise. Moreover, the lower p value (<0.001) further confirms that the developed model was highly significant and regression equation can explain the difference in response. The coefficient of determination (R2) measures the degree of fitness for model and is the ratio of explained variation to total variation. In present case, the R2 approaches to unity (0.96) which suggests the better fitness of model with the actual data and only 3.4% of total variations are not explained by this model (Nath & Chattopadhyay Citation2007). In addition, the adjusted R2 (0.90) was comparable to R2 which further explains that the selected form of developed model used to establish the relationship between the independent variables and response was very well correlated. Further the lack of fit for the developed model has p value <0.129 and F value of 33.87 which indicates that it was not significant relative to the pure error. The small value of coefficient of variance (7.96) clearly explains the reliability and precision of conducted experiments signal to noise ratio of 11.97 justifies the fitness of model to navigate the design space (Dahmcune et al. Citation2015).
Table 3. Analysis of variance (ANOVA) for experimental data and estimated coefficient for various variables.
Model fitting
A mathematical model was developed by multiple regression analysis of experimental data. The model represents the coefficient for various variables and was also used to study the relationship between the response and independent variables. The second order polynomial EquationEquation (2)(2)
(2) developed in terms of coded variables is as follows:
(2)
(2)
The coefficient of linear terms (X1 and X2) and all the quadratic terms were highly significant (p < 0.01) whereas the interactive term coefficients and one of the linear term coefficient (X3) were not considered to be significant on the basis of p value (p > 0.05) ().
Diagnostics of model adequacy
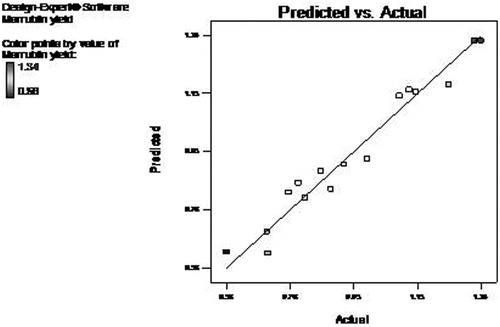
The adequacy of developed model was further evaluated by diagnostic plots. The normal plot of residual between normal % probability and internally studentized residuals was normally distributed with no significant deviation of variance which justifies the fitness of developed model (). The plot between predicted and actual response clearly indicated that all the predicted values lie near to the straight line and was in agreement with real values () (Thirugnanasambandham et al. Citation2015).
Figure 4. Normal plot of residual between normal % Probability and internally studentized residuals.
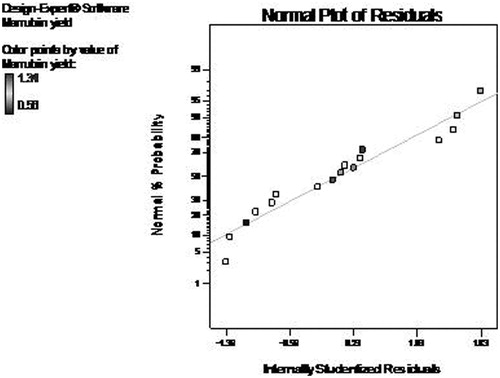
Figure 5. Plot between predicted vs. actual response.
Response surface analysis
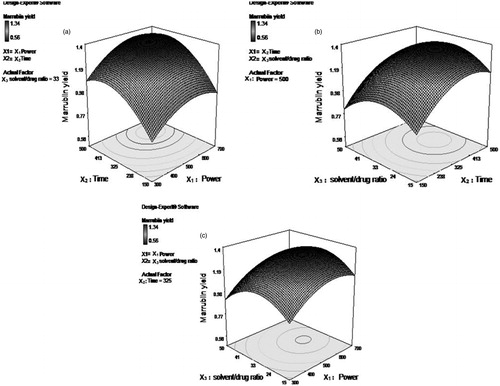
The 3 D response surface graph predicts the relationship between the response and two process variables, keeping the third factor at zero level. The effect of microwave power (X1) and irradiation time (X2) on percentage yield of marrubiin (R) was shown in while the solvent/drug ratio (X3) was kept at zero level. It was clear from the figure that the yield of marker compound increases linearly with power up to 500 W, after that rise in response was not so significant up to 620 W and further increases in power slightly decrease the marrubiin yield (%). It could be explained as the power rises with time more it would more dissipated as heat inside the plant cell and extractant. The intensity of heat depends mainly on dipole rotation and ionic conduction of molecules of dispersion medium. The dipoles of the solvent molecules undergo oscillation and get aligned in the direction of electric field. This process of oscillation and alignment of dipoles occurs at a very high rate which generates the heat inside the medium (Eskilsson & Bjorklund Citation2000). Moreover, the solvent molecules also get dissociated into charged particles (ions) and their flow inside the vessel was also enhanced under the effect of applied electric field. The increased movement of ions also causes the enhanced collision of charged particles and generation of friction energy which ultimately rise the temperature of the medium (Gfrerer & Lankmayr Citation2005; Nadagouda et al. Citation2011). This heat also vaporizes the moisture present inside the drug particles and the thermal effect of microwaves inside the cells of the drug particles causes the cracks or fracture on the cell wall of plant matrix which in turn results in enhanced penetration of solvent inside the cell and more solubilization and exudation of target analytes in the surrounding liquid occurs (Rostagno et al. Citation2009).
After the complete exhaustion of plant cells, the microwave power did not show any significant effect on concentration of active constituents (Alfaro et al. Citation2003). Still, if the herb was exposed to higher power it would deteriorate the chemical structure of active compound to cause decrease in its yield (Hao et al. Citation2002). The exposure time to microwaves also plays a crucial role in the extraction of chemical constituents from botanicals. From the response surface plot of irradiation time (X2) and solvent to drug ratio (X3) at a fixed power level (500 W), it was observed that the concentration of marker compound increased steadily up to 369 s (). This type of behaviour could be attributed to the higher thermal accumulation of solvent due to absorption of electromagnetic radiation with time. However, over exposure of plant material to radiation may decompose the phytoconstituents and finally results in lower efficiency (Wang et al. Citation2009). The influence of solvent volume relative to drug sample (solvent per g of drug) was also evaluated. The 3 D plot between the irradiation power (X1) and solvent per g of drug (X3) for 325 sec (mid level) established the relationship independent variable (X3) and dependent variable (R) (). The observation of plot reveals the linear rise of marrubiin yield with solvent concentration upto 30 mL/g of drug, because the optimum amount of solvent breaks the mass transfer barrier and promotes the movement of plant actives out of the cell matrix (Prakash Maran et al. Citation2013b).
Further, the large solvent to feed ratio results in slight decrease in the yield of marrubiin from the extract. This observation was possibly due to fact that the large volume of solvent requires the additional power for effective heating which in turn disturbs the chemical nature of constituents. Moreover, at higher ratio the mass transfer rate was negatively affected and it stops the inoculation of active constituent (marrubiin) in solution and thus decreases its yield (Mandal & Mandal Citation2010).
Figure 6. Response surface analysis for % marrubiin yield (R) from Marrubium vulgare L. by microwave assisted extraction with respect to (a) X1 (microwave power) and X2 (irradiation time). (b) X2 (irradiation time) and X3 (solvent to drug ratio). (c) X1 (microwave power) and X3 (solvent to drug ratio).
Optimization of extraction parameters and validation of predictive model
The research protocol aims for the optimization of selected extraction parameters to get maximum yield of marrubiin. In the design expert software, the numerical optimization approach evaluates the experimental data and X1 of 539 W, X2 of 373 seconds and X3 of 32 mL per g of drug was predicted as optimized conditions to get the maximum yield of marrubiin (1.368%) which was not significantly different from predicted response and thus validates the model.
Comparative analysis of MAE with SME
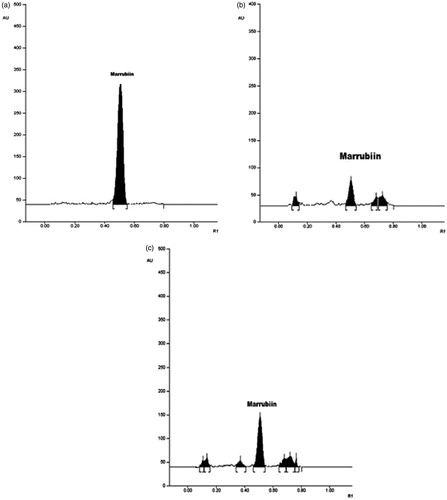
The microwave-assisted extraction (at optimized conditions) and SME was carried out in triplicate and marrubiin concentration was quantified by HPTLC as described in previous section. The chromatogram of pure marrubiin indicated that the retention factor for the compound was 0.48 (). The TLC chromatogram of SME () and MAE () confirms that the marrubiin was present in both extracts and the yield was significantly increased from 0.69 ± 0.08 (%) in conventional extract to 1.35 ± 0.04 (%) in MAE.
Figure 7. (a). Chromatogram showing AUC for the marrubiin. (b) Chromatogram showing AUC for the conventional extract (SME). (c) Chromatogram showing AUC for the extract obtained by MAE.
Radical scavenging activity
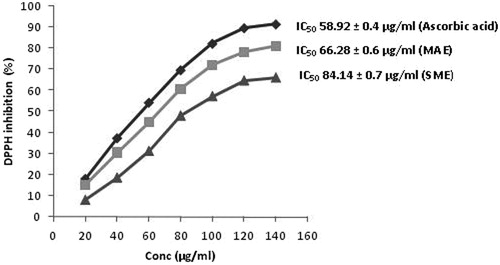
The DPPH solution accepts the hydrogen atom from substrate present in the extract and gets reduced. The violet colour of DPPH solution gets faded due to reducing capability of substrate in extract (Ardestani & Yazdanparast Citation2007). The concentration-based quenching of DPPH radical by test samples () indicates that the MAE extract significantly reduced the IC50 to 66.28 ± 0.6 μg/mL relative to the 84.14 ± 0.7 μg/mL of the extract obtained by conventional method. The reduced DPPH scavenging potential of the microwave extract could be attributed to increased quality of extract in terms of marrubiin concentration as well as the phenolic and flavonoids compounds.
Figure 8. Concentration-based DPPH inhibition (%) of various extracts and ascorbic acid (standard).
Microstructural analysis by SEM
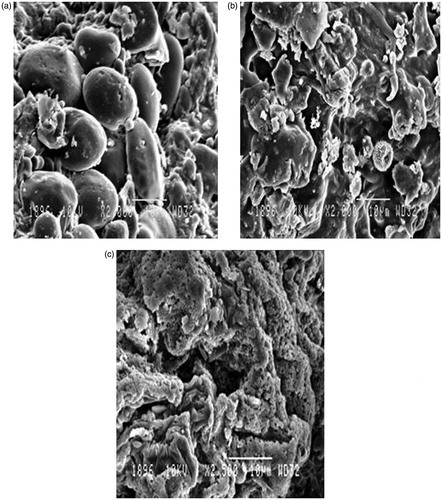
The micrographs of the untreated sample indicated the consistent and uniform cellular structure of drug particles () whereas some disorganized cells was observed after extraction with Soxhlet method (). The rapid rise in temperature and internal pressure by MAE process crumbled the uniformity and texture of vegetal cells significantly (). This situation augments the inlet movement of solvent, solubilization of components and exudation of constituents from cell wall causing enhancement of process efficiency (Ferhat et al. Citation2006; Zhang et al. Citation2008).
Figure 9. (a) SEM image of drug particles before extraction. (b) SEM image of drug particles after extraction with SME. (c) SEM image of drug particles after extraction by MAE.
Impact on environment and energy consumption
The MAE process in optimal conditions (at 539 W and for 373 s) significantly reduced the cost of extraction as compared to SME (at 200 W for 18 h). The energy consumption was cut down from 3.6 KWH in conventional method to 0.103 KWH by MAE process. In terms of environmental impact, the selected novel technique of extraction (MAE) could be assumed as ‘Green approach’ for extraction of whole plant of M. vulgare. As this process release only 92.30 g of CO2 relative to 3207.6 g of carbon dioxide in traditional method (SME) (Filly et al. Citation2014; Abdelhadi et al. Citation2015). Further, in the present study the solvent ratio per g of the drug was also optimized to 32:1 which suggest the less consumption of solvent in MAE process in comparison to the Soxhlet method of extraction (50:1). The comparative data of various extracts is summarized in .
Table 4. Comparison of different extracts for extract yield (%), marrubiin concentration (%), IC50 and CO2 emission.
Conclusion
The present research work concludes that the central composite design coupled with response surface methodology can be successfully applied to optimize the extraction parameters (MAE) for M. vulgare. The study reveals that extraction of selected medicinal plant by microwave based approach at optimized conditions almost doubles the extract yield and marrubiin concentration with less consumption of solvent and electricity as compared to traditional method. Moreover, the DPPH scavenging potential of the MAE extract enhanced significantly relative to the SME. The enhanced anti-oxidant activity may also be due to altered concentration of phenolic or flavonoid compounds which can be further evaluated. The results were also supported by SEM analysis of drug samples. To conclude, it can be said that MAE technique for extraction of whole plant of M. vulgare could be commercially utilized for scale-up process. Further MAE could be assumed as green approach for the extraction with high returns on capital investment. Finally the research could be further extended to analysis of extracts for other phytoconstituents and also the variability of contents with different collection time of raw material.
Acknowledgments
The authors acknowledge the University Grant Commission (UGC), an autonomous institute of Ministry of Human Resource Development, Government of India, for providing the financial assistance to create necessary infrastructural and laboratory facilities in Department of Pharmaceutical Sciences, MDU, Rohtak, under special assistance program (SAP) to make this research project feasible.
Disclosure statement
The authors did not declare any conflict of interest.
References
- Abdelhadi M, Meullemiestre A, Gelicus A, Hassani A, Rezzoug S. 2015. Intensification of Hypericum perforatum L. oil isolation by solvent-free microwave extraction. Chem Eng Res Des. 9 3:621–631.
- Alfaro MJ, Belanger JMR, Padilla JMR, Pare JRJ. 2003. Influence of solvent, matrix dielectric properties and applied power on the liquid-phase microwave-assisted process (MAPTM) extraction of ginger (Zingiber officinalis). Food Res Int. 36:499–504.
- Ardestani A, Yazdanparast R. 2007. Antioxidant and free radical scavenging potential of Achillea santolina extracts. Food Chem. 104:21–29.
- Bersuder P, Hole M, Smith G. 1998. Antioxidants from a heated histidine glucose model system 1: investigations of the antioxidant role of histidine and isolation of antioxidant by high performance liquid chromatography. J Am Oil Chemists Soc. 75:181–187.
- Chan CH, Yusoff R, Ngoh GC, Kung FWL. 2011. Microwave-assisted extractions of active ingredients from plants. J Chromatogr A. 1218:6213–6225.
- Cuoco G, Mathe C, Archier P, Chemat F, Vieillescazes C. 2009. A multivariate study of the performance of an ultrasound-assisted madder dyes extraction and characterization by liquid chromatography-photo diode array detection. Ultrason Sonochem. 16:75–82.
- Dahmcune F, Nayak B, Moussi K, Remini H, Madani K. 2015. Optimization of microwave-assisted extraction of polyphenols from Myrtus communis L. leaves. Food Chem. 166:585–595.
- De Jesus RAP, Cechinel-Filho V, Oliveira AE, Schlemper V. 2000. Analysis of the antinociceptive properties of marrubiin isolated from Marrubium vulgare. Phytomedicine. 7:111–115.
- De Souza MM, De Jesus RAP, Cechinel-Filho V, Schlemper V. 1998. Analgesic profile of diterpene spiro ethers from Marrubium vulgare and from Leonotis leonurus. Gazz Chim Ital. 109:145–150.
- Devgun M, Nanda A, Ansari SH. 2009. Microwave assisted extraction- a promising extraction technique for natural products. Pharm Rev. 7:87–94.
- Devgun M, Nanda A, Ansari SH. 2013. Comparative evaluation of the anti diabetic activity of Pterocarpus marsupium Roxb. Heartwood in the alloxan induced diabetic rats using extracts obtained by optimized conventional and non- conventional methods. Pak J Pharm Sci. 26:973–976.
- El Bardai S, Lyoussi B, Wibo M, Morel N. 2001. Pharmacological evidence of hypotensive activity of Marrubium vulgare and Foeniculum vulgare in spontaneously hypertensive rat. Clin Exp Hypertens. 23:329–343.
- El Bardai S, Morel N, Wibo M, Fabre N, Llabres G, Lyoussi B, Quetin-Leclercq J. 2003. The vasorelaxant activity of marrubenol and marrubiin from Marrubium vulgare. Planta Med. 69:75–77.
- Eskilsson CS, Bjorklund E. 2000. Analytical-scale microwave-assisted extraction. J Chromatogr A. 902:227–250.
- Ferhat MA, Meklati BY, Smadja J, Chemat F. 2006. An improved microwave Clevenger apparatus for distillation of essential oils from orange peel. J Chromatogr A. 1112:121–126.
- Filly A, Fernandez X, Minuti M, Visinoni F, Cravatto G, Chemat F. 2014. Solvent-free microwave extraction of essential oil from aromatic herbs: from laboratory to pilot and industrial scale. Food Chem. 150:193–198.
- Gao YX, Liu X, Xu HG, Zhao J, Wang Q, Liu GM, Hao QF. 2010. Optimization of supercritical carbon dioxide extraction of lutein esters from marigold (Tagetes erecta L.) with vegetable oils as continuous co-solvents. Sep Purif Technol. 71:214–219.
- Gfrerer M, Lankmayr E. 2005. Screening optimization and validation of microwave-assisted extraction for the determination of persistent organochlorine pesticides. Anal Chim Acta. 533:203–211.
- Hao J, Han W, Huang S, Xue B, Deng X. 2002. Microwave-assisted extraction of artemisinin from Artemisis annua L. Sep Purif Technol. 28:191–196.
- Hossain MB, Barry-Ryan C, Martin-Diana AB, Brunton NP. 2011. Optimization of accelerated solvent extraction of antioxidant compounds from rosemary (Rosemarinus officinalis L.), marjoram (Origanum majorana L.) and oregano (Origanum vulgare L.) using response surface methodology. Food Chem. 126:339–346.
- Kirtikar KR, Basu BD. 1996. Indian medicinal plants. Dehradun, India: International Book Distributors.
- Luque de Castro MD, Garcia-Ayuso LE. 1998. Soxhlet extraction of solid materials: an outdated technique with a promising innovative future. Anal Chim Acta. 369:1–10.
- Mandal V, Mandal SC. 2010. Design and performance evaluation of a microwave based low carbon yielding extraction technique for naturally occurring bioactive triterpenoids: oleanolic acid. Biochem Eng J. 50:63–70.
- Mandal V, Mohan Y, Hemalatha S. 2007. Microwave- assisted extraction- an innovative and promising extraction tool for medicinal plant research. Pharmacog Rev. 1:7–18.
- Meyre-Silva C, Yunes RA, Schlemper V, Campos-Buzzi F, Cechinel-Filho V. 2005. Analgesic potential of marrubiin derivatives, a bioactive diterpene present in Marrubium vulgare (Lamiaceae). Farmaco 60:321–326.
- Mnonopi N, Levendal RA, Davies-Coleman RT, Frost CL. 2011. The cardioprotective effects of marrubiin, a diterpenoid found in Leonotis leonurus extracts. J Ethnopharmacol. 138:67–75.
- Mnonopi N, Levendal RA, Mzilikezi N, Frost CL. 2012. Marrubiin, a constituent of Leonotis leonurus, alleviates diabetic symptoms. Phytomedicine. 19:488–493.
- Mustafa A, Turner C. 2011. Pressurized liquid extraction as a green approach in food and herbal plants extraction: a review. Anal Chim Acta. 703:8–18.
- Nadagouda MN, Speth TF, Varma RS. 2011. Microwave-assisted green synthesis of silver nanostructures. Acc Chem Res. 44:469–478.
- Nanda A, Mittal V. 2016. Development of a Novel, Rapid and Validated HPTLC Protocol for the Quantitative Estimation of Marrubiin from the Extract of Marrubium vulgare Linn. J Adv Med Pharm Sci 10:1–8.
- Nath A, Chattopadhyay PK. 2007. Optimization of oven toasting for improving crispness and other quality attributes of ready to eat potato-soy snack using response surface methodology. J Food Eng. 80:1282–1292.
- Paula de Olivera A, Santin JR, Lemos M, Klein LCJ, Couto AG, Bittencourt CMS, Cechinel F, Valdir FA. 2011. Gastroprotective activity of methanol extract and marrubiin obtained from leaves of Marrubium vulgare L. (Lamiaceae). J Pharm Pharmacol. 63:1230–1237.
- Prakash Maran J, Sivakumar V, Sridhar R, Immanuel P. 2013a. Development of model for mechanical properties for tapioca starch based edible films. Ind Crop Prod. 42:159–168.
- Prakash Maran J, Sivakumar V, Thirugnanasambandham K, Sridhar R. 2013b. Optimization of microwave assisted extraction of pectin from orange peel. Carbohydr Polym. 97:703–709.
- Rodrigues CA, Savi AOS, Schlemper V, Reynaud F, Cehinel-Filho V. 1998. An improved extraction of marrubiin from Marrubium vulgare. Chromatographia. 47:449–450.
- Rostagno MA, Villares A, Guillamon E, Garcia-Lafuente A, Martinez JA. 2009. Sample preparation for the analysis of isoflavones from soybeans and soy foods. J Chromatogr A. 1216:2–29.
- Samaddar T, Chaubey B, Jha S, Jha TB. 2013. Determination of swertiamarin and amarogentin content and evaluation of antibacterial activity in Eastern Himalayan species of Swertia L. Phcog Comm. 3:64–70.
- Sowbhagya HB, Srinivas P, Purnima KT, Krishnamurthy N. 2011. Enzyme assisted extraction of volatiles from cumin (Cuminum cyminum L.) seeds. Food Chem. 127:1856–1861.
- Thirugnanasambandham K, Sivakumar V, Prakash Maran J. 2015. Microwave-assisted extraction of polysaccharides from mulberry leaves. Int J Biol Macromol. 72:1–5.
- Wang J, Zhang J, Wang X, Zhao B, Wu Y, Yao J. 2009. A comparison study on microwave-assisted extraction of Artemisia sphaerocephala polysaccharides with conventional method: Molecule structure and antioxidant activities evaluation. Int J Biol Macromol. 45:483–492.
- Zaabat N, Hay AE, Michalet S, Darbour N, Bayet C, Skandrani I, Chekir-Ghedira L, Akkal S, Dijoux-Franca MG. 2011. Antioxidant and antigenotoxic properties of compounds isolated from Marrubium deserti de Noé. J Food Chem Toxicol. 49:3328–3335.
- Zhang B, Yang R, Liu C. 2008. Microwave-assisted extraction of chlorogenic acid from flower buds of Lonicera japonica Thunb. Sep Purif Technol. 62:480–483.
- Zhang HF, Yang XH, Wang Y. 2011. Microwave assisted extraction of secondary metabolites from plants: Current status and future directions. Trends Food Sci Technol. 22:672–688.
- Zheng XZ, Wang X, Lan YB, Shi J, Xue JS, Liu CH. 2009. A comparison study on microwave-assisted extraction of Potentilla anserine L. polysaccharides with conventional method: molecule weight and antioxidant activities evaluation. Carbohydr Polym. 80:84–93.
- Zhou HY, Liu CZ. 2006. Microwave-assisted extraction of solanesol from tobacco leaves. J Chromatogr A. 1129:135–139.