
Abstract
Context
Ganoderma sinensis Zhao, Xu et Zhang (Ganodermataceae) has been used for the prevention or treatment of a variety of diseases, including cancer.
Objective
We investigated the antitumor activity and mechanism of an extract from G. sinensis against hepatocellular carcinoma.
Materials and methods
A G. sinensis extract (GSE) was obtained from sporoderm-broken G. sinensis spores by supercritical fluid carbon dioxide extraction. Hepatoma cells, HepG2 cells, were treated with emulsified sample of GSE at 12.5, 25, 50, 100 and 150 μg/mL for 24 h. The Alamar Blue assay was used to examine growth inhibitory effects. Changes in cell structure and morphology were assessed via transmission electron microscopy and confocal laser scanning microscope. Cell cycle distribution was analysed by flow cytometry.
Results
GSE suppressed the proliferation of HepG2 cells (IC50=70.14 μg/mL). Extensive cytoplasmic vacuolation originating from dilation of the endoplasmic reticulum (ER) was shown in GSE-treated HepG2 cells. GSE treatment also upregulated the expression of ER stress-related proteins in HepG2 cells. Cells tended to be arrested at the G2/M cell cycle stage after GSE treatment (30.8 ± 1.4% and 42.2 ± 2.6% at GSE with 50 μg/mL and 100 μg/mL vs. 21.03 ± 1.10%, control). Pre-treatment with salubrinal, an inhibitor of ER stress, effectively attenuated cell cycle arrest induced by GSE.
Discussion and conclusions
Our findings provide new evidence that GSE suppresses growth of cancer cells in vitro through activating the ER stress pathway. The GSE may be clinically applied in the prevention and/or treatment of cancer.
Introduction
Hepatocellular carcinoma (HCC), the most frequent primary malignancy of the liver, has become the fourth leading cause of cancer-associated death worldwide (Bray et al. Citation2018). At present, surgical resection, orthotopic liver transplantation and radiofrequency thermal ablation are the most common treatments for HCC. Although therapeutic advances have recently been made, the prognosis of HCC remains unsatisfactory, due to resistance to routine chemotherapeutic agents, high recurrence and metastasis. Therefore, novel anticancer drugs with increased selectivity for cancer cells and reduced systemic toxicity are required to improve HCC outcomes.
Ganoderma sinensis Zhao, Xu et Zhan (Ganodermataceae) is an herbal medicine that has been used for thousands of years to prevent or treat a variety of diseases, including cancer. Triterpenoids and polysaccharides are regarded as the major active anticancer components extracted from G. sinensis. Generally, polysaccharides serve as immunomodulators or antioxidants to combat cancer, while triterpenoids mainly inhibit cancer cell proliferation and metastasis (Wu et al. Citation2013). We have obtained an extract from G. sinensis spores with a high bioactive triterpenoid content by supercritical fluid carbon dioxide extraction, which exerts direct tumoricidal effects (Zhang et al. Citation2009); however, its underlying mechanism of action is unclear.
The endoplasmic reticulum (ER) is responsible for protein folding and protein quality control, lipid synthesis and calcium storage. Pathological, environmental or physiological stimuli can cause ER stress, which in turn, affect various biological processes, such as proliferation, metabolism, inflammation, autophagy and apoptosis (Kim et al. Citation2008). ER stress responses are mediated by the activation of several unfolded protein response (UPR) signalling pathways, which are predominantly controlled by three major sensors: inositol requiring enzyme 1 (IRE1), protein kinase RNA-activated (PKR)-like ER kinase (PERK) and activating transcription factor 6 (ATF6) (Maurel et al. Citation2015). Activation of the UPR can increase the overall protein folding capacity and reduce the protein load of the ER.
Some naturally occurring compounds have been found to decrease proliferation and increase apoptosis in various cancer cells by activating the ER stress response and the UPR pathways (Liu et al. Citation2016; Ham et al. Citation2018; Ma et al. Citation2018); however, whether compounds in the G. sinensis extract (GSE) work via a similar mechanism remains unclear. In the present study, we investigate the effect and mechanism of the extract of G. sinensis spores on the survival and proliferation of an HCC cell line.
Materials and methods
Reagents
Foetal bovine serum (FBS) and Dulbecco's modified Eagle's medium (DMEM) were obtained from Thermo Fisher Scientific (Waltham, MA) and 4′,6-diamidino-2-phenylindole (DAPI) was from Sigma-Aldrich (Seelze, Germany). ER-tracker Red was obtained from Thermo Fisher Scientific (Waltham, MA). Mouse monoclonal antibodies (mAbs) against PERK, phosphorylated-eIF2a, CHOP, XBP-1s, cyclin A2 and Cdc25C were obtained from Cell Signaling Technology (Danvers, MA); and anti-β-actin and CDK1 were from Boster (Pleasanton, CA). Salubrinal was purchased from Calbiochem (San Diego, CA).
Plant and spores
A specimen of G. sinensis was obtained and deposited in the Mycological Herbarium, Institute of Microbiology, Chinese Academy of Sciences (Lian et al. Citation2019). The high-quality G. sinensis spores were collected in August 2017, as described in our previous work (Li et al. Citation2016). They were identified by Dr. Wenhua He, Institute of Microbiology, Chinese Academy of Sciences.
Sample preparation and determination of ganoderic acids content
A GSE (27.5 g) was obtained from 100 g of sporoderm-broken G. sinensis spores, as described previously (yield = 27.5 g/100 g) (Li et al. Citation2016). The extract consisted of 85% triglycerides, 2% ergosterol and 10.88% triterpenoids. The triglyceride in the extract contains 18 fatty acids with the majority of C16:0, C16:1, C18:0, C18:1 and C18:2 (Liu et al. Citation2007), and ergosterol includes free ergosterol and ergosterol esters (Yuan et al. Citation2006). Total triterpenoid content in the extract was determined by measuring the absorbance at 548.1 nm using thin-layer chromatography–spectrophotometry and with ursolic acid as the standard. The result showed that the total triterpenoid content was 10.88%. Dressings were prepared by dissolving phosphatidylcholine (Central Soya Co., St. Louis, MO) in distilled water, and the solution was pre-emulsified in a blender for 1 min. Then, GSE was emulsified as previously described (Zhang et al. Citation2009). The emulsified sample contains 15.38% (w/w) of the extract of G. sinensis spores.
Ganoderic acids are the major bioactive triterpenoid component in G. sinensis and are considered ‘markers’ for chemical evaluation. The ganoderic acid content in the extract was determined as described previously (Gao et al. Citation2004; Li et al. Citation2016). Briefly, 20 g of the extract of G. sinensis spores was suspended in 75 mL of petroleum ether and partitioned twice with 75 mL of 95% MeOH. After in vacuo evaporation, the residue was suspended in 50 mL of dichloromethane and partitioned twice with 50 mL of water. The resulting dichloromethane soluble extract was dissolved in 5 mL of methanol and filtered through a 0.45 μM membrane. Then, 10 μL of the solution was injected into the HPLC System (Binary HPLC Pump 1525, Photodiode Array Detector 2996; Waters, Milford, MA), which included a ZORBAX SB-C18 column (4.6 mm × 250 mm, 5 μm; Agilent, Santa Clara, CA) and a Guard column (3.9 mm × 20 mm × 5 mm; Agilent, Santa Clara, CA). The mobile phase was made by mixing solvent A (0.1% phosphoric acid aqueous solution) and solvent B (acetonitrile) using the following gradient program: 0 min, 30% B; 10 min, 36% B; 40 min, 37% B; 50 min, 38% B. The flow rate was set at 1.0 mL/min, and the detecting wavelength was set at 254 nm. The operating temperature was maintained at 23 °C. The chromatographic peak was identified by comparing the retention times and spectra against known standards (Chan et al. Citation2017). The method was validated for parameters such as linearity, precision, repeatability and stability, as previously described (Gao et al. Citation2004).
Cell culture and treatment
The human HCC cell line, HepG2, was originally obtained from the American Type Culture Collection (Manassas, VA). The normal liver epithelial cell line, HL-7702, was purchased from the Cell Bank of the Type Culture Collection (Chinese Academy of Sciences, Shanghai, China). The cells were cultured in DMEM medium supplemented with 10% FBS, 100 U/mL penicillin and 100 μg/mL streptomycin (Hyclone, Logan, UT) in a humidified cell incubator with an atmosphere of 5% CO2 at 37 °C. Cells were treated with GSE at various concentrations for the indicated periods.
Cell viability assay
Cells were seeded at a density of 5 × 10³ cells/well in 96-well plates and allowed to attach overnight. The next day, they were treated with GSE or with medium alone (control) for the indicated time. The dressing solution was used as vehicle control. The viability of cells was determined by the Alamar Blue assay (AbD Serotec, Oxford, UK). The cell viability was calculated according to the following formula: inhibition rate (%)=(1 – absorbance of experimental group/absorbance of control group)×100%. Values are represented as means ± SEM of three independent experiments performed in triplicate.
Wright–Giemsa staining
After treating the cells in the 12-well plate with GSE or vehicle, adherent and non-adherent cells were collected and washed with PBS. Cells were mounted on glass slides by Cytospin (CytoPro 7620, Wescor, Provo, UT), and morphological evaluation was assessed by Wright–Giemsa staining. Samples were dried overnight at room temperature and observed using a microscope (DMI 4000B, Leica, Wetzlar, Germany).
Western blotting
Proteins were extracted as previously described and separated by 10% sodium dodecyl sulphate-polyacrylamide gel electrophoresis (SDS-PAGE) (Pan et al. Citation2019), then being immunoblotted with a mAb against ER stress or cell cycle-related molecules, and visualized with an ECL kit (Pierce, Rockford, IL); β-actin was used as an internal control.
Cell cycle analysis
Flow cytometric analysis was performed using PI/RNase staining according to standard procedures. Cells were collected and then fixed with 75% ice-cold ethanol. After centrifugation, the cells were washed twice with ice-cold PBS, then stained with propidium iodide (PI) at 4 °C for 2 h in the dark. Cell cycle analysis was performed using a Gallios flow cytometer (Beckman Coulter, Brea, CA) and the FlowJo 10.0 software (Tree Star, San Carlos, CA).
Apoptosis assay
HepG2 cells were treated with GSE or with the vehicle for 24 or 48 h. Adherent and non-adherent cells were collected and resuspended in Annexin V-binding buffer. Cells were stained with Annexin V-FITC and DAPI (eBioscience, San Diego, CA) for flow cytometric measurement of apoptosis. Data were acquired using a Cytoflex S flow cytometer (Beckman Coulter, Brea, CA) and analysed using FlowJo (Tree Star, San Carlos, CA).
Transmission electron microscopy
Transmission electron microscopy (TEM) was used to observe the ER in HepG2 cells, as described previously (Dou et al. Citation2018). In brief, cells were fixed overnight at 4 °C with ice-cold 2.5% glutaraldehyde in 0.1 M PBS, and then fixed with 1% OsO4 for 1.5 h. After being washed and dehydrated with graded acetone, the samples were infiltrated and embedded in SPI-812 resin/Spurr resin. Ultrathin sections (80 nm) were cut, stained with uranyl acetate and lead citrate, and then examined with a transmission electron microscope (JEM 1400 JOEL, Tokyo, Japan).
ER localization with ER-tracker staining
ER staining was performed using the ER-tracker kit according to the manufacturer’s instructions (Invitrogen, Carlsbad, CA). Briefly, cells were washed with PBS and then incubated in pre-warmed ER-tracker dye solution (1 mM) for approximately 30 min at 37 °C. After washing with PBS, the cells were observed using an Olympus confocal laser scanning microscope (Tokyo, Japan).
Statistical analysis
All experiments were performed as three independent experiments (n = 3). Data are expressed as mean ± SEM. All statistical analyses were conducted using GraphPad Prism version 6.0 (GraphPad, San Diego, CA). Statistical differences between means were evaluated using a one-way analysis of variance (ANOVA) followed by Tukey’s pairwise comparisons. A p value <0.05 was considered statistically significant.
Results
Ganoderic acid content of the G. sinensis extract
Ganoderic acid content of the extract was determined by HPLC. The method was validated in terms of linearity, precision and accuracy ( and ). Six ganoderic acids were identified and quantified from the HPLC chromatogram (), including ganoderenic acid B (10.44 ± 0.20 μg/g), ganoderic acid A (21.60 ± 0.41 μg/g), ganoderenic acid D (8.67 ± 0.55 μg/g), ganoderic acid D (9.18 ± 0.80 μg/g), lucidenic acid D (13.04 ± 0.65 μg/g) and ganolucidate F (21.47 ± 0.81 μg/g).
Figure 1. The HPLC chromatographic profile of ganoderic acids in the extract of G. sinensis. (A) Reference substance. (B) Sample of the extract of G. sinensis. (1) Ganoderenic acid B; (2) ganoderic acid A; (3) ganoderenic acid D; (4) ganoderic acid D; (5) lucidenic acid D; (6) ganolucidate F.
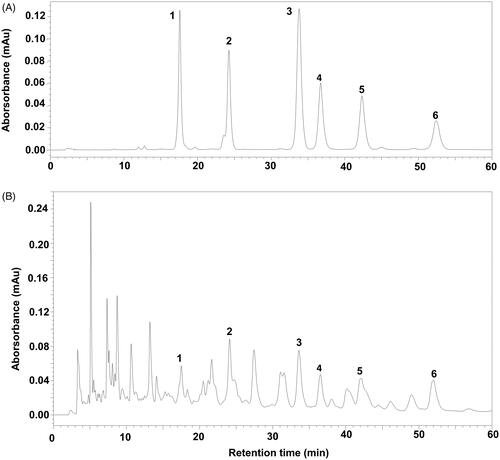
Table 1. Retention time reproducibility, regression equations, correlation coefficients (R2) and linearity ranges of constituents of the extract of G. sinensis.
Table 2. Precision, reproducibility, stability and recovery of constituents of the extract of G. sinensis (n = 6).
GSE inhibits growth and alters the morphology of HepG2 cells
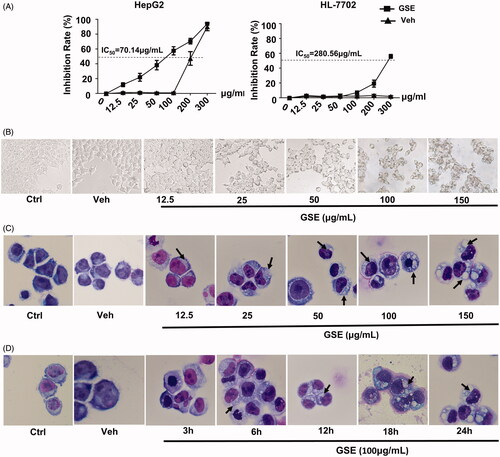
The growth of HepG2 cells was significantly inhibited by GSE. At a concentration of 100 μg/mL, GSE suppressed HepG2 cell growth by about 60% after 24 h of treatment (IC50=70.14 μg/mL). In contrast, GSE at 100 μg/mL only showed a slight inhibitory effect on normal liver epithelial cells (HL-7702 cells; IC50=280.56 μg/mL (). When examining morphological changes via light microscopy, we observed extensive cytoplasmic vacuolation in HepG2 cells after treated with GSE (). In terms of vacuolization surrounding the cell nucleus, small vacuoles appeared in HepG2 cells at 6 h after GSE treatment. These small vacuoles gradually fused into giant vacuoles with increased exposure time (). After 24 h of GSE treatment, some HepG2 cells became detached from the culture plate. Together, these results indicate GSE selectively inhibits the growth of HepG2 cells and induces morphological changes in HCC.
Figure 2. GSE treatment results in decreased cell growth and extensive cytoplasmic vacuolation in HepG2 cells. (A) The inhibitory effects of GSE on cell growth in HepG2 cells or normal liver epithelial cells HL-7702. Cells were treated with the indicated concentrations of GSE for 24 h, cumulative viable cells were measured by the Alamar Blue assay. Data are presented as the means ± SEM of three independent experiments. (B) Morphological alterations of HepG2 cells after treatment with GSE for 24 h by light microscopy (original magnification, ×200). (C) Morphological alterations of HepG2 cells after treatment with GSE by Wright–Giemsa staining. For dose–response experiments (C), cells were treated with GSE for 24 h. For time-course experiments, cells were treated with 100 μg/mL of GSE (D). Ctrl: control; Veh: vehicle.
GSE causes dilation of the ER
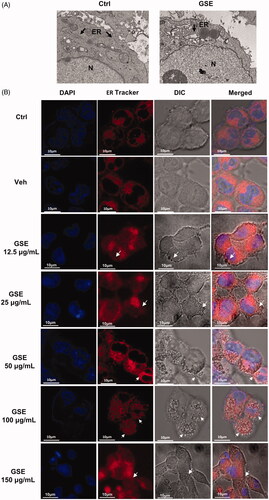
To confirm the origination of the GSE-induced vacuoles, we used TEM to visualize the fine structure of HepG2 cells. We observed extensive swelling of the ER with intact nuclei in GSE-treated cells (). The vacuoles appeared clear and did not contain cytoplasmic material. We further investigated the relationship between the cytoplasmic vacuolization and the ER by staining with ER-Tracker Red. We observed the appearance of vacuoles after exposure to GSE, and the vacuolar membranes were positive for an ER-specific marker (). These findings suggest the cytoplasmic vacuolation induced by GSE in HepG2 cells is primarily due to extensive dilation of the ER.
Figure 3. GSE induces cytoplasmic vacuolation originating from the endoplasmic reticulum (ER) in HepG2 cells. (A) Swelling of the ER in HepG2 cells after treatment with 100 μg/mL of GSE for 24 h. Cells were visualized via transmission electron microscopy. Arrowheads indicate the ER. (B) Cytoplasmic vacuolation in HepG2 cells resulting from enlargement of the ER. HepG2 cells were incubated with ER-Tracker Red dye (1 μM) after exposure to GSE for 24 h and were observed via a fluorescence microscope (scale bars, 10 μm). Ctrl: control; Veh: vehicle; N: nuclear: ER: endoplasmic reticulum; DIC: differential interference contrast.
GSE induces ER stress and activates the UPR
ER vacuolization is usually associated with persistent ER stress. When ER stress occurs, the immunoglobulin heavy-chain binding protein or binding-immunoglobulin protein (BiP), a chaperone protein combined with unfolded or misfolded proteins to promote the correct folding of newborn proteins, activates the UPR signalling pathway (Gardner et al. Citation2013). We found BiP expression was significantly increased in GSE-treated HepG2 cells at 12, 24 and 48 h exposure via western blotting. Furthermore, GSE promoted BiP expression gradually with the increase of GSE concentration ().
Figure 4. GSE induces endoplasmic reticulum stress and activates the unfolded protein response pathway in HepG2 cells. The expression of ER stress-associated proteins in HepG2 cells after GSE treatment. (A) Cells were treated with GSE at indicated concentration for 24 h. (B) Cells were treated with 100 μg/mL of GSE with difference time exposure. β-Actin was used as a loading control in the western blot analysis. Ctrl: control; Veh: vehicle; p: phosphorylated.
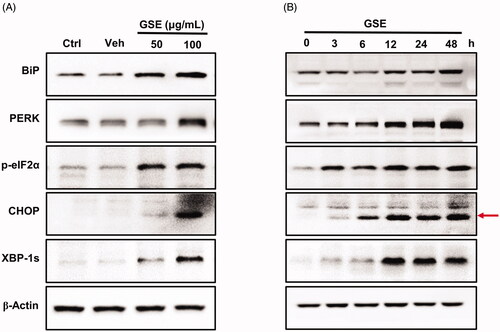
One branch of the UPR signalling pathway is mediated by PERK. PERK undergoes oligomerization and phosphorylates the eukaryotic translation initiation factor 2α-subunit (eIF2α), thereby inhibiting protein translation (Clarke et al. Citation2014). We found GSE increased levels of PERK and phosphorylated eIF2α in HepG2 cells (). As well as inhibiting protein translation, phosphorylated eIF2α promotes the expression of the transcription factor C/EBP homologous protein (CHOP). In parallel with the induction of eIF2α phosphorylation, GSE treatment also upregulated CHOP expression in HepG2 cells ().
When the UPR is activated, IRE1 oligomerizes and activates its ribonuclease domain, which catalyses the splicing of a ubiquitously expressed form of the X-box binding protein 1 (XBP-1u) to generate an isoform named XBP-1s. Therefore, XBP-1s serves as a marker of IRE1 activation (Nishitoh et al. Citation2002). We found GSE treatment increased XBP-1s protein levels in HepG2 cells (). Together, these results demonstrate GSE induces the ER stress-activated UPR pathway in HepG2 cells.
GSE arrests the cell cycle in the G2/M phase
Next, we examined whether GSE inhibits the growth of HepG2 cells via cell cycle arrest using flow cytometry. Compared to the control group, GSE treatment increased the proportion of cells in the G2/M phase with the increase of GSE concentration (30.8 ± 1.4% and 42.2 ± 2.6% at a GSE concentration of 50 and 100 μg/mL, respectively; vs. 21.03 ± 1.10%, control, ). In addition, the proportion of cells in the G0/G1 phase was reduced, yet no changes were observed in the S phase ().
Figure 5. GSE arrests HepG2 cells at the G2/M stage and affects expression of cell cycle regulators. (A) Cell cycle progression of HepG2 cells after treatment with GSE over a period of 24 h; and quantitative distribution of HepG2 cells in different phases of the cell cycle. (B) Data are shown as mean values ± SEM (n = 3). Statistical analysis was carried out by a one-way analysis of variance (ANOVA) followed by Tukey’s pairwise comparisons and p < 0.05 was considered statistically significant. *p < 0.05, **p < 0.01 and ***p < 0.001. (C). Western blot analysis of cell cycle regulatory proteins in HepG2 cells after treatment with GSE for 24 h. Ctrl: control; Veh: vehicle; GSE 50: GSE 50 μg/mL; GSE 100: GSE 100 μg/mL.
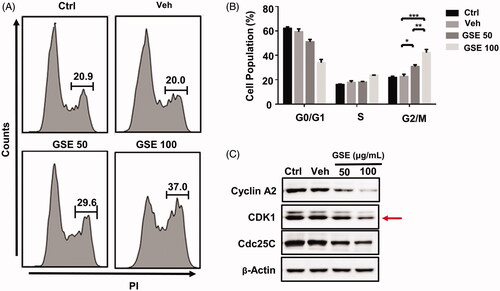
Cell-cycle progression requires the activity of regulatory cyclins and their catalytic partners, the cyclin-dependent kinases (CDKs). Using western blot analysis, we found GSE treatment decreased the protein levels of cyclin A2, cyclin-dependent kinase 1 (CDK1) and Cdc25C in HepG2 cells (). These results indicate the inhibition of cell proliferation by GSE is partly associated with the induction of G2/M phase arrest in HepG2 cells.
ER stress is involved in GSE-induced G2/M phase cell cycle arrest
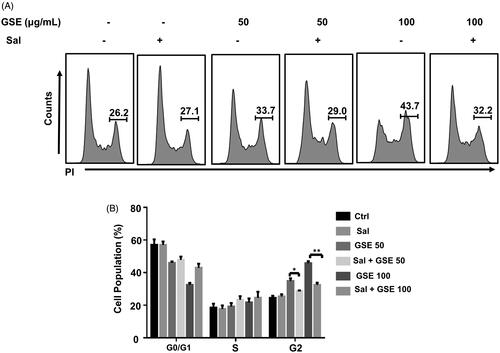
Since recent studies have suggested that UPR activation affects cell cycle protein expression and induces cell cycle arrest in dividing cells (Brewer et al. Citation1999), we investigated whether the ER stress induced by GSE regulates the cell program in HepG2 cells. Salubrinal, a chemical inhibitor of ER stress, selectively attenuates the dephosphorylation of p-eIF2a and has been reported to alleviate cells from ER stress (Boyce et al. Citation2005). We found cells co-treated with salubrinal and GSE significantly decreased the proportion of HepG2 cells in the G2/M phase (29.1 ± 1.1% and 32.2 ± 1.3% at a GSE concentration of 50 and 100 μg/mL, respectively) compared to GSE treatment alone (33.7 ± 1.0%, p < 0.05 and 43.7 ± 1.2%, p < 0.01; ). These findings suggest ER stress is involved in GSE-induced G2/M phase cell cycle arrest.
Figure 6. Salubrinal attenuates GSE-induced G2/M cell cycle arrest. (A) HepG2 cells were pre-treated with 25 mM salubrinal for 1 h and further treated with GSE for 24 h to examine cell cycle progression by flow cytometry. (B) Data are shown as mean values ± SEM (n = 3). Statistical analysis was carried out by a one-way analysis of variance (ANOVA) followed by Tukey’s pairwise comparisons and p < 0.05 was considered statistically significant. *p < 0.05 and **p < 0.01. Ctrl: control: Sal: salubrinal; GSE 50: GSE 50 μg/mL; GSE 100: GSE 100 μg/mL.
GSE has a negligible effect on the apoptosis
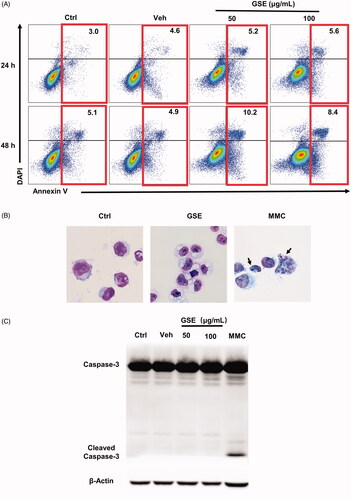
It has been reported that apoptosis of cancer cells was induced by Ganoderma extract (Wu et al. Citation2013). However, flow cytometry using FITC-conjugated Annexin V revealed that GSE exposure did not induce apoptosis of cancer cells (). Meanwhile, GSE treatment did not change the expression of apoptosis-related protein, cleaved-caspase-3 (). In addition, GSE treatment did not cause nucleic condensation or fragmentation in HepG2 cells (). These findings suggest that GSE did not generate apoptosis of HepG2 cells.
Figure 7. GSE has a negligible effect on the apoptosis of HepG2 cells. (A) Analysis of HepG2 cell apoptosis following GSE treatment. HepG2 tumour cells were cultured with GSE at indicated doses or with emulsion (vehicle), harvested and stained with Annexin V-FITC and DAPI. Numbers in the flow cytometric plots indicate the proportions of gated cells. (B) Cells were stained with Wright–Giemsa staining after treatment with 100 μg/mL GSE for 24 h. Cells were treated with MMC (50 μg/mL) for 24 h as a positive control (original magnification, ×400). Arrowhead indicates a typical fragmented nucleus of a cell undergoing apoptosis. (C) Western blot showing protein levels of caspase-3, cleaved-caspase-3. Ctrl: control: Veh: vehicle: MMC: mitomycin.
Discussion
Although Ganoderma extract has been extensively reported to show antitumor activity against a variety of human cancers, including lung, colon, bladder, cervical, liver and breast cancer (Hu et al. Citation2002; Lin et al. Citation2003; Lu et al. Citation2004; Yang Citation2005; Wu et al. Citation2013; Oliveira et al. Citation2014; Liu et al. Citation2015, Citation2020; Ruan et al. Citation2015; Hsin et al. Citation2016; Chan et al. Citation2017; Li et al. Citation2017; Jiao et al. Citation2020), its mechanism of action requires further investigation. This study provides evidence that an extract from G. sinensis spores effectively inhibits proliferation and induces G2/M cell arrest in HepG2 cells. We also found GSE induces ER stress and activates the UPR in HepG2 cells. Furthermore, we showed GSE suppressed the proliferation of HepG2 cells by arresting the cell cycle in the G2/M phase partly through inducing ER stress. Furthering the understanding of the antitumor mechanisms of G. sinensis will allow researchers and clinicians to utilize this drug for cancer treatment better.
Ganoderma lucidum (Leyss. ex Fr.) Karst. and G. sinensis are recorded by Chinese Pharmacopoeia (2015Ed) as among the more than 90 Ganoderma strains that are indigenous to China. To date, most research has focussed on G. lucidum. For example, accumulating evidence shows the effects of G. lucidum triterpenoid-enriched extracts (GLETs) on proliferation inhibition are directly related to their ability to induce cell cycle arrest (Wu et al. Citation2013). Interestingly, the phase of cell cycle arrest of GLETs vary according to the cell line; for example, GLETs induce cell cycle arrest at the G1 phase in breast, lung and colon cancer cells (Lin et al. Citation2003), while they induce G2/M arrest in hepatoma cells (Lin et al. Citation2003; Wu et al. Citation2013). Similarly, we found treatment with GSE (triterpene-enriched extracts) inhibited G2/M progression in HCC cancer cells. Cell cycle progression is regulated by cell division cyclins and CDKs, and G2 arrest could be due to a deficiency in M phase promoting factors (Molinari Citation2000). Indeed, our data showed that cyclin A2, CDK1 and Cdc25C were downregulated by GSE treatment in HepG2 cells, which is consistent with G2/M phase arrest.
Triterpenoid bioactive compounds extracted from G. lucidum have also been shown to cause stress in HCC cancer cells (Lin et al. Citation2003). Recently, it was reported that the UPR activated by ER stress affects cell cycle protein expression and induces a cell cycle arrest in dividing cells (Brewer et al. Citation1999; Kim et al. Citation2008). In the present study, we found GSE treatment resulted in the increased expression of various ER stress markers, including BiP, PERK, CHOP, XBP1s and p-eIF2α. Using electron microscopy and ER-Tracker Red staining, we observed GSE treatment significantly induced ER dilatation and vacuolization in HepG2 cells. Based on these findings, we hypothesized salubrinal, which inhibits global protein translation by blocking the dephosphorylation of p-eIF2a, may reduce the protein burden of the ER and protect cells from ER stress, thus promoting cell cycle progression. We found salubrinal treatment significantly attenuated GSE-induced G2/M cell cycle arrest, which suggests GSE induces G2/M phase cell cycle arrest in HepG2 cells, at least in part, through causing ER stress.
The folding ability of the ER could be disturbed by various endogenous and exogenous insults that result in ER stress (Kim et al. Citation2008). When the pressure is excessive or lasts too long, ER stress turns into a toxic signal, leading to apoptosis. In the present study, no alteration in the sub-G1 peak was observed in the cell cycle analysis of HepG2 cells following treatment with GSE, indicating apoptosis was not involved (). Furthermore, the analysis of morphology and Wright–Giemsa staining or Annexin V/DAPI assay also showed no occurrence of apoptosis (). Similarly, the expression of cleaved caspase‑3 was not detected in HepG2 cells via western blot, suggesting GSE does not induce apoptosis (). Consistent with these results, Lin et al. (Citation2003) found that triterpene-enriched extracts from G. lucidum caused G2 phase cell cycle arrest in HCC cancer cells without inducing apoptosis. Indeed, recent studies have revealed a novel mode of non-apoptotic programmed cell death, termed paraptosis-like cell death, which is characterized by extensive cytoplasmic vacuolation due to dilation of the ER and mitochondria and lacks the typical apoptotic hallmarks (Sperandio et al. Citation2000; Yumnam et al. Citation2016; Xue et al. Citation2018). However, whether GSE-induced ER stress results in paraptosis-like cell death needs further investigation.
Conclusions
This work describes the anti-proliferative effects of GSE in HCC cancer cell, and details its underlying mechanism of action by inducing cell cycle arrest. We propose a new mechanism of action of GSE against HCC by inducing G2/M phase cell cycle arrest through activating the ER stress pathway. These results provide insight into some potential therapeutic strategies for HCC.
Disclosure statement
All authors have no conflict of interest to disclose.
Additional information
Funding
References
- Boyce M, Bryant KF, Jousse C, Long K, Harding HP, Scheuner D, Kaufman RJ, Ma D, Coen DM, Ron D, et al. 2005. A selective inhibitor of eIF2alpha dephosphorylation protects cells from ER stress. Science. 307:935–939.
- Bray F, Ferlay J, Soerjomataram I, Siegel RL, Torre LA, Jemal A. 2018. Global cancer statistics 2018: GLOBOCAN estimates of incidence and mortality worldwide for 36 cancers in 185 countries. CA Cancer J Clin. 68:394–424.
- Brewer JW, Hendershot LM, Sherr CJ, Diehl JA. 1999. Mammalian unfolded protein response inhibits cyclin D1 translation and cell-cycle progression. Proc Natl Acad Sci U S A. 96:8505–8510.
- Chan KM, Yue GG, Li P, Wong EC, Lee JK, Kennelly EJ, Lau CB. 2017. Screening and analysis of potential anti-tumor components from the stipe of Ganoderma sinense using high-performance liquid chromatography/time-of-flight mass spectrometry with multivariate statistical tool. J Chromatogr A. 1487:162–167.
- Clarke HJ, Chambers JE, Liniker E, Marciniak SJ. 2014. Endoplasmic reticulum stress in malignancy. Cancer Cell. 25:563–573.
- Dou H, Yang S, Hu Y, Xu D, Liu L, Li X. 2018. Sesamin induces ER stress-mediated apoptosis and activates autophagy in cervical cancer cells. Life Sci. 200:87–93.
- Gao JJ, Nakamura N, Min BS, Hirakawa A, Zuo F, Hattori M. 2004. Quantitative determination of bitter principles in specimens of Ganoderma lucidum using high-performance liquid chromatography and its application to the evaluation of Ganoderma products. Chem Pharm Bull (Tokyo). 52:688–695.
- Gardner BM, Pincus D, Gotthardt K, Gallagher CM, Walter P. 2013. Endoplasmic reticulum stress sensing in the unfolded protein response. Cold Spring Harb Perspect Biol. 5:a013169.
- Ham J, Lim W, Bazer FW, Song G. 2018. Silibinin stimulates apoptosis by inducing generation of ROS and ER stress in human choriocarcinoma cells. J Cell Physiol. 233:1638–1649.
- Hsin IL, Wang SC, Li JR, Ciou TC, Wu CH, Wu HM, Ko JL. 2016. Immunomodulatory proteins FIP-gts and chloroquine induce caspase-independent cell death via autophagy for resensitizing cisplatin-resistant urothelial cancer cells. Phytomedicine. 23:1566–1573.
- Hu H, Ahn NS, Yang X, Lee YS, Kang KS. 2002. Ganoderma lucidum extract induces cell cycle arrest and apoptosis in MCF-7 human breast cancer cell. Int J Cancer. 102:250–253.
- Jiao C, Chen W, Tan X, Liang H, Li J, Yun H, He C, Chen J, Ma X, Xie Y, et al. 2020. Ganoderma lucidum spore oil induces apoptosis of breast cancer cells in vitro and in vivo by activating caspase-3 and caspase-9. J Ethnopharmacol. 247:112256.
- Kim I, Xu W, Reed JC. 2008. Cell death and endoplasmic reticulum stress: disease relevance and therapeutic opportunities. Nat Rev Drug Discov. 7:1013–1030.
- Li L, Guo HJ, Zhu LY, Zheng L, Liu X. 2016. A supercritical-CO2 extract of Ganoderma lucidum spores inhibits cholangiocarcinoma cell migration by reversing the epithelial–mesenchymal transition. Phytomedicine. 23:491–497.
- Li K, Na K, Sang T, Wu K, Wang Y, Wang X. 2017. The ethanol extracts of sporoderm-broken spores of Ganoderma lucidum inhibit colorectal cancer in vitro and in vivo. Oncol Rep. 38:2803–2813.
- Lian D, Zhong X, Zheng Y, Zhou S, Gu L, Liu X. 2019. A new sterol from sporoderm-broken Ganoderma sinense spores and its anticancer activity. Nat Prod Commun. 14(12):1–6.
- Lin SB, Li CH, Lee SS, Kan LS. 2003. Triterpene-enriched extracts from Ganoderma lucidum inhibit growth of hepatoma cells via suppressing protein kinase C, activating mitogen-activated protein kinases and G2-phase cell cycle arrest. Life Sci. 72:2381–2390.
- Liu RM, Li YB, Liang XF, Liu HZ, Xiao JH, Zhong JJ. 2015. Structurally related ganoderic acids induce apoptosis in human cervical cancer HeLa cells: involvement of oxidative stress and antioxidant protective system. Chem Biol Interact. 240:134–144.
- Liu X, Xu SP, Wang JH, Yuan JP, Guo LX, Li X, Huang XN. 2007. Characterization of Ganoderma spore lipid by stable carbon isotope analysis: implications for authentication. Anal Bioanal Chem. 388:723–731.
- Liu H, Yang J, Li L, Shi W, Yuan X, Wu L. 2016. The natural occurring compounds targeting endoplasmic reticulum stress. Evid Based Complement Alternat Med. 2016:7831282.
- Liu W, Yuan R, Hou A, Tan S, Liu X, Tan P, Huang X, Wang J. 2020. Ganoderma triterpenoids attenuate tumor angiogenesis in lung cancer tumor-bearing nude mice. Pharm Biol. 58:1061–1068.
- Lu QY, Jin YS, Zhang Q, Zhang Z, Heber D, Go VL, Li FP, Rao JY. 2004. Ganoderma lucidum extracts inhibit growth and induce actin polymerization in bladder cancer cells in vitro. Cancer Lett. 216:9–20.
- Ma B, Zhang H, Wang Y, Zhao A, Zhu Z, Bao X, Sun Y, Li L, Zhang Q. 2018. Corosolic acid, a natural triterpenoid, induces ER stress-dependent apoptosis in human castration resistant prostate cancer cells via activation of IRE-1/JNK, PERK/CHOP and TRIB3. J Exp Clin Cancer Res. 37:210.
- Maurel M, McGrath EP, Mnich K, Healy S, Chevet E, Samali A. 2015. Controlling the unfolded protein response-mediated life and death decisions in cancer. Semin Cancer Biol. 33:57–66.
- Molinari M. 2000. Cell cycle checkpoints and their inactivation in human cancer. Cell Prolif. 33:261–274.
- Nishitoh H, Matsuzawa A, Tobiume K, Saegusa K, Takeda K, Inoue K, Hori S, Kakizuka A, Ichijo H. 2002. ASK1 is essential for endoplasmic reticulum stress-induced neuronal cell death triggered by expanded polyglutamine repeats. Genes Dev. 16:1345–1355.
- Pan Y, Zhao A, Zhong Z, Pan X, Cai S. 2019. Ganoderma spore lipid protects mouse bone marrow mesenchymal stem cells and hematopoiesis from the cytotoxicity of the chemotherapeutic agent. Biotech Prog. 35:e2869.
- Oliveira M, Reis FS, Sousa D, Tavares C, Lima RT, Ferreira IC, dos Santos T, Vasconcelos MH. 2014. A methanolic extract of Ganoderma lucidum fruiting body inhibits the growth of a gastric cancer cell line and affects cellular autophagy and cell cycle. Food Funct. 5:1389–1394.
- Ruan W, Wei Y, Popovich DG. 2015. Distinct responses of cytotoxic Ganoderma lucidum triterpenoids in human carcinoma cells. Phytother Res. 29:1744–1752.
- Sperandio S, de Belle I, Bredesen DE. 2000. An alternative, nonapoptotic form of programmed cell death. Proc Natl Acad Sci U S A. 97:14376–14381.
- Wu GS, Guo JJ, Bao JL, Li XW, Chen XP, Lu JJ, Wang YT. 2013. Anti-cancer properties of triterpenoids isolated from Ganoderma lucidum – a review. Expert Opin Investig Drugs. 22:981–992.
- Xue J, Li R, Zhao X, Ma C, Lv X, Liu L, Liu P. 2018. Morusin induces paraptosis-like cell death through mitochondrial calcium overload and dysfunction in epithelial ovarian cancer. Chem Biol Interact. 283:59–74.
- Yang HL. 2005. Ganoderic acid produced from submerged culture of Ganoderma lucidum induces cell cycle arrest and cytotoxicity in human hepatoma cell line BEL7402. Biotechnol Lett. 27:835–838.
- Yuan JP, Wang JH, Liu X, Kuang HC, Huang XN. 2006. Determination of ergosterol in Ganoderma spore lipid from the germinating spores of Ganoderma lucidum by high-performance liquid chromatography. J Agric Food Chem. 54:6172–6176.
- Yumnam S, Hong GE, Raha S, Saralamma VV, Lee HJ, Lee WS, Kim EH, Kim GS. 2016. Mitochondrial dysfunction and Ca2+ overload contributes to hesperidin induced paraptosis in hepatoblastoma cells, HepG2. J Cell Physiol. 231:1261–1268.
- Zhang JP, Zheng L, Wang JH, Magnusson KE, Liu X. 2009. Lipid extract from completely sporoderm-broken germinating Ganoderma sinensis spores elicits potent antitumor immune responses in human macrophages. Phytother Res. 23:844–850.