
 ?Mathematical formulae have been encoded as MathML and are displayed in this HTML version using MathJax in order to improve their display. Uncheck the box to turn MathJax off. This feature requires Javascript. Click on a formula to zoom.
Abstract
Context
Tadehaginoside, an active ingredient isolated from Tadehagi triquetrum (Linn.) Ohashi (Leguminosae), exhibited various biological activities. However, the pharmacokinetics and tissue distribution which affect tadehaginoside’s therapeutic actions and application remain elusive.
Objective
To clarify the metabolism of tadehaginoside in vivo.
Materials and methods
The pharmacokinetics and tissue distribution of tadehaginoside and its metabolite p-hydroxycinnamic acid (HYD) were investigated using LC-MS/MS. Pharmacokinetic parameters were determined in 10 Sprague-Dawley rats divided into two groups, the intravenous group (5 mg/kg) and the oral group (25 mg/kg). For the tissue-distribution study, 20 rats were intravenously given tadehaginoside (5 mg/kg) before the experiment (n = 4). Biological samples were collected before drug administration (control group) and after drug administration.
Results
The linearity, accuracy, precision, stability, recovery and matrix effect of the method were well-validated and the results satisfied the requirements of biological sample measurement. Treatment with tadehaginoside via intragastric and intravenous administration, the calculated Cmax in rats was 6.01 ± 2.14 ng/mL and 109.77 ± 4.29 ng/mL, and Tmax was 0.025 ± 0.08 h and 0.08 h, respectively. The results indicated that the quick absorption of tadehaginoside was observed following intravenous administration, and tadehaginoside in plasma of rats with intragastric administration showed relatively low concentration may be due to the formation of its metabolite. Tissue-distribution study indicated that kidney and spleen were the major distribution organs for tadehaginoside in rats and there was no long-term accumulation in most tissues.
Discussion and conclusion
These results could provide clues for exploring the bioactivity of tadehaginoside based on its pharmacokinetic characteristics.
Introduction
Tadehagi triquetrum (Linn.) Ohashi (Leguminosae), as a traditional Chinese medicine in the southwest of China, has been used extensively in treatment for cold and fever, sore throat, lung sputum, jaundice, hepatitis, nephritis, and enteritis (Wu et al. Citation2015; Aye et al. Citation2019; Wang et al. Citation2019). Tadehaginoside was obtained from this plant and assigned as its main active constituent, which comprises a glucosyl, phloroglucinol, and a trans-p-hydroxycinnamoyl moiety. Recent studies have revealed that tadehaginoside displayed a broad spectrum of biological activities and was deemed as a lead compound for further drug development. For example, it has been demonstrated that tadehaginoside could reduce CCl4-induced oxidative damage and inflammatory through the Nrf2 signalling pathway and NF-κB pathway (Tang et al. Citation2014). In addition, tadehaginoside displayed the ability in increasing glucose uptake by up-regulating PPARγ and glucose transporter-4 in C2C12 Myotubes (Zhang et al. Citation2016). Besides, tadehaginoside exhibited biological activities in decreasing the accumulation of lipid in HepG2 cells (Zhang et al. Citation2015). Moreover, tadehaginoside showed potent activities in curing metabolic disease and could be used as a therapeutic agent against obesity, diabetes, and atherosclerosis (Maison et al. Citation2014; Zhang et al. Citation2015).
Our previous study partially explored the identification of tadehaginoside and its metabolites, and preliminarily determined that p-hydroxycinnamic acid (HYD) was the major metabolite of tadehaginoside in rats (Zhang et al. Citation2015). It is reported that HYD also showed strong antidiabetic and antihyperlipidemic effects by modulating the level of glucose, triglyceride, and total cholesterol (Amalan et al. Citation2016; Zabad et al. Citation2019). Tadehaginoside and its metabolite HYD are similar in pharmacological activities, but it is still unclear that which one plays the major role in vivo after treatment with tadehaginoside. Due to the novel chemical structure and potent biological abilities of tadehaginoside and HYD, their characteristic in vivo should be clarified. Up to now, the pharmacokinetics and tissue distribution of tadehaginoside in rats have never been carried out. Studying pharmacokinetics and tissue distribution can help to predict and clarify events related to drug efficacy and toxicity, and is an essential part of the drug development process (Li et al. Citation2015; Bhateria et al. Citation2016). Accordingly, the in vivo pharmacokinetics and tissue distribution of tadehaginoside in an applicable model and exploration of its properties would be extremely helpful.
Therefore, this work focussed on establishing a specific and reliable HPLC-MS/MS method so that it can be used in quantitatively determining the tadehaginoside and their metabolite in rats. This work analyzed the pharmacokinetic properties of tadehaginoside and their metabolite, which could provide a reference foundation for assessing the pharmacological activities of tadehaginoside and their metabolites.
Materials and methods
Reagents
The aerial parts of the T. triquetrum plant were collected from the Lingshui, Hainan province of China in July of 2017. The plant was identified by Professor Niankai Zeng (School of Pharmaceutical Science, Hainan Medical University, Hainan, China). Tadehaginoside (the purity is over 98%) was separated and purified from T. triquetrum by our research group. HYD (the purity is over 98%) was from Beijing Bailingwei Technology Co., Ltd. (Beijing, China). Quercetin, purchased from the National Institute for Food and Drug Control (Beijing, China), was used as the internal standard (IS, purity = 99.1%) for LC-MS/MS analysis. Ascorbic acid, CH3OH, and HCOOH were of HPLC grade and were obtained from Aladdin Reagents (Shanghai, China). Deionised water was sourced from Hangzhou Wahaha (Hangzhou, China).
Instruments and LC-MS/MS conditions
The HPLC system was equipped with a SIL-20ACXR autosampler, two LC-20ADXR pumps, an online degasser, and a CTO-20A column oven, and they were all purchased from Shimadzu (Kyoto, Japan). The chromatographic column was Synergi™ Fusion-RP 80 Å C18 (4 μm, 2.10 mm i.d × 50 mm, Phenomenex, Torrance, CA, USA), the temperature was maintained at 40 °C during analysis. The aqueous solution containing 0.1% formic acid and methanol with 0.1% formic acid made up the mobile phase. The gradient elution was 10% B at 0–0.29 min, 90% B at 0.30–3.00 min, and 10% B at 3.01–4.00 min. The flow rate was set at 0.5 mL/min and the injection volume was 5 μL.
An AB Sciex Triple Quad™ 5500 system (Applied Biosystems, Foster City, CA, USA) was operated in the electrospray negative ionization mode (ESI–). To separate and determine tadehaginoside, HYD, and IS efficient, the MS analysis detection was optimized when the collision energy was at −22 V for tadehaginoside, −18 V for HYD and −29 V for IS, respectively. The optimized declustering potential was −120 V for tadehaginoside, 120 V for HYD, and −120 V for IS, respectively. Temperature, 550 °C; curtain gas, 25 psi; nebulizer gas, 55 psi; heater gas, 50 psi; ion spray voltage, −4500 V. The ion pairs of m/z 433.3→125.2 (tadehaginoside), m/z 162.8→119.0 (HYD) and m/z 301.1→151.0 (IS) were used for the quantitative analysis while undergoing multiple reactions monitoring (MRM).
Animals
Animal studies were conducted with 180–240 g male Sprague-Dawley rats, which were purchased from Hunan Slack Jingda Experimental Animals (Hunan, China; approval number: SCXK (Xiang) 2016–0002). A total of 10 rats were randomly divided into two groups (5 animals in each group) for pharmacokinetic study. Group I received tadehaginoside by intragastric gavage at a single dose of 25 mg/kg. Group II received tadehaginoside by intravenous gavage at a single dose of 5 mg/kg. Twenty rats were randomly divided into five groups (4 animals in each group) for tissue distribution investigation. Tadehaginoside was given to the rats at a dosage of 5 mg/kg with intravenous administration. All rats were placed in cages in a room with a relative humidity of 50% and temperature at 23 ± 2 °C and were exposed to a 12 h light/dark cycle for a week before experiments. Animals fasted for 12 h before drug administration, and water could be obtained ad libitum. Experimental procedures on animals were undertaken following the National Guidelines and were approved by the animal ethics committee of Hainan Medical University (reg. no. 201506017/HMU).
Preparation of IS and samples
Preparation of stock solutions and working solutions
A certain amount of IS, HYD and tadehaginoside was dissolved in methanol to obtain the stock solution at a concentration of 1 mg/mL. The working solution of IS was further handled by dilution with methanol of stock solution to a final concentration of 10 μg/mL. Next, a linear concentration gradient (1, 5, 10, 100, 1000, 5000, 10,000, and 20,000 ng/mL) of tadehaginoside stock working solution was serially diluted with methanol for pharmacokinetic studies and 50, 100, 1000, 5000, 10,000, and 20,000 ng/mL for tissue-distribution studies. Moreover, the concentrations of working solutions in plasma were 10, 50, 100, 500, 1000, 5000, 10,000, and 20,000 ng/mL for HYD. All solutions were kept refrigerated at 4 °C.
Preparation of calibration standards and quality control (QC) samples
Calibration standards and QC samples were prepared by mixing blank plasma or tissues with the working solutions. The concentrations of calibration standards ranged from 1–2000 ng/mL (1, 10, 100, 500, 1000, and 2000 ng/mL) for tadehaginoside in plasma, and 5–2000 ng/mL (5, 10, 100, 500, 1000, and 2000 ng/mL) in tissues. Similarly, a calibration curve was prepared in the range of 10 ng/mL to 2000 ng/mL at six concentration levels (10, 50, 100, 500, 1000, and 2000 ng/mL) for HYD in plasma. The final concentrations of QC samples were 3, 120, 1500 ng/mL for tadehaginoside in plasma samples, and 12, 120, 1500 ng/mL for tissue samples. In the same manner, three QC samples were set at 30, 120, 1500 ng/mL for HYD.
Preparation of sample solutions
The solution of ascorbic acid (5 μL) was transferred to rat plasma (50 μL) and then vortex-mixed for 15 s. Next, the sample was mixed with IS solution (5 μL, 10 μg/mL in methanol) and methanol (150 μL) and mixed for 1 min. After centrifugation (13,000 g, 10 min), 5 μL of the supernatant was injected into the apparatus.
To investigate its tissue distribution, each weighed tissue was homogenized in 0.9% NaCl (1:2, w/v) after thawing. Thereafter, 100 μL of the tissue homogenate and 10 μL of the ascorbic acid-saturated solution were added to a glass tube and mixed for 15 s. The IS working solution (5 μL, 10 μg/mL in methanol) and methanol (300 μL) were added to it in turn. After vortex-mixing for 1 min, then it was centrifuged at 13,000 g for 10 min under 4 °C. The subsequent steps were conducted according to the procedure applied above.
Method validation
The method in the present study was validated according to the FDA and other related guidelines (Chinese Pharmacopoeia Commission Citation2015; US Food and Drug Administration Citation2001). The rat plasma and target tissues were analyzed to assess the specificity. Plasma and blank homogenates of the livers and kidneys as representative samples were screened for linearity, precision, accuracy, recovery, matrix effect, and stability.
Specificity
Specificity was determined by testing blank rat plasma and tissue homogenates from different rats, tadehaginoside, HYD and IS mixed with biological samples, and biological samples collected after treatment with tadehaginoside, respectively.
Linearity and LLOQ
In the study, 5 μL of working solutions were added into 45 μL of blank rat plasma to prepare the standard plasma samples. After spiking different concentrations of working solution (10 μL) to blank tissue homogenates (90 μL), the tissue standard solutions were obtained.
Calibration curves were constructed according to the previous report. Briefly, the least-squares linear regression method with 1/x2 weighting was used to generate the slope, intercept, and correlation coefficient of each linear regression equation. The lowest concentrations (LLOQ) of tadehaginoside and HYD in the calibration curve were detected with an acceptable precision ≤ 20% and accuracy within ± 20%.
Accuracy and precision
The accuracy and precision of the method in within-run and between-run conditions were evaluated using three consecutive batches and on more than two days at low, medium, and high QC levels (n = 6). The relative error (RE%) was applied to express the accuracy and the relative standard deviation (RSD%) was applied to express the precision.
Matrix effect
Blank plasma and tissues were processed, the QC samples were added, and the matrix effect in samples was analyzed in three levels (low, medium, and high). Next, the mean peak area of the analyte or IS in post-extracted spiked plasma/tissue homogenates was compared against the neat sample at the corresponding concentration.
The matrix factor (MF) of analytes (or IS) and IS-normalized MF were evaluated using EquationEqs. (1)(1)
(1) and Equation(2)
(2)
(2) (Bhateria et al. Citation2016; Ramakrishna et al. Citation2016).
(1)
(1)
(2)
(2)
Recovery
Recovery experiments were calculated via the determination of six replicates from the QC samples. The extraction recoveries were obtained by comparing the response of analytes from the extracted samples with the response of the same concentration of analytes spiked into the solution extracted from blank biological samples.
Stability
Stability was assayed by quintuplicate determinations of QC samples for each concentration. The following conditions were applied to test the stability of tadehaginoside and its metabolite: (i) after 4 h at room temperature (samples which had undergone a protein-precipitation procedure); (ii) after 2 h at room temperature (samples which had not undergone a protein-precipitation procedure); (iii) after 6 h in the autosampler (15 °C); (iv) after 24 h at 2–8 °C; (v) after three freeze-thaw cycles; (vi) after 7 days of storage at −20 °C.
Pharmacokinetic study
Two groups (n = 5 per group) were set up by randomly dividing the ten male Sprague-Dawley rats. One group was given tadehaginoside intravenously at a dose of 5 mg/kg. The other group was orally administered tadehaginoside at doses of 25 mg/kg. Blood samples (0.2 mL) were collected immediately from the suborbital vein and placed in heparinized 1.5 mL polythene tubes before drug administration (control group), 5.0, 10.0, 15.0, 20.0, 30.0, 45.0, 60.0, 90.0, 120.0, 240.0, and 360.0 min, respectively, after drug administration. Then, each blood sample was immediately centrifuged at 2000 g for 10 min at 4 °C, and plasma was harvested and stored at −20 °C until further treatment.
Tissue-distribution study
The tissue-distribution investigation was conducted on twenty Sprague–Dawley rats which were divided randomly into five groups. Rats were intravenous administration at a dose of 5 mg/kg and sacrificed by overdose of pentobarbital sodium (100 mg/kg) intraperitoneally for each time point (30.0, 60.0, 120.0, and 240.0 min). To remove superficial blood and contents, tissues (brain, heart, liver, spleen, lungs, kidneys, stomach, small intestine, skeletal muscle, body fat, and testes) were harvested and rinsed with ice-cold physiologic (0.9%) NaCl. Next, tissues were blotted with filter paper, weighed accurately, and homogenized in 0.9% NaCl (1:2, m/v). The obtained tissue homogenates were immediately stored at −20 °C until analysis.
Statistical analysis
To calculate pharmacokinetic parameters, DAS 3.2.8 (Mathematical Pharmacology Professional Committee of China, Shanghai, China) was applied as a non-compartmental model. The half-life, area under the curve, clearance rate and mean residual time were calculated. Results are all expressed as the mean ± standard deviation (SD).
Results
Method conditions
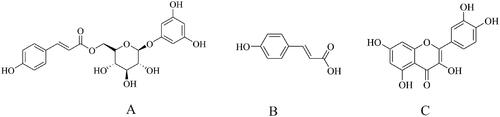
An HPLC–MS/MS was established to investigate and optimize the separation of tadehaginoside, HYD, and IS. Chromatographic separation was conducted on a Synergi™ Fusion -RP 80 Å C18 column (4 μm, 2.10 mm i.d × 50 mm) with a mixture of the aqueous solution with formic acid (0.1%, v/v) and methanol containing formic acid (0.1%, v/v) as the mobile phase. depicts the chemical structures of tadehaginoside, HYD, and IS. The MRM with an electronic spray ionization source was performed to measure the response of tadehaginoside (m/z 433.3→125.2), HYD (m/z 162.8→119.0), and IS (m/z 301.1→151.0).
Figure 1. Structural formula of tadehaginoside (A), p-hydroxycinnamic acid (B) and quercetin (C).
Method validation
Specificity
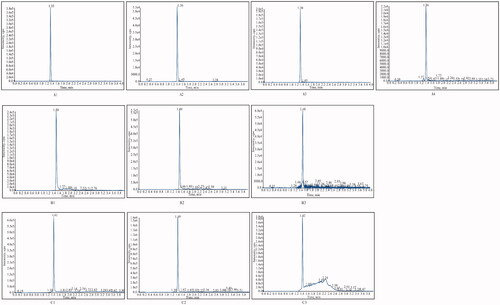
Typical MRM chromatograms of blank plasma and tissues, blank plasma and tissue homogenates spiked with analytes as well as real plasma and tissue homogenates samples after administration of tadehaginoside were shown in . Endogenous interference was not detected at the retention time of tadehaginoside (1.35 min), HYD (1.41 min), and IS (1.50 min) owing to the high selectivity of the MRM mode.
Figure 2. Typical chromatograms of different samples (A1) Tadehaginoside in blank plasma; (A2) Tadehaginoside in blank matrix (spleen); (A3) Plasma sample at 5 min after intravenous administration of tadehaginoside; (A4) Kidney sample at 30 min after intravenous administration of tadehaginoside; (B1) Blank plasma spiked with IS; (B2) Blank matrix (spleen) spiked with IS; (B3) Plasma sample at 5 min after intravenous administration spiked with tadehaginoside and IS; (C1) HYD in Blank plasma; (C2) Plasma sample at 5 min after intravenous administration spiked with HYD; (C3) Plasma sample at 5 min after intragastric administration 5 min spiked with HYD.
Linearity and LLOQ
The linearity parameters for tadehaginoside and HYD are shown in . The correlation coefficient was over 0.99 for all of the calibration curves. The accuracy of the back-calculated concentrations in calibration curves for tadehaginoside was 87.7–121.9% in plasma, 87.8–109.5% in the kidneys and liver, and for HYD was ranged from 82.5%–119.5% in plasma. The RSD% was not more than 12.3% for tadehaginoside and HYD. The LLOQ of tadehaginoside was 1 ng/mL in plasma, 5 ng/mL in the kidneys and liver and for HYD was obtained as 10 ng/mL in plasma. These data suggested that our method was sensitive for both pharmacokinetic and tissue distribution studies.
Table 1. Parameters of standard curves of tadehaginoside and HYD in the rats as determined by LC-MS/MS during method validation.
Accuracy and precision
Data regarding precision and accuracy are showed in . The within-run and between-run precision of tadehaginoside and HYD were less than 11.8% and 10.6%, respectively. Moreover, the within-run and the between-run accuracy of the method were determined lower than 109.2% and 107.2%.
Table 2. Accuracy, precision, matrix effect and recovery of the LC-MS/MS method to determined tadehaginoside and HYD in rat plasma and various tissues (n = 6).
Matrix effects
Matrix effects were used to reflect the accuracy of the analysis results (Chamberlain et al. Citation2019). The mean IS-normalized MF was evaluated by using the same method in plasma and tissue homogenates with RSD% <15%, as shown in . No significant suppression or enhancement of ions due to matrix components was found, indicating the method of extraction met the requirements and the analytical method was reliable.
Recovery
In , the extraction recoveries of tadehaginoside and HYD at three working concentration levels in samples were found to be 80.2–116.0% and 82.5–88.1%, respectively. The results indicated that this simple sample preparation method for extraction recovery was high and stable.
Stability
Stability is one of the key parameters to be investigated during our study as it is meant to establish the conditions for storage and extraction. As shown in , the stability of analytes in different conditions was within acceptable levels. Tadehaginoside was stable in plasma and various tissues under the following conditions: after three freeze-thaw cycles; at room temperature for 2 h and 4 h; at 15 °C in the autosampler for 6 h; at 2–8 °C for 24 h (Recovery% ranged from 80.5% to 115.2% with RSD ≤ 9.4% for plasma, 81.2% to 110.4% with RSD ≤ 15.3% for tissue homogenates), and in a freezer set at −20 °C for 7 d (Recovery% ranged from 82.3% to 95.7% with RSD ≤ 11.5% for plasma, 87.7% to 99.8% with RSD ≤ 13.3% for tissue homogenates). For HYD, the plasma samples were stable with a Recovery% range of 83.3%–107.2% and RSD ≤ 13.9% at each storage condition.
Table 3. Stability of the tadehaginoside and HYD in rat plasma and various tissues under different storage conditions.
Pharmacokinetic study and tissue-distribution study
The LC-MS/MS method was successfully used in investigating the pharmacokinetics of tadehaginoside and HYD, which followed a single dose (25 mg/kg for intragastric and 5 mg/kg for intravenous) administration. The major pharmacokinetic parameters of tadehaginoside and HYD were calculated by a non-compartmental model and demonstrated in . The mean plasma concentration-time curves as depicted in . The concentrations of tadehaginoside in tissues determined at 0.5 and 1 h are shown in .
Figure 3. Mean plasma concentration–time curves of tadehaginoside and p-hydroxycinnamic acid after (A), (C) intragastric administration (25 mg/kg); (B), (D) intravenous administration (5 mg/kg) to rats.
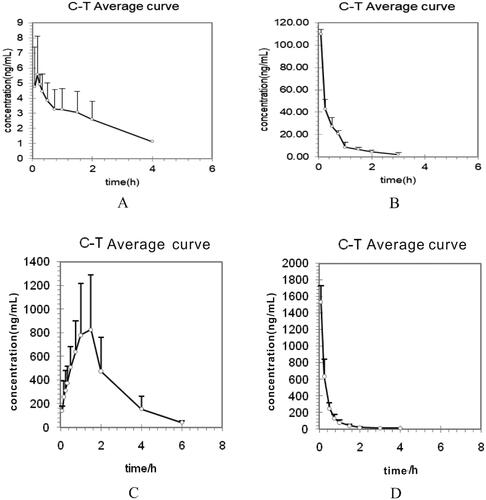
Figure 4. Concentration of tadehaginoside in rat tissues determined by HPLC-MS/MS.
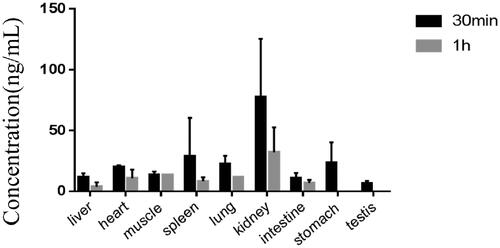
Table 4. Pharmacokinetic parameters of tadehaginoside and HYD after intragastric and intravenous administrations.
Discussion
Optimization of method conditions
The stable-isotope labelled analogs of the analytes are usually used as IS. However, the isotope labelled analogs of tadehaginoside are challenging to synthesize and the cost is too expensive. In this study, different possible internal standards were tested including chlorogenic acid and quercetin as their chromatographic behaviours and extraction efficiencies were similar to those of tadehaginoside. Chlorogenic acid was found to be unsuitable owing to poor peak shape and strong interference in the MRM channels. To control the matrix effect, we used quercetin, which is believed to be the most appropriate IS for quantitative LC–MS/MS. Chromatography conditions such as the constitution of the mobile phase have a vital role in attaining a good result (for instance, appropriate ionization) (Millecam et al. Citation2019; Tao et al. Citation2019). In order to optimize the analytical performance, two different mobile phases which are methanol-water, acetonitrile-water are used. The result displayed that acetonitrile fell short of the target as the organic phase, but methanol could perform a perfect peak shape and a better resolution during the experiment. Moreover, the different concentrations of the organic reagent (50%, 60%, 70%, 80%, 90%, and 100%, respectively) that improved the speed of sample analyses and peak shape were investigated. The results showed that the mobile phase of water (containing 0.1% acetic acid)-methanol (containing 0.1% acetic acid) was a more suitable combination to achieve the optimal retention time and ionization of analytes.
The MS conditions were optimized to achieve high recovery, sensitivity, and selectivity. The mass spectrum of tadehaginoside, HYD and IS are displayed in . In Q1 scan mode, singly charged protonated precursor ion [M-H]- of tadehaginoside was found to be m/z 433.3. In product ion scan, abundant product ion was observed at m/z 125.0 or 125.2 for tadehaginoside. Therefore, the MRM transition of m/z 433.3→125.0 was used for the quantification of tadehaginoside. Next, the transition ion of m/z 162.9→119.0 for HYD was determined in the same way. Finally, the MS conditions of quercetin initially were based on the literature for IS (Day et al. Citation2001). In order to obtain the highest relative abundance of precursor and product ions from the MS/MS product ions of analytes, the parameters such as fragment energy and collision energy were optimized, respectively.
Figure 5. The mass spectrum of tadehaginoside [(A), Q1-scan; (B) Full-scan], p-hydroxycinnamic acid [(C), Q1-scan; (D) Full-scan] and quercetin [(E), Q1-scan; (F) Full-scan].
![Figure 5. The mass spectrum of tadehaginoside [(A), Q1-scan; (B) Full-scan], p-hydroxycinnamic acid [(C), Q1-scan; (D) Full-scan] and quercetin [(E), Q1-scan; (F) Full-scan].](/cms/asset/365b0ce7-6dba-4129-90d5-d25a795a1dfc/iphb_a_1990354_f0005_c.jpg)
Sample preparation
In the selection of treatment conditions for plasma samples, the peaks of tadehaginoside and quercetin of those samples without an ascorbic acid solution in the protein precipitation approach were degraded to different degrees after being placed at room temperature or in the automatic sampler for a long time. This phenomenon was especially shown in quercetin. Therefore, a suitable amount of ascorbic acid solution was added during plasma protein treatment to make the sample more stable.
Pharmacokinetic study
Following intragastric administration at a dose of 5 mg/kg, the peak drug concentration (Cmax) of tadehaginoside was 6.01 ± 2.14 ng/mL. Comparing with intravenous injection, the Cmax of tadehaginoside showed a relatively low concentration after intragastric administration, suggesting that the absorption of tadehaginoside was not good in the gastrointestinal tract. The result was similar to the absorption behaviour from most glycosides (Azuma et al. Citation2000; Liu et al. Citation2009). Tadehaginoside, as well as most glycosides, consists of multiple hydrophilic groups (like hydroxyl groups) in their molecular structure, which leads to hydrophilicity greater than lipophilicity. Therefore, it was difficult to pass through the biofilm and has a low enrolment concentration. At 0.08 h (Tmax) after intravenous administration, Cmax was found to be 109.77 ± 4.29 ng/mL, indicating the quick absorption of tadehaginoside in rats in this way. We also found that tadehaginoside was 5 ng/mL, while the concentration of HYD achieved a high level for intragastric administration at 0.08 h. As the existence of multiple hydrolyzes in plasma, such as carboxylesterase, amide ester hydrolase, phosphatase, epoxide hydrolase and so on, we speculated that tadehaginoside could be hydrolyzed rapidly after intravenous administration resulting in low concentration. The results showed that HYD is an active metabolite in vivo after oral tadehaginoside and the pharmacological activities of tadehaginoside such as antidiabetic and antihyperlipidemic might be derived from HYD. And the t1/2 of tadehaginoside was 2.51 ± 2.21 h for intragastric and 1.27 ± 1.19 h for intravenous administration, respectively. It was obvious that the blood concentration can be maintained for a long time after intragastric administration. The phenomenon suggests that tadehaginoside could be absorbed not only in the stomach but also in the small intestine, colon and other intestinal sites. There was no significant difference in the mean residence time from the time of dosing to the time of the last measurable concentration (MRT(0−t)) between intragastric and intravenous administration, which showed that tadehaginoside has better distribution and moderate elimination in vivo. A pharmacokinetic study indicated that tadehaginoside in plasma of rats with different administrations showed a certain difference in the pharmacokinetic parameters. In order to take better advantage of tadehaginoside, the forms of administration and the levels of dose still need to be validated to improve patients' compliance by further experiments. The bioavailability of tadehaginoside was evaluated according to these data which guided its further clinical research.
Tissue-distribution study
The pharmacology of some drugs is different may be due to gender differences (Jakutiene et al. Citation2007; Liu et al. Citation2018), male SD rats were only selected in our study as they have relatively stable physiological characteristics and are more conducive to follow-up studies.
After intravenous administration of 5 mg/kg, we measured the concentrations of tadehaginoside in tissues at the designated time points of 0.5, 1, 2, and 4 h. Since the presence of tadehaginoside was detected in various tissues, we concluded that tadehaginoside can be widely distributed in rat tissues after intravenous administration, and these data were consistent with those of the pharmacokinetic study. At a dose of 5 mg/kg, the highest level of tadehaginoside was observed in all tissues except the brain, which revealed that tadehaginoside was difficult to cross the blood-brain barrier. Thirty minutes after intravenous administration, the observed distribution of concentration was (in descending order) kidneys > spleen > lungs > heart > muscle > liver > intestine. The higher levels in the kidneys and spleen could be due to the higher blood flow in these organs. Tadehaginoside was detected in the testes, stomach, and body fat of only individual rats might be explained by the individual differences in animals. At 2 h after dosing, the tadehaginoside concentration in tissues or organs was lower than the LLOQ. This result indicated that tadehaginoside was distributed rapidly and there was no long-term accumulation in most tissues, which was congruent with the observed change trend in the plasma concentration. Revealing the accumulation of tadehaginoside in the body by comparing the distribution of tadehaginoside in organs or different tissues at different time points could provide a reference for evaluating the target organs of tadehaginoside.
Conclusion
To our knowledge, we present the first comprehensive pharmacokinetics and tissue-distributions study of tadehaginoside in rats after intragastric and intravenous administration. A specific, sensitive, and reliable LC-MS/MS method was established to determine tadehaginoside and their metabolite in the plasma and tissues of rats. Our method has significant advantages in terms of simple preparation of samples and short analysis times. We conclude that tadehaginoside could be distributed widely and eliminated rapidly after administration. One of the important targets in our next research could relate to taking some reasonable and effective methods to improve the oral bioavailability of tadehaginoside. The present study will contribute tadehaginoside to be a promising natural product, which also provides insights into further pharmacological investigations.
Author contributions
ZHS and XPZ conceived and organized the review. CYZ, YTL and NM performed the experiments and drafted the manuscript. YFT, DL, QBL and WYL revised the manuscript. All authors read and approved the final manuscript.
Disclosure statement
No potential conflict of interest was reported by the author(s).
Additional information
Funding
References
- Amalan V, Vijayakumar N, Indumathi D, Ramakrishnan A. 2016. Antidiabetic and antihyperlipidemic activity of p-coumaric acid in diabetic rats, role of pancreatic GLUT 2: in vivo approach. Biomed Pharmacother. 84:230–236.
- Aye MM, Aung HT, Sein MM, Armijos C. 2019. A review on the phytochemistry, medicinal properties and pharmacological activities of 15 selected myanmar medicinal plants. Molecules. 24(2):293.
- Azuma K, Ippoushi K, Nakayama M, Ito H, Higashio H, Terao J. 2000. Absorption of chlorogenic acid and caffeic acid in rats after oral administration. J Agric Food Chem. 48(11):5496–5500.
- Bhateria M, Ramakrishna R, Puttrevu SK, Yerrabelli S, Saxena AK, Bhatta RS. 2016. Pre-clinical investigation of plasma pharmacokinetics and biodistribution of a novel antithrombotic agent S002-333 in mice using LC-MS/MS. J Chromatogr B Analyt Technol Biomed Life Sci. 1031:154–162.
- Chamberlain CA, Rubio VY, Garrett TJ. 2019. Impact of matrix effects and ionization efficiency in non-quantitative untargeted metabolomics. Metabolomics. 15(10):1–9.
- Chinese Pharmacopoeia Commission. 2015. Pharmacopoeia of the People’s Republic of China. Beijing (China): China Medical Science Press.
- Day AJ, Mellon F, Barron D, Sarrazin G, Morgan MRA, Williamson G. 2001. Human metabolism of dietary flavonoids: identification of plasma metabolites of quercetin. Free Radic Res. 35(6):941–952.
- Jakutiene E, Grikiniene J, Vaitkevicius A, Tschaika M, Didziapetriene J, Stakisaitis D. 2007. Sodium valproate stimulates potassium and chloride urinary excretion in rats: gender differences. BMC Pharmacol. 7(1):1–7.
- Li YX, Zhang YQ, Yang T, Li H, Guo J, Zhao QQ, Xie JB. 2015. Pharmacokinetics and tissue distribution study of isovitexin in rats by HPLC-MS/MS. J Chromatogr B Analyt Technol Biomed Life Sci. 991:13–20.
- Liu HF, Yang JL, Du FF, Gao XM, Ma XT, Huang YH, Xu F, Niu W, Wang FQ, Mao Y, et al. 2009. Absorption and disposition of ginsenosides after oral administration of Panax notoginseng extract to rats. Drug Metab Dispos. 37(12):2290–2298.
- Liu Z, Martin J, Orme L, Seddon B, Desai J, Nicholls W, Thomson D, Porter D, McCowage G, Underhill C, et al. 2018. Gender differences in doxorubicin pharmacology for subjects with chemosensitive cancers of young adulthood. Cancer Chemother Pharmacol. 82(5):887–898.
- Maison T, Ruttanaphan T, Pipattanaporn P, Chuawong P, Bullangpoti V, Pluempanupat W. 2014. Antifeedant activity of crude extracts from stems and leaves of Tadehagi triquetrum (L.) Ohashi and seeds of Phaseolus lathyroides against Helicoverpa armigera Hubner (Lepidoptera: Noctuidae). Commun Agric Appl Biol Sci. 79(2):233–238.
- Millecam J, De Baere S, Croubels S, Devreese M. 2019. In vivo metabolism of ibuprofen in growing conventional pigs: a pharmacokinetic approach. Front Pharmacol. 10:712.
- Ramakrishna R, Bhateria M, Puttrevu SK, Prasad YD, Singh R, Bhatta RS. 2016. A liquid chromatography-tandem mass spectrometry method for the quantitation of actarit in rabbit plasma: application to pharmacokinetics and metabolic stability. J Mass Spectrom. 51(1):69–78.
- Tang AC, Chen XY, Lu QY, Zheng N, Wei YF, Wu XY. 2014. Antihepatotoxic effect of tadehaginoside, extracted from Tadehagi triquetrum (L.), against CCl4-lesioned rats through activating the Nrf2 signaling pathway and attenuating the inflammatory response. Inflammation. 37(4):1006–1014.
- Tao Y, Huang SR, Yan JZ, Cai BC. 2019. Pharmacokinetic study of six triterpenoids of raw and processed Alisma plantago-aquatica in rat plasma by using ultra performance liquid chromatography-tandem mass spectrometry approach. J Chromatogr B Analyt Technol Biomed Life Sci. 1124:323–330.
- US Food and Drug Administration. 2001. Center for Drug Evaluation and Research (CDER). http://www.fda.gov/downloads/Drugs/GuidanceComplianceRegulatoryInformation/Guidances/UCM070107.pdf
- Wang S, Zhang XP, Li X, Liu QB, Zhou Y, Guo P, Dong ZQ, Wu CM. 2019. Phenylpropanoid glucosides from Tadehagi triquetrum inhibit oxLDL-evoked foam cell formation through modulating cholesterol homeostasis in RAW264.7 macrophages. Nat Prod Res. 33(6):893–896.
- Wu JN, Zhang CY, Zhang TT, Zhao D, An N, Li YB, Zhu NL, Wang S, Chen F, Zhang XP. 2015. A new lignan with hypoglycemic activity from Tadehagi triquetrum. Nat Prod Res. 29(18):1723–1727.
- Zabad OM, Samra YA, Eissa LA. 2019. p-Coumaric acid alleviates experimental diabetic nephropathy through modulation of Toll like receptor-4 in rats. Life Sci. 238:116965.
- Zhang X, Chen C, Li Y, Chen D, Dong L, Na W, Wu C, Zhang J, Li Y. 2016. Tadehaginosides A–J, phenylpropanoid glucosides from Tadehagi triquetrum, enhance glucose uptake via the upregulation of PPARγ and GLUT-4 in C2C12 myotubes. J Nat Prod. 79(5):1249–1258.
- Zhang XP, Li HL, Tan YF, Lai WY, Chen F. 2015. Identification of tadehaginoside and its metabolites in rat plasma using LC-MS/MS with selected reaction monitoring. J Hainan Medical Univ. 21:145–147.
- Zhang XP, Wang S, Li YH, Zhao D, An N, Wu JN, Zhang TT, Wu CM, Li YB. 2015. Tadehaginoside modulates lipogenesis and glucose consumption in HepG2 cells. Nat Prod Res. 29(24):2287–2290.