
Abstract
Objectives
To investigate the relationship between self-reported music perception and appreciation and (1) quality of life (QoL), and (2) self-assessed hearing ability in 98 post-lingually deafened cochlear implant (CI) users with a wide age range.
Methods
Participants filled three questionnaires: (1) the Dutch Musical Background Questionnaire (DMBQ), which measures the music listening habits, the quality of the sound of music and the self-assessed perception of elements of music; (2) the Nijmegen Cochlear Implant Questionnaire (NCIQ), which measures health-related QoL; (3) the Speech, Spatial and Qualities (SSQ) of hearing scale, which measures self-assessed hearing ability. Additionally, speech perception was behaviorally measured with a phoneme-in-word identification.
Results
A decline in music listening habits and a low rating of the quality of music after implantation are reported in DMBQ. A significant relationship is found between the music measures and the NCIQ and SSQ; no significant relationships are observed between the DMBQ and speech perception scores.
Conclusions
The findings suggest some relationship between CI users' self-reported music perception ability and QoL and self-reported hearing ability. While the causal relationship is not currently evaluated, the findings may imply that music training programs and/or device improvements that improve music perception may improve QoL and hearing ability.
Introduction
Cochlear implants (CIs) are auditory prosthetic devices that restore hearing to individuals with profound to severe sensorineural hearing impairment via direct electric stimulation of the auditory nerve. While many CI users are able to reach good levels of speech perception in quiet (Blamey et al., Citation2013; Lazard et al., Citation2012) and generally report increased quality of life (QoL) after implantation (Contrera et al., Citation2016; Faber et al., Citation2000; Krabbe et al., Citation2000; Zhao et al., Citation2008), many report music perception and enjoyment to be dissatisfactory (Drennan et al., Citation2015; Fuller et al., Citation2013; Jiam et al., Citation2017; Limb and Roy, Citation2014; McDermott, Citation2004; Philips et al., Citation2012; Prevoteau et al., Citation2018). CIs have been mainly developed and optimized for speech perception. Improving the device for music perception and appreciation remains a challenge, and involves, among other things, an understanding of factors that contribute to music appreciation in CI users.
Earlier research on music perception with CIs has shown that perception of the four basic elements in music – pitch, rhythm, melody and timbre (the quality of sound that make a listener able to discriminate between instruments, or voices with the same pitch) – is less accurate and more variable in CI users compared to normal hearing (NH) listeners (Blamey et al., Citation2013; Lazard et al., Citation2012). This discrepancy is partially due to differences between acoustic and electrical hearing (for a review, see Başkent et al., Citation2016). CI users’ music perception is limited by the coarse spectral resolution (due to the interactions between the stimulation sites in the cochlea) and minimal-to-no transmission of spectro-temporal fine structure information (due to the limitations of electric stimulation of the auditory nerve). As a result, sounds transmitted with a CI mainly retain slowly varying spectro-temporal information but not the spectro-temporal fine structure information (for a review in the context of music, see Limb and Roy, Citation2014; McDermott, Citation2004). The degradations inherent to electric hearing limit CI users’ pitch, melody and timbre perception, where fine structure cues are important (Gfeller et al., Citation2007; Kong et al., Citation2009; Looi et al., Citation2008; Shannon et al., Citation2004). Only rhythm perception appears to be similar between NH and CI listeners (Jiam and Limb, Citation2019; Kong et al. Citation2004), and CI users seem to be able to move to the beat (Phillips-Silver et al., Citation2015).
However, the limited music perception does not necessarily have to limit CI users’ music appreciation. For example, Fuller et al. (Citation2013) have shown that in early-deafened (as a child), late-implanted (as an adult) CI users the subjective music perception, reported to be low, seems not related to the appreciation, reported to be high. The relationship between these music-related factors remains unclear. Self-reported difficulties in music perception and enjoyment has been shown to have a negative impact on the QoL of CI users (Dritsakis et al., Citation2017a). Another study, however, showed a positive correlation between more engagement with music and QoL in CI users (Dritsakis et al., Citation2017b). Therefore, evaluation of CI outcomes in terms of music should be more comprehensively investigated. Investigations should not only evaluate behaviorally measured music perception, but also self-reported perception and enjoyment of music, as music is an acoustic stimulus that can affect the emotional state of the listener both in a positive, but also in a negative manner (Koelsch, Citation2014; Lundqvist et al., Citation2009; McFerran et al., Citation2016; Salimpoor et al., Citation2009, Citation2011; Zatorre and Salimpoor, Citation2013). Music therapy for example has been shown to improve QoL in a number of patient groups, for example in patients with depression (Erkkilä et al., Citation2011; Hilliard, Citation2003; Walworth et al., Citation2008). As such, music therapy might also have a positive effect for CI users, not only for better perception and appreciation of music (Hutter et al., Citation2015), but perhaps also for QoL. Indirectly supporting this idea, and as an example, Fuller et al. (Citation2018) showed a positive effect of music therapy on vocal emotion identification in CI users, and according to Luo et al. (Citation2018) a better perception of emotions may translate to improvement in QoL.
In addition to having a positive effect on emotional state and QoL, musical experience has been shown to have a positive effect on hearing and speech perception abilities in NH listeners. For example, musicians may have better music-related hearing abilities, such as a better pitch and rhythm perception (Besson et al., Citation2007; Chen et al., Citation2008), but also may benefit for voice timbre or vocal identification (Chartrand and Belin, Citation2006; Dmitrieva et al., Citation2006; Thompson et al., Citation2004). Musical experience might also be beneficial for speech perception, for example for speech perception in noise (Parbery-Clark et al., Citation2009; Zhang et al., Citation2019), or in competing speech (Başkent and Gaudrain, Citation2016) as well as a higher emotion identification while listening to CI simulations (Gfeller et al., Citation2000; Fuller et al., Citation2012). A transfer from music training to speech perception might be related to a better perception of pitch in musicians, suggesting a different sound processing in the auditory system at the lower levels. Another reason why musicians might be better at perceiving music and speech might be found in a difference at higher levels processing in the auditory system, such as a better use of the auditory working memory and attention (Barrett et al., Citation2013; Besson et al., Citation2011; Bialystok and Depape, Citation2009; Moreno et al., Citation2011).
It must be noted, however, that some other studies were not able to show musician effect for voiced and whispered speech, for masked speech, or speech in ecologically valid situations (Boebinger et al., Citation2015; Deroche et al., Citation2017; Madsen et al., Citation2019; Ruggles et al., Citation2014). As the results are mixed, the musician effect in NH listeners remains a subject of on-going interest, as is the effect of musical experience in CI users. While musical training and involvement before cochlear implantation seems to not affect CI users’ post-implantation speech perception performance (Fuller et al., Citation2012), music training with the CI seems to improve vocal emotion perception and speech perception (Firestone et al., Citation2020; Fuller et al., Citation2018; Lo et al., Citation2015; Patel, Citation2014).
Two studies have investigated CI users’ self-reported perception and enjoyment of music and their association with QoL and speech perception, Lassaletta et al. (Citation2007) and Philips et al. (Citation2012), respectively. Lassaletta et al. (Citation2007) used a music questionnaire and a generic QoL questionnaire [Glasgow Benefit Inventory (GBI), which assesses patient benefit after otolaryngological procedures; Robinson et al., Citation1996] in 52 CI recipients. They found that the self-reported quality of music was correlated with the time spent listening to music with the CI, and with QoL. However, no data on speech perception was collected, and therefore it was unclear if and how music enjoyment related to speech perception performance. Philips et al. (Citation2012) investigated the relationship between self-reported quality/enjoyment of music and speech perception. Forty CI users answered a newly developed questionnaire on music appreciation and 15 of these participants were subsequently tested for speech perception in quiet and in noise. Music quality and enjoyment were significantly correlated with speech reception thresholds (SRTs) in quiet and in noise. However, as speech perception scores were available only from 15 out of 40 participants (38%), the generalizability of the findings was limited.
The present study investigated potential relationships among music listening habits, self-reported perception of music, QoL, self-reported hearing ability, and behaviorally measured speech perception in a large sample (N = 98) of postlingually deafened CI users, covering a wide range of adult age (18–85 yrs). We hypothesized that music listening habits, music quality, and music perception would be significantly related with QoL, self-reported hearing ability, and speech perception scores. Questionnaires were used to investigate music listening habits, perceived quality of music, and self-assessed music perception, as well as health-related QoL and self-assessed hearing ability. Behaviorally measured phoneme-in-word recognition scores were used to quantify speech perception.
Materials and methods
Study population
The data were originally collected as part of the PhD Thesis of the first author (Fuller, Citation2016), partially reported in Fuller et al. (Citation2012), and re-analyzed for the present study. Two hundred fourteen CI users, selected from patients implanted and/or monitored at the University Medical Center Groningen, were sent three questionnaires. The inclusion criteria were based on: age at the time of the study (older than 18 years), age at the onset of profound hearing loss (6 years or older to ensure deafness after sensitive period of language development, i.e. postlingual deafness; Goorhuis-Brouwer and Schaerlaekens, Citation2000) and more than one year of CI experience. Additionally, all CI users were native Dutch speakers, to be able to fill the questionnaires. To include as many patients as possible, and thus to study a general and representative CI population, etiology and speech perception performance were not used as inclusion criteria, nor the upper age limit. Ninety-eight CI users (46% of all CI users who were sent a request) provided a reply. The demographics of the study participants are shown in . The levels of education refer to the highest completed educational level: lower refers to elementary school only, middle refers to middle school or higher, higher refers to at least a bachelor’s degree. Except for one CI user, all were unilaterally implanted. A comparison was made between the demographics of respondents and non-respondents to ensure that the respondents were indeed a good representation of the larger CI population who were originally sent the questionnaires. Confirming this, no significant differences were observed for age (t-test: t = −1.038, p = 0.301), CI experience (t = −1,314 p = 0.191), and gender (Chi-square-test: χ2 0.041, p = 0.840).
Table 1 Demographics of the study participants. n refers to number of participants in each table and figure
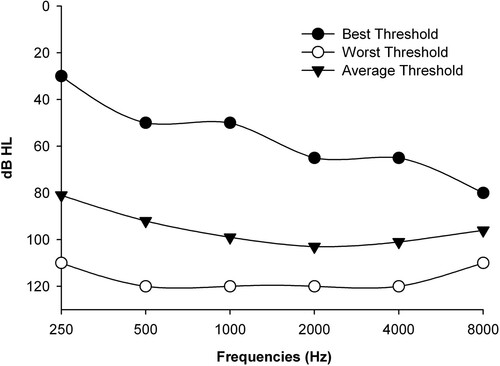
To characterize acoustic hearing within our study population, the best, average and worst residual acoustic hearing thresholds measured for the contralateral ear before implantation for our study population are shown in . Even though some CI users show useful acoustic hearing at some frequencies, the average thresholds indicate severe hearing loss. To not complicate an already large comprehensive study further, and because the participants were a good representation of typical CI users, it was decided not to additionally analyze the potential effects of residual hearing.
Figure 1 Best, worst and average acoustic hearing thresholds measured in the contra-lateral ear before cochlear implantation, as were available from patient charts of 92 CI participants.
The study was approved by the Medical Ethical Committee of the University Medical Center Groningen. Detailed information about the study was provided to the participants and written informed consent was obtained. Participation was purely voluntary, and no financial reimbursement was provided.
Procedures
Dutch Musical Background Questionnaire
The first questionnaire, the Dutch Musical Background Questionnaire (DMBQ), is a translated and edited version of the Iowa Musical Background Questionnaire (IMBQ) developed by Gfeller et al. (Citation2000). For the present study only the sections regarding music listening habits (before and after implantation), music quality with the implant, and self-assessed perception of basic elements of music with the implant were used. The numbers of participants (n) for specific sections will be indicated explicitly in text, figures, and table, as not all 98 participants filled all sections of all questionnaires. The results of parts of the DMBQ with our study population have been published before, see Fuller et al. (Citation2012, Citation2013, Citation2019).
Music listening habits
The first part of the DMBQ assessed music listening habits. Music listening habits before and after cochlear implantation were scored in two items. The first item evaluated the interest in listening to music via the statement: I would describe myself as a person who often chooses to listen to music. Respondents indicated their agreement with the statement on a one (‘strongly disagree’) to four (‘strongly agree’) rating scale. The second item scored the hours spent listening to music per week and was scored on a one to four rating scale: one = 0–2 h, two = 3–5 h, three = 6–8 h, and four = 9 or more hours. Adding the scores from the two items, two cumulative scores were calculated for music listening habits: one pre-implantation and one post-implantation. The total score thus ranged from 2 to 8. Seventy-four participants completed this part of the DMBQ.
Subjective quality of music
The second part of the DMBQ assessed music quality with the CI. The recipients were asked to indicate how music sounds under the best conditions with their CI. Seven visual analogue scales (VASs), each ranging from 0 (worst) to 100 (best) were used. The extremes of each VAS were coupled to opposite adjective descriptors (unpleasant-pleasant; mechanical-natural; fuzzy-clear; does not sound like music-sounds like music; complex-simple; difficult to follow-easy to follow; dislike very much-like very much). An overall mean score between 0 and 100, calculated by averaging across the seven scales, was used to quantify the subjective quality of music. Former studies using the IMBQ merely reported the mean scores for the adjective pairs. In this study an overall score was used which was not psychometrically validated. Ninety-seven participants completed this section.
Elements of music
The third part of the DMBQ investigated the ability to perceive the elements of music (rhythm, melody and timbre), to differentiate vocalists, and to follow the lyrics of a song. The questions were scored on a seven-point scale ranging from 1 (never) to 7 (always). The values 1–3 thus indicated a ‘negative’ ability, 4 a ‘neutral’ ability, and 5–7 a ‘positive’ ability. The specific questions were:
Can you hear the difference between singing and speaking?
Are you able to differentiate between a male and a female vocalist?
Are you able to follow the rhythm of a music piece?
Are you able to recognize the melody of a music piece?
Are you able to differentiate the instruments in a piece of music?
Can you follow the lyrics of a song?
A total mean score between 1 and 7 was calculated by averaging the scores from all six questions used to quantify the ability to perceive music elements. Eighty-seven participants completed this section.
Nijmegen Cochlear Implant Questionnaire
The second questionnaire, the Nijmegen Cochlear Implant Questionnaire (NCIQ), is a validated CI specific, health-related QoL questionnaire (Hinderink et al., Citation2000). The NCIQ has three domains in which six subdomains are allocated: physical functioning (sound perception-basic, sound perception-advanced, and speech production), social functioning (activity, social functioning), and psychological functioning (self-esteem). Scores range from 0 (worst) to 100 (best) per domain. A total mean score between 0 and 100 was calculated by averaging across all six domains. Ninety-two participants completed the NCIQ.
Speech, Spatial and Qualities Questionnaire
The third questionnaire, the Speech, Spatial and Qualities of hearing scale (SSQ), is a self-assessed measure of hearing performance, validated for hearing-impaired listeners and CI users (Gatehouse and Noble, Citation2004). The Dutch translated version 3.1.2 (2007) was used in this study (van Wieringen et al., Citation2011).Footnote1 The questionnaire quantifies the daily life abilities for speech perception and spatial hearing and covers three domains of hearing: speech, spatial, and other qualities. Respondents rated themselves with scores varying from 0 (worst) to 10 (best). A total mean score between 0 and 10 was calculated by averaging scores across all three domains. Seventy-three participants completed the SSQ.
Recognition of phonemes in words
Recognition of phonemes in words was measured during the regular outpatient visits by trained clinical audiologists following the clinical procedures of speech audiometry. Meaningful and commonly used Dutch consonant–vowel-consonant words, spoken by a female speaker (e.g. bus) taken from the Nederlandse Vereniging van Audiologie (NVA) corpus (Bosman and Smoorenburg, Citation1995) were presented at 65 and/or 75 dB SPL in quiet. One list of 12 words was played per dB-level in free field, using an audiometer (Audiometer Allé DK 5500, Middelfart, Denmark) via a power amplifier (AP 12 Ritmton; Samsun, Turkey) with the patient facing the speaker (DALI, Interacoustics; Lanarkshire, Scotland) at 2.5 m distance in an audiometry booth. The ratio of correctly repeated phonemes to the total number of phonemes presented was used to calculate the percent correct score. Speech perception scores, measured with this clinical protocol, were available in the medical records for 71 participants at 65 dB SPL and for 72 participants at 75 dB SPL.
Statistics
Multiple linear regression analyses were used to compare results from NCIQ, SSQ and speech perception to the music measures from the DMBQ. Spearman correlation coefficients were used to compare the outcomes of the NCIQ, SSQ, speech scores and DMBQ. A level of p < 0.05 (two-tailed) was considered significant. Statistical analyses were run using SPSS 20.
Results
Dutch Musical Background Questionnaire
Music listening habits
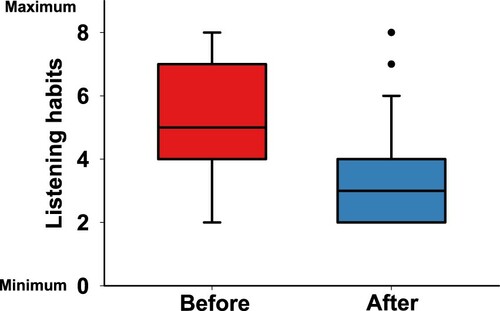
shows the results of the music listening habits from the DMBQ for 74 participants. The total scores of the music listening habits before and after implantation ranging from 2 (worst) to 8 (best) are shown. shows a significant decline in music listening habits after implantation (p < 0.000, z −5.673, by Wilcoxon signed rank test). The interest in listening to music and the hours spent listening to music were significantly, moderately positively correlated before (r2 = 0.289, p < 0.001) and after implantation (r2 = 0.321, p < 0.001).
Subjective quality of music
Figure 2 Self-reported music listening habits before (left box) and after implantation (right box), shown from 74 CI users and as measured by DMBQ. The total scores ranged from 2 (minimum music listening habits) to 8 (maximum music listening habits). The 25th–75 th percentile is presented by the boxes, the median values by the lines, and the 10th–90 th percentile by the error bars. The dots are the outliers.
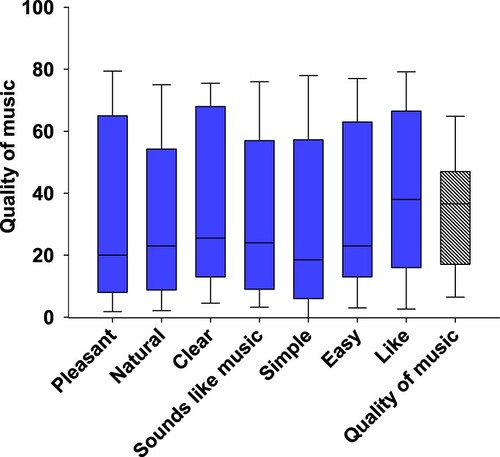
shows the average results (in 97 respondents) for the subjective quality of music with the CI on a 0 (worst) to 100 (best) scale, for the individual adjectives (blue boxes), as well as the total quality of music (white dashed box). All median scores were below 50.
Elements of music
Figure 3 The self-reported quality of music, scored between 0 (worst) and 100 (best), shown as averaged (rightmost hatched box) and shown separately for the seven descriptor pairs (blue boxes), shown for N = 97 of the DMBQ. The combined total score, averaged across the seven scales, is shown by the rightmost box. The boxes represent the distributions as described in .
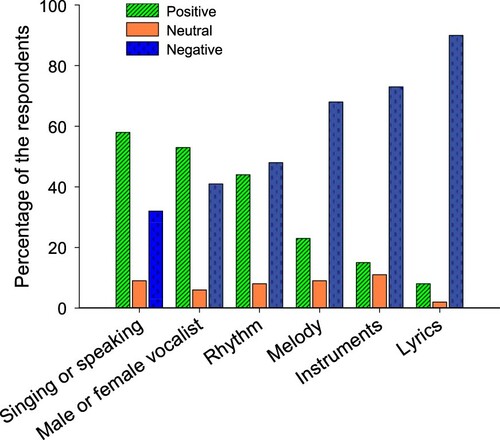
shows the results of the subjective perception of the elements of music, reported in percentages of the participants (N = 87). The majority of the respondents reported to be able to differentiate between singing and speaking (58%) and between a female or male vocalist (53%). From the structural elements of music (i.e. rhythm, melody and timbre) the CI recipients reported to be best able to recognize rhythm. Forty-four percent of the recipients were able to follow the rhythm, 23% recognize the melody and 15% identify musical instruments. The recipients reported the lyrics as the most problematic of these elements to follow. None (0%) of the CI users was always able to follow the lyrics and 44% were never able to follow the lyrics.
Nijmegen Cochlear Implant Questionnaire
Figure 4 The differentiation and recognition of the elements of music, shown in percentages of the respondents who reported a positive (i.e. 5–7), neutral (i.e. 4), or negative ability (i.e. 1–3), shown for N = 87 as measured by DMBQ.
shows the mean scores per domain and the total score for the NCIQ for N = 92 respondents. There was a wide range in total NCIQ scores, ranging from 20 to 87, with a mean of 62, on a 0 (minimum health-related QoL) to 100 (maximum health-related QoL) scale.
C. Speech, Spatial and Qualities Questionnaire
Table 2 Mean scores and standard deviations of the domains and total scores of the NCIQ (between 0 and 100)
shows the scores per domain and the total score for the SSQ for N = 73. The total SSQ scores ranged from 0 to 7.6, with a mean of 3.5, on a 0 (no hearing ability) to 10 (maximum hearing ability) scale.
D. Speech perception scores
Table 3 Mean scores and standard deviations of the domains and total scores of the SSQ (between 0 and 10)
Mean recognition of phonemes in words was 55% correct (range: 0–97) at 65 dB SPL and 70% correct (range: 0–97) at 75 dB SPL.
E. Regression analyses
Because not all participants completed all questionnaires, separate multiple linear regression analyses were performed between the DMBQ music measures and the NCIQ, SSQ, and speech measures (). Since the overlapping number of participants differed between different comparison pairs, these are also explicitly mentioned in the table for each comparison (n).
Table 4 Multiple linear regression results from comparisons between NCIQ, SSQ, phoneme-in-word recognition scores (speech 65; speech75) and the DMBQ measures, listening habits pre- and post-CI, quality of the sound of music and elements of music. N = Number of respondents. Entries marked with gray show the significant outcomes
Significant relationships were observed between the DMBQ and the NCIQ, and the DMBQ and SSQ measures (p < 0.05 in both cases). Because the number of participants differed across measures, it was not possible to strictly correct for family-wise error associated with multiple comparisons. However, using a Bonferroni adjustment to the significance level (0.05/4 = 0.0125), the significant relationships persisted between the DMBQ and the NCIQ and the DMBQ and SSQ measures. From the three subdivision of the DMBQ only the perception of the elements of music was found to contribute significantly for the regression with NCIQ and SSQ (p = 0.001 in both cases). There was no significant relationship between speech perception outcomes for 65 and 75 dB and the music measures (p > 0.05 in both cases).
Discussion
In the present study, self-reported music perception (DMBQ) in a large sample of postlingually deafened adult CI users, covering the entire adult age range (18–85yrs), was investigated and compared to self-reported QoL (NCIQ), self-reported hearing ability (SSQ), and behaviorally measured speech perception (phoneme-in-word recognition measured at 65 and 75 dB SPL). We hypothesized that better music listening habits, better perceived music quality, and better perception of music would, individually or together, be associated with the NCIQ, SSQ, and speech perception. While significant relationships were found between the music measures and the NCIQ and SSQ, these were largely driven by perception of elements of music; no significant relationships were observed between the DMBQ and speech perception scores.
Music
In accordance with literature, a decline in the music listening habits after implantation has been observed (Frederigue-Lopes et al., Citation2015; Gfeller et al., Citation2000; Lassaletta et al., Citation2007; Limb and Roy, Citation2014; Looi and She, Citation2010; Migirov et al., Citation2009; Mirza et al., Citation2003; Philips et al., Citation2012). In this and the previous studies, music quality perceived with the CI was rated negatively in general.
For music perception with the CI, participants reported that they were best able to differentiate between singing and speaking, and between a female and a male vocalist. The latter was scored even more positively than the ability to follow the rhythm. This is surprising because the differentiation between a female or a male vocalist depends on pitch, timbre, and voice cues. CI users’ perception of pitch, voice cues, timbre and voice gender recognition have been shown to be difficult (Fu et al., Citation2004; Fuller et al., Citation2014; Gaudrain and Başkent, Citation2018; Gfeller et al., Citation2007; Kovačić and Balaban, Citation2009; Massida et al., Citation2013). Consistent with our findings, Philips et al. (Citation2012), using questionnaires, reported that 53% of CI subjects indicated they were able to distinguish between male and female voices (compared to 58% in this study). The percentage of CI users that is able to follow the rhythm ranges from 30% (Philips et al. Citation2012) to 40% (Calvino et al., Citation2016) were able to follow the rhythm (compared to 44% in this study). Thus, while CI users seem to be able to follow simple rhythms in behavioral studies (Kong et al., Citation2004), they subjectively report they are unable to follow the rhythm in musical pieces. This difference could be due to the ‘rhythm-only excerpts’ used in behavioral studies compared to the overall perception of rhythm music encountered in daily life (Drennan and Rubinstein, Citation2008; Gfeller et al., Citation2007; Kong et al., Citation2004; Petersen et al., Citation2020; Won et al., Citation2007). It might be that subjectively rhythm perception is influenced by other elements of daily life music experiences, such as the lyrics or the instruments playing, and might therefore be judged as difficult to perceive.
From the basic elements of music – pitch, rhythm, melody and timbre – rhythm was reported to be perceived best, followed by timbre, and subsequently by melody. This is consistent with the results of both behavioral studies and subjective questionnaires (Drennan and Rubinstein, Citation2004; Galvin et al., Citation2009; Gfeller et al., Citation2007; Limb, Citation2006; Limb and Roy, Citation2014; Philips et al., Citation2012). It was somewhat surprising that the present participants rated lyric perception in music to be most problematic, with 44% reporting that they were never able to follow the lyrics. Previous CI studies have reported that lyrics were beneficial for perception and recognition of music (Shannon et al., Citation2004). Again, being able to follow the lyrics of short musical excerpts used for behavioral testing may be different than a more general perception of lyrics in music encountered in everyday life. In some ways, the ability to follow lyrics is akin to the intelligibility of speech in music. Consistent with our findings, speech intelligibility in background music has been observed to be poorer in CI users than in NH listeners (Eskridge et al., Citation2012).
Music versus quality of life
The perception of music elements was the only component of the DMBQ that was predictive of QoL, as measured with the NCIQ. Music listening habits before/after implantation and music quality were not related to QoL or the quality of the sound of music. Fuller et al. (Citation2012) similarly found no significant relationship between musical background before implantation and health-related QoL after implantation in the same groups of participants.
In contrast to our findings, Lassaletta et al. (Citation2007) did show a significant positive association between music listening habits, music quality, and QoL in 52 adult CI users. A higher music quality was related to a higher QoL, as was listening to music more post implantation. In the study by Lassaletta et al. however different questionnaires were used in a smaller population compared to the present study. In Dritsakis et al. (Citation2017a) a focus group of 30 adult CI users reported that music contributes to parts of QoL such as physical, psychological, and social well-being, which is somewhat in line with our finding of a relation between the elements of music and QoL. The same study also showed, however, that the difficulties CI users experience with listening to music or enjoying music relate to a lower QoL, a finding the current study does not support. Another study by the same group showed that when CI users’ music engagement was higher this could influence activity limitations as a result of physical health, a part of QoL (Dritsakis et al., Citation2017a). Calvino et al. Citation2016 did not find a relationship between music perception, television and radio understanding, and telephone use and QoL. Zhao et al. (Citation2008) found that improvement in QoL was related to different variables for individual CI users. Thirty-eight percent of CI users reported speech communication, whereas 25% of CI users enjoyment of music to be a key determinant of QoL. It is difficult to interpret all these relations in terms of causality. Music perception and QoL in CI users may both be influenced by device-related factors (e.g. optimal electrode placement, high quality of electrode-nerve signal transmission, etc.) and/or patient-related factors (etiology, health of the spiral ganglia, cognitive/psychological/personality-related differences, etc.).
Music versus hearing abilities and speech perception
Perception of music elements was the only component of the DMBQ that was related with self-reported hearing ability, as measured with the SSQ. Behaviorally measured scores of speech perception (as measured by phoneme recognition in quiet at 65 and 75 dB) were not significantly related to any of the components of the DMBQ. The lack of relation between speech and music perception may be due to differing requirements of fidelity in signal transmission via the CI. For example, while four spectral channels may be adequate for speech recognition in quiet, many more channels are required for music perception (Shannon et al., Citation2004). Thus, good speech performers may have rated music perception poorly, or that their music listening habits involved less time than speech perception, which is a more present listening demand in everyday life for many people. Speech recognition in noise or pitch-based speech tasks (e.g. voice gender categorization, vocal emotion recognition, etc.) may produce stronger relations to music perception. Philips et al. (Citation2012) reported that enjoyment of music and quality were correlated with CI users’ speech reception thresholds in quiet and in noise. Won et al. (Citation2007, Citation2010) found that word recognition in quiet was related to perception of specific music elements of melody, timbre, and pitch, suggesting that improvements in CI signal processing that improve speech perception might also improve music perception, and vice versa. Improved music perception via music training may benefit speech perception, as music experience has been shown to translate to better speech performance in normal hearing in some studies (Başkent and Gaudrain Citation2016; Parbery-Clark et al., Citation2009).
Concluding, our study reports significant relationships between the music measures to QoL and self-reported hearing abilities in a large sample of postlingually deafened CI users from a wide range of ages. These findings imply the possibility that improving music perception might have a positive effect on QoL and hearing abilities in CI users, two important outcome factors apart from speech perception.
Disclaimer statement
Contributors None.
Funding This study was supported by: a Mandema Stipendium from the University Medical Center Groningen and the University of Groningen; an otological neurotological stipendium from the Heinsius-Houbolt Foundation; and the VICI grant No. 918-17-603 from the NWO (Netherlands Organisation for Scientific Research) and the ZonMw (Netherlands Organization for Health Research and Development).
Conflicts of interest None.
Ethics approval None.
Acknowledgements
We would like to thank: All CI participants. Astrid van Wieringen and Wouter Dreschler for the SSQ. Emanuel Mylanus for the NICQ. Kate Gfeller for the IMBQ. Mynke Trommelen for the DMBQ.
Additional information
Notes on contributors
Christina Fuller
Dr. Christina Fuller is ENT surgeon at the Treant ZorggroepHoogeveen and post-doctoral researcher investigating cochlear implants and music at the University Medical Center Groningen, both in the Netherlands.
Rolien Free
Dr. Rolien Free is a neuro-otoligic ENT surgeon and researcher interested in tinnitus, auditory brainstem implants and cochlear implants at the University Medical Center Groningen, the Netherlands.
Bert Maat
Ir. Bert Maat is audiologist and researcher with special interest in cochlear implants, otoacoustic emisions and auditory brain stem implants at the University Medical Center Groningen, the Netherlands.
Deniz Başkent
Prof. Dr. Ir. Deniz Başkent is professor of speech perception in hearing impaired, and users of hearing aids and cochlear implant users at the University Medical Center Groningen, the Netherlands.
Notes
1 Translated by ExORL, KULeuven.
References
- Barrett, K.C., Ashley, R., Strait, D.L., Kraus, N. 2013. Art and science: how musical training shapes the brain. Frontiers in Psychology, 16(4): 713.
- Başkent, D., and E. Gaudrain. 2016. “Musician advantage for speech-on-speech perception.” The Journal of the Acoustical Society of America 139 (3): EL51–56. doi:https://doi.org/10.1121/1.4942628.
- Başkent, D., E. Gaudrain, T. N. Tamati, and A. Wagner. 2016. Perception and psychoacoustics of speech in cochlear implant users. In: A. T. Cacace, E. de Kleine, A. Holt, and P. van Dijk, (eds.). Scientific Foundations of Audiology.
- Besson, M., Chobert, J., Marie, C. 2011. Transfer of Training between music and speech: common processing, attention, and memory. Frontiers in Psychology, 2: 94. doi:https://doi.org/10.3389/fpsyg.2011.00094.
- Besson, M., Schon, D., Moreno, S., Santos, A., Magne, C. 2007. Influence of musical expertise and musical training on pitch processing in music and language. Restorative Neurology and Neuroscience, 25(3–4): 399–410.
- Bialystok, E., Depape, A.M. 2009. Musical expertise, bilingualism, and executive functioning. Journal of Experimental Psychology, Human Perception and Performance, 35: 565–574.
- Blamey, P., Artieres, F., Baskent, D., Bergeron, F., Beynon, A., Burke, E., Dillier, N., et al. 2013. Factors affecting auditory performance of postlinguistically deaf adults using cochlear implants: an update with 2251 patients. Audiology & Neuro-Otology, 18(1): 36–47. doi:https://doi.org/10.1159/000343189.
- Boebinger, D., Evans, S., Rosen, S., Lima, C.F., Manly, T., Scott, S.K. 2015. Musicians and non-musicians are equally adept at perceiving masked speech. The Journal of the Acoustical Society of America, 137(1): 378–387.
- Bosman, A.J., Smoorenburg, G.F. 1995. Intelligibility of Dutch CVC syllables and sentences for listeners with normal hearing and with three types of hearing impairment. Audiology, 34: 260–284.
- Calvino, M., et al. 2016. Using the HISQUI29 to assess the sound quality levels of Spanish adults with unilateral cochlear implants and no contralateral hearing. European Archives of Otorhinolaryngolgy, 273: 2343–2353. doi:https://doi.org/10.1007/s00405-015-3789-0.
- Chartrand, J.P., Belin, P. 2006. Superior voice timbre processing in musicians. Neuroscience Letters, 405(3): 164–167. doi:https://doi.org/10.1016/j.neulet.2006.06.053.
- Chen, J.L., Penhune, V.B., Zatorre, R.J. 2008. Listening to Musical rhythms recruits motor regions of the brain. Cerebral Cortex, 18 (12): 2844–2854. doi:https://doi.org/10.1093/cercor/bhn042.
- Contrera, K.J., Betz, J.L., Li, L., Blake, C.R., Sung, Y.K., Choi, J.S., Lin, F.R. 2016. Quality of Life after intervention with a cochlear implant or hearing aid: quality of life after hearing loss treatment. The Laryngoscope, 126(9): 2110–2115. doi:https://doi.org/10.1002/lary.25848.
- Deroche, M.L.D., Limb, C.J., Chatterjee, M., Gracco, V.L. 2017. Similar abilities of musicians and non-musicians to segregate voices by fundamental frequency. The Journal of the Acoustical Society of America, 142(4): 1739–1755. doi:https://doi.org/10.1121/1.5005496.
- Dmitrieva, E.S., Ya Gel’man, V., Zaitseva, K.A., Orlov, A.M. 2006. Ontogenetic features of the psychophysiological mechanisms of perception of the emotional component of speech in musically gifted children. Neuroscience and Behavioral Physiology, 36(1): 53. doi:https://doi.org/10.1007/s11055-005-0162-6.
- Drennan, W.R., Oleson, J.J., Gfeller, K., Crosson, J., Driscoll, V.D., Won, J.H., et al. 2015. Clinical evaluation of music perception, appraisal and experience in cochlear implant users. International Journal of Audiology, 54(2): 114–123.
- Drennan, W.R., Rubinstein, J.T. 2008. Music perception in cochlear implant users and its relationship with psychophysical capabilities. Journal of Rehabilitation Research and Development, 45: 779–789. doi:https://doi.org/10.1682/jrrd.2007.08.0118.
- Dritsakis, G., van Besouw, R.M., O’ Meara, A. 2017a. Impact of music on the quality of life of cochlear implant users: a focus group study. Cochlear ImplantS International, 18(4): 207–215. doi:https://doi.org/10.1080/14670100.2017.1303892.
- Dritsakis, G., van Besouw, R.M., Kitterick, P., Verschuur, C.A. 2017b. A music-related quality of Life measure to guide music rehabilitation for adult cochlear implant users. American Journal of Audiology, 26: 268–282. doi:https://doi.org/10.1044/2017_AJA-16-0120.
- Erkkilä, J., Punkanen, M., Fachner, J., Ala-Ruona, E., Pöntiö, I., Tervaniemi, M., et al. 2011. Individual music therapy for depression: randomised controlled trial. British Journal of Psychiatry, 199(2): 132–139. doi:https://doi.org/10.1192/bjp.bp.110.085431.
- Eskridge, E.N., Galvin, J.J., Aronoff, J.M, Li, T., Fu, Q.J. 2012. Speech perception with music maskers by cochlear implant users and normal-hearing listeners. Journal of Speech, Language, and Hearing Research: JSLHR, 55: 800–810. doi:https://doi.org/10.1044/1092-4388(2011/11-0124).
- Faber, E., Aksel, M., Grøntved, C. 2000. Cochlear implantation and change in quality of life. Acta Oto-Laryngologica, 120(543): 151–153.
- Firestone, G.M., et al. 2020. A preliminary study of the effects of attentive music listening on cochlear implant users’ speech perception, quality of life, and behavioral and objective measures of frequency change detection. Frontiers in Human Neuroscience, 14: 110. doi:https://doi.org/10.3389/fnhum.2020.00110.
- Fu, Q.J., Chinchilla, S., Galvin, J.J. 2004. The role of spectral and temporal cues in voice gender discrimination by normal-hearing listeners and cochlear implant users. Journal of the Association for Research in Otolaryngology, 5: 253–260. doi:https://doi.org/10.1007/s10162-004-4046-1.
- Fuller, C., Başkent, D., Free, R. 2019. Early deafened, late implanted cochlear implant users appreciate music more than and identify music as well as postlingual users. Frontiers in Neuroscience, 13: 1050. doi:https://doi.org/10.3389/fnins.2019.01050.
- Fuller, C.D., Gaudrain, E., Clarke, J.N., Galvin, J.J., Fu, Q.J., Free, R.H., Başkent, D. 2014. Gender categorization is abnormal in cochlear implant users. Journal of the Association for Research in Otolaryngology : JARO, 15(6): 1037–1048.
- Fuller, C.D. 2016. “The effect of music on auditory perception in cochlear-implant users and normal hearing listeners.” Rijksuniversiteit Groningen.
- Fuller, C.D., Free, R.H., Maat, B., Başkent, D. 2012. Musical Background not associated with self-perceived hearing performance or speech perception in postlingual Cochlear-Implant users. The Journal of the Acoustical Society of America, 132(2): 1009–1016.
- Fuller, C.D., Mallinckrodt, L., Maat, B., Başkent, D., Free, R. 2013. Music and quality of life in early-deafened late-implanted adult cochlear implant users. Otology & Neurotology : Official Publication of the American Otological Society, American Neurotology Society [and] European Academy of Otology and Neurotology, 34(6): 1041–1047.
- Fuller, C.D., Galvin, J.J., Maat, B., Başkent, D., Free, R.H. 2018. Comparison of two music training approaches on music and speech perception in cochlear implant users. Trends in Hearing, 22(January). doi:https://doi.org/10.1177/2331216518765379.
- Frederigue-Lopes, N.B., Bevilacqua, M.C., Costa, O.A. 2015. Munich music questionnaire: adaptation into Brazilian Portuguese and application in cochlear implant users. CoDAS, 27: 13–20.
- Galvin, J.J., Fu, Q.J., Shannon, R.V. 2009. Melodic contour identification and music perception by cochlear implant users. Annals of the New York Academy of Sciences, 1169: 518–533. doi:https://doi.org/10.1111/j.1749-6632.2009.04551.x.
- Gatehouse, S., Noble, W. 2004. The speech, spatial and qualities of hearing scale (SSQ). International Journal of Audiology, 43: 85–99.
- Gaudrain, E., Başkent, D. 2018. Discrimination of voice pitch and vocal-tract length in cochlear implant users. Ear and Hearing, 39 (2): 226–237. doi:https://doi.org/10.1097/AUD.0000000000000480.
- Gfeller, K., Christ, A., Knutson, J.F., Witt, S., Murray, K.T., Tyler, R.S. 2000. Musical backgrounds, listening habits, and aesthetic enjoyment of adult cochlear implant recipients. Journal of the American Academy of Audiology, 11(7): 390–406.
- Gfeller, K., Turner, C., Oleson, J., Zhang, X., Gantz, B., Froman, R., Olszewski, C. 2007. Accuracy of cochlear implant recipients on pitch perception, melody recognition, and speech reception in noise. Ear and Hearing, 28(3): 412–423.
- Goorhuis-Brouwer, S.M., Schaerlaekens, A.M. 2000. Taalpathologie en Taaltherapie bij Nederlandssprekende Kinderen [Handbook language development, language pathology and language therapy in Dutch speaking children]. Utrecht: De Tijdstroom.
- Hilliard, R.E. 2003. The effects of music therapy on the quality and length of life of people diagnosed with terminal cancer. Journal of Music Therapy, 40(2): 113–137.
- Hinderink, J.B., Krabbe, P.F., Broek, P. 2000. Development and application of a health-related quality-of-life instrument for adults with cochlear implants: the Nijmegen cochlear implant questionnaire. Official Journal of American Academy of Otolaryngology-Head and Neck Surgery, 123: 756–765.
- Hutter, E., Argstatter, H., Grapp, M., Plinkert, P.K. 2015. Music Therapy as specific and complementary training for adults after cochlear implantation: a pilot study. Cochlear Implants International, 16(sup3): S13–S21. doi:https://doi.org/10.1179/1467010015Z.000000000261.
- Jiam, N.T., Caldwell, M.T., Limb, C.J. 2017. What does music sound like for a cochlear implant user? Otology & Neurotology, 38(8): e240–e247. doi:https://doi.org/10.1097/MAO.0000000000001448.
- Jiam, N.T., Limb, C.J. 2019. Rhythm processing in cochlear implant−mediated music perception. Annals of the New York Academy of Sciences, 1453: 22–28. doi:https://doi.org/10.1111/nyas.14130.
- Koelsch, S. 2014. Brain correlates of music-evoked emotions. Nature Reviews Neuroscience, 15: 170–180. doi:https://doi.org/10.1038/nrn3666.
- Kong, Y.Y., Cruz, R., Jones, J.A., Zeng, F.G. 2004. Music perception with temporal cues in Acoustic and electric hearing. Ear and Hearing, 25(2): 173–185.
- Kong, Y.Y., Deeks, J.M., Axon, P.R., Carlyon, R.P. 2009. Limits of temporal pitch in cochlear implants. The Journal of the Acoustical Society of America, 125(3): 1649–1657.
- Kovačić, D., Balaban, E. 2009. Voice Gender perception by Cochlear implanteesa. The Journal of the Acoustical Society of America, 126(2): 762–775.
- Krabbe, P.F.M., Hinderink, J.B., van den Broek, P. 2000. The effect of cochlear implant use in postlingually deaf adults. International Journal of Technology Assessment in Health Care, 16(3): 864–873.
- Lassaletta, L., Castro, A., Bastarrica, M., Perez-Mora, R., Madero, R., De Sarria, J., Gavilan, J. 2007. Does music perception have an impact on quality of life following cochlear implantation? Acta Oto-Laryngologica, 127(7): 682–686.
- Lazard, D.S., Vincent, C., Venail, F., Van de Heyning, P., Truy, E., Sterkers, O., Skarzynski, P.H., et al. 2012. Pre-, per- and postoperative factors affecting performance of postlinguistically deaf adults using cochlear implants: a new conceptual model over time. PloS One, 7(11): e48739.
- Limb, C.J. 2006. Structural and functional neural correlates of music perception. The Anatomical Record Part A: Discoveries in Molecular, Cellular, and Evolutionary Biology, 288A: 435–446. doi:https://doi.org/10.1002/ar.a.20316.
- Limb, C.J., Roy, A.T. 2014. Technological, biological, and acoustical constraints to music perception in cochlear implant users. Hearing Research, 308(February): 13–26. doi:https://doi.org/10.1002/ar.a.20316.
- Lo, C.Y., McMahon, C.M., Looi, V., Thompson, W.F. 2015. Melodic contour training and its effect on speech in noise, consonant discrimination, and prosody perception for cochlear implant recipients. Behavioural Neurology, 2015: 352869.
- Looi, V., McDermott, H., McKay, C., Hickson, L. 2008. Music perception of cochlear implant users compared with that of hearing aid users. Ear and Hearing, 29(3): 421–434.
- Looi, V., She, J. 2010. Music perception of cochlear implant users: a questionnaire, and its implications for a music training program. International Journal of Audiology, 49: 116–128. doi:https://doi.org/10.3109/14992020903405987.
- Lundqvist, L., Carlsson, F., Hilmersson, P., Juslin, P.N. 2009. Emotional responses to music: experience, expression, and physiology. Psychology of Music, 37(1): 61–90. doi:https://doi.org/10.1177/0305735607086048.
- Luo, X., A. Kern, and K.R. Pulling. 2018. “Vocal emotion recognition performance predicts the quality of life in adult cochlear implant users.” The Journal of the Acoustical Society of America 144 (5): EL429–35. doi:https://doi.org/10.1121/1.5079575.
- Madsen, S.M.K., Marschall, M., Dau, T., Oxenham, A.J. 2019. Speech perception is similar for musicians and non-musicians across a wide range of conditions. Scientific Reports, 9(1): 10404. doi:https://doi.org/10.1038/s41598-019-46728-1.
- Massida, Z., Marx, M., Belin, P., James, C., Fraysse, B., Barone, P., Deguine, O. 2013. Gender categorization in cochlear implant users. Journal of Speech, Language, and Hearing Research, 56(5): 1389–1401.
- McDermott, J.H. 2004. Music perception with cochlear implants: a review. Trends in Amplification, 8(2): 49–82.
- McFerran, K.S., Garrido, S., Saarikallio, S. 2016. A critical interpretive synthesis of the literature linking music and adolescent mental health. Youth & Society, 48(4): 521–538. doi:https://doi.org/10.1177/0044118X13501343.
- Migirov, L., Kronenberg, J., Henkin, Y. 2009. Self-reported listening habits and enjoyment of music among adult cochlear implant recipients. Annals of Otology, Rhinology & Laryngology, 118: 350–355. doi:https://doi.org/10.1177/000348940911800506.
- Mirza, S., Douglas, S.A., Lindsey, P., Hildreth, T., Hawthorne, M. 2003. Appreciation of music in adult patients with cochlear implants: a patient questionnaire. Cochlear Implants International, 4: 85–95. doi:https://doi.org/10.1179/cim.2003.4.2.85.
- Moreno, S., Bialystok, E., Barac, R., Glenn Schellenberg, E., Cepeda, N.J., Chau, T. 2011. Short-term music training enhances verbal intelligence and executive function. Psychological Science, 22: 1425–1433. doi:https://doi.org/10.1177/0956797611416999.
- Parbery-Clark, A., Skoe, E., Lam, C., Kraus, N. 2009. Musician enhancement for speech-in-noise. Ear and Hearing, 30(6): 653–661.
- Patel, A.D. 2014. Can nonlinguistic musical training change the way the brain processes speech? The expanded OPERA hypothesis. Hearing Research, 308(February): 98–108.
- Petersen, B., Friis Andersen, A.S., Haumann, N.T., Højlund, A., Dietz, M.J., Michel, F., et al. 2020. The CI MuMuFe – a new MMN paradigm for measuring music discrimination in electric hearing. Frontiers in Neuroscience, 14: 2. doi:https://doi.org/10.3389/fnins.2020.00002.
- Philips, B., Vinck, B., De Vel, E., Maes, L., D’Haenens, W., Keppler, H., Dhooge, I. 2012. Characteristics and determinants of music appreciation in adult CI users. European Archives of Oto-Rhino-Laryngology : Official Journal of the European Federation of Oto-Rhino-Laryngological Societies (EUFOS) : Affiliated with the German Society for Oto-Rhino-Laryngology – Head and Neck Surgery, 269(3): 813–821.
- Phillips-Silver, J., Toiviainen, P., Gosselin, N., Turgeon, C., Lepore, F., Peretz, I. 2015. Cochlear implant users move in time to the beat of drum music. Hearing Research, 321(March): 25–34. doi:https://doi.org/10.1016/j.heares.2014.12.007.
- Prevoteau, C., Chen, S.Y., Lalwani, A.K. 2018. Music enjoyment with cochlear implantation. Auris Nasus Larynx, 45(5): 895–902. doi:https://doi.org/10.1016/j.anl.2017.11.008.
- Robinson, K., Gatehouse, S., Browning, G.G. 1996. Measuring patient benefit from otorhinolaryngological surgery and therapy. Annals of Otology, Rhinology & Laryngology, 105: 415–422.
- Ruggles, D.R., Freyman, R.L., Oxenham, A.J. 2014. Influence of Musical training on understanding voiced and whispered speech in noise. PloS One, 9(1): e86980.
- Salimpoor, V.N., Benovoy, M., Larcher, K., Dagher, A., Zatorre, R.J. 2011. Anatomically distinct dopamine release during anticipation and experience of peak emotion to music. Nature Neuroscience, 14(2): 257–262.
- Salimpoor, V.N., Benovoy, M., Longo, G., Cooperstock, J.R., Zatorre, R.J. 2009. The rewarding aspects of music listening are related to degree of emotional arousal. PloS One, 4(10): e7487. doi:https://doi.org/10.1371/journal.pone.0007487.
- Shannon, R.V., Fu, Q.J., Galvin, J.J. 2004. The number of spectral channels required for speech recognition depends on the difficulty of the listening situation. Acta Oto-Laryngologica Supplementum, 552: 50–54.
- Thompson, W.F., Schellenberg, E.G. Husain, G. 2004. Decoding speech prosody: do music lessons help? Emotion (Washington, D.C.), 4(1): 46–64.
- Walworth, D., Rumana, C.S., Nguyen, J., Jarred, J. 2008. Effects of live music therapy sessions on quality of life indicators, medications administered and hospital length of stay for patients undergoing elective surgical procedures for brain. Journal of Music Therapy, 45(3): 349–359.
- Won, J.H., Drennan, W.R., Kang, R.S., Rubinstein, J.T. 2010. Psychoacoustic abilities associated with music perception in cochlear implant users. Ear and Hearing, 31: 796–805. doi:https://doi.org/10.1097/AUD.0b013e3181e8b7bd.
- Won, J.H., Drennan, W.R., Rubinstein, J.T. 2007. Spectral-ripple resolution correlates with speech reception in noise in cochlear implant users. Journal of the Association for Research in Otolaryngology, 8: 384–392. doi:https://doi.org/10.1007/s10162-007-0085-8.
- van Wieringen, A., De Voecht, K., Bosman, A.J., Wouters, J. 2011. Functional benefit of the bone-anchored hearing aid with different auditory profiles: objective and subjective measures: functional benefit of the bone-anchored hearing aid with different auditory profiles. Clinical Otolaryngology, 36(2): 114–120. doi:https://doi.org/10.1111/j.1749-4486.2011.02302.x.
- Zatorre, R.J., Salimpoor, V.N. 2013. From perception to pleasure: music and its neural substrates. Proceedings of the National Academy of Sciences of the United States of America, 110(Suppl 2 (June)): 10430–10437.
- Zhang, F., Roland, C., Rasul, D., Cahn, S., Liang, C., Valencia, G. 2019. Comparing musicians and non-musicians in signal-in-noise perception. International Journal of Audiology, 58: 717–723. doi:https://doi.org/10.1080/14992027.2019.1623424.
- Zhao, F., Bai, Z., Stephens, D. 2008. The relationship between changes in self-rated quality of life after cochlear implantation and changes in individual complaints. Clinical Otolaryngology, 33(5): 427–434.