
 ?Mathematical formulae have been encoded as MathML and are displayed in this HTML version using MathJax in order to improve their display. Uncheck the box to turn MathJax off. This feature requires Javascript. Click on a formula to zoom.
ABSTRACT
Background: PF-06438179/GP1111 (PF-SZ-IFX) is an infliximab (IFX) biosimilar. Pharmacokinetic (PK) similarity of PF-SZ-IFX and reference IFX authorized in the European Union (ref-IFX-EU) and in the US (ref-IFX-US) was demonstrated in healthy subjects. Safety and efficacy of PF-SZ-IFX were investigated in a multinational, double-blind, randomized study in rheumatoid arthritis (RA) patients. This work aims to evaluate the population pharmacokinetics (PopPK) of ref-IFX-EU and PF-SZ-IFX in RA patients.
Research design and methods: Patients with moderately to severely active RA (N = 650) were randomized 1:1 to PF-SZ-IFX or ref-IFX-EU. PopPK modeling with data collected from the study was performed using a nonlinear mixed-effects approach (NONMEM 7.2.0).
Results: The PK of ref-IFX-EU and PF-SZ-IFX were adequately described using a two-compartment model with linear elimination. Clearance (CL) estimates were 0.014 L/h and 0.015 L/h for PF-SZ-IFX and ref-IFX-EU, with inter-individual variability (IIV) on CL of 43.1% and 40.1%, respectively. Volumes of distribution in the central compartment (V1) were 3.38 L and 3.57 L, with IIV on V1 of 28.1% and 23.7%, respectively. The same covariates of sex and antidrug antibody titers on CL, and body weight on V1, influenced the PK variability of ref-IFX-EU and PF-SZ-IFX.
Conclusions: PopPK analysis revealed no appreciable differences between the PK of ref-IFX-EU and PF-SZ-IFX in RA patients.
Trial registration: ClinicalTrials.gov identifier: NCT02222493.
1. Introduction
Infliximab (IFX; Remicade®) is a chimeric human-murine IgG1 kappa monoclonal antibody specific for tumor necrosis factor alpha (TNFα) approved for use in both the United States (US) [Citation1] and the European Union (EU) [Citation2].
Biosimilars are biologic drugs that are deemed to be suitably similar to the approved reference biologic, based on rigorous analytical, nonclinical and clinical assessment, to the extent that they are not anticipated to show any clinically meaningful differences in terms of their quality, efficacy, and safety [Citation3–Citation6]. PF-06438179/GP1111 (PF-SZ-IFX; Ixifi™/Zessly®) was recently approved by the US Food and Drug Administration (FDA) [Citation7] and by the European Medicines Agency (EMA) [Citation8] as an IFX biosimilar for all eligible indications of reference IFX (ref-IFX: Remicade®) in each region. The physicochemical and functional characterization has demonstrated a high degree of molecular and functional similarity of PF-SZ-IFX to ref-IFX licensed in the US (ref-IFX-US) and in the EU (ref-IFX-EU) [Citation9].
In a phase I, randomized, controlled, double-blind, three-arm, single-dose study in healthy subjects (REFLECTIONS B537-01), the pharmacokinetics (PK) of PF-SZ-IFX, ref-IFX-EU and ref-IFX-US following a single intravenous (IV) dose at 10 mg/kg were shown to be similar, based on all two-way treatment comparisons for the primary PK outcome measures, being within the pre-specified margins for bioequivalence [Citation10].
The REFLECTIONS B537-02 study was a phase III, randomized, double-blind, parallel-group trial to evaluate the efficacy, safety, population PK (PopPK), and immunogenicity of PF-SZ-IFX and ref-IFX-EU in combination with methotrexate (MTX) when administered IV to treat patients with moderately to severely active rheumatoid arthritis (RA) who have had an inadequate response to MTX therapy [Citation11]. The study randomized 650 patients (1:1) to two study treatment arms to receive either PF-SZ-IFX or ref-IFX-EU. Therapeutic equivalence between PF-SZ-IFX and ref-IFX-EU was demonstrated for the primary endpoint of the American College of Rheumatology (ACR) ≥20% clinical improvement (ACR20) response rates at Week 14 [Citation11].
The results of REFLECTIONS B537-01 met the regulatory requirements [Citation12,Citation13] in demonstrating PK similarity between PF-SZ-IFX and ref-IFX in healthy subjects. The PK of PF-SZ-IFX and ref-IFX in patients with RA was also evaluated in REFLECTIONS B537-02 to support their similarity, and given the sparse sampling implemented in this trial, we report here a population approach that was used to describe the PK of PF-SZ-IFX and ref-IFX-EU, and to understand the influence of factors that have been shown previously to impact the PK of ref-IFX.
2. Patients and methods
This study was conducted in compliance with the provisions of the Declaration of Helsinki and International Conference on Harmonization Good Clinical Practice Guidelines, and was reviewed and approved by an Institutional Review Board or Independent Ethics Committee(s) at each of the participating investigational sites. There was no specific primary ethics committee for the study. All patients provided written informed consent prior to undergoing any screening procedures.
2.1. Study population and design
Eligible patients were adults (aged ≥18 years) who met the 2010 ACR/European League Against Rheumatism classification criteria for RA and ACR Class I-III functional status, based on the 1991 revised criteria. Patients had to have a diagnosis of RA for ≥4 months, with ≥6 swollen and ≥6 tender joints at both screening and baseline, and high-sensitivity C-reactive protein (hs-CRP) ≥10 mg/L at screening. Patients must have received MTX (10–25 mg/wk) for ≥12 weeks prior to the first dose of the study drug and during the study.
This multinational, double-blind, randomized study (ClinicalTrials.gov identifier: NCT02222493; EudraCT number: 2013–004148-49) consisted of an initial 30-week treatment period and two subsequent 24-week treatment periods, during which patients were evaluated following a single transition from ref-IFX-EU to PF-SZ-IFX after 30 or 54 weeks of treatment (). Eligible patients were randomized 1:1 to receive IV PF-SZ-IFX or ref-IFX-EU, each in combination with MTX. PF-SZ-IFX or ref-IFX-EU (3 mg/kg) was given as an induction regimen at Weeks 0, 2, and 6, followed by maintenance treatment with 3 mg/kg starting at Week 14 and continuing every 8 weeks thereafter.
Figure 1. Study design. (Cohen et al. Arthritis Res Ther. 2018;20:155. © The Author(s). Reprinted with permission [https://creativecommons.org/licenses/by/4.0/]). a A sample size of approximately 614 patients was planned for enrolment; the actual number of patients randomized was 650. b Intravenous PF-SZ-IFX or ref-IFX-EU 3 mg/kg was given as an induction regimen at Weeks 0, 2, and 6, followed by maintenance treatment with a 3-mg/kg dose starting at Week 14 and continuing every 8 weeks thereafter. Dose escalation to 5 mg/kg PF-SZ-IFX or ref-IFX-EU was permitted at or after Week 14 for patients with inadequate RA response. EOT, end of treatment; PF-SZ-IFX, PF-06438179/GP1111; RA, rheumatoid arthritis; ref-IFX-EU, infliximab authorized in the European Union.
![Figure 1. Study design. (Cohen et al. Arthritis Res Ther. 2018;20:155. © The Author(s). Reprinted with permission [https://creativecommons.org/licenses/by/4.0/]). a A sample size of approximately 614 patients was planned for enrolment; the actual number of patients randomized was 650. b Intravenous PF-SZ-IFX or ref-IFX-EU 3 mg/kg was given as an induction regimen at Weeks 0, 2, and 6, followed by maintenance treatment with a 3-mg/kg dose starting at Week 14 and continuing every 8 weeks thereafter. Dose escalation to 5 mg/kg PF-SZ-IFX or ref-IFX-EU was permitted at or after Week 14 for patients with inadequate RA response. EOT, end of treatment; PF-SZ-IFX, PF-06438179/GP1111; RA, rheumatoid arthritis; ref-IFX-EU, infliximab authorized in the European Union.](/cms/asset/c4b94fbf-f062-4801-8aca-9768c47b4630/iebt_a_1635583_f0001_b.gif)
2.2. Pharmacokinetic sampling and bioanalytical assay
Blood samples for measurement of serum concentrations of ref-IFX-EU or PF-SZ-IFX were collected immediately (within 4 h) prior to dose administration at Weeks 0, 2, 6, 14, 22, 30, 38, 54, and 62; within 5 min prior to the end of infusion at Weeks 0 and 14; and any time during study visits at Weeks 4 and 78 [end of treatment (EOT)]. In this population analysis, the drug concentration–time data collected from scheduled samples using the original database snapshot from the initial 30-week treatment period (Treatment Period 1, prior to the Week 30 infusion and transition of patients from ref-IFX-EU to PF-SZ-IFX) only were included.
An Enzyme Linked Immunosorbent Assay (ELISA) for determining concentrations of ref-IFX-EU and PF-SZ-IFX in human serum samples was developed and validated by ICON Development Solutions (Whitesboro, NY, USA) [Citation10,Citation11]. The assay had a lower limit of quantification (LLOQ) of 100 ng/mL.
2.3. Population pharmacokinetic analysis
2.3.1. General modeling approach to compare PK
PopPK analysis followed a stepwise approach: base model development, random-effects model development, inclusion of covariates, final model development. The PopPK analysis was conducted on PK data from PF-SZ-IFX and ref-IFX-EU; however, the PK model was developed for each product separately, assuming that IFX concentrations are from the two products (). A key advantage of this approach is there is no assumption of similarity between the products, and hence allows comparison of the model structures and parameters. All patients who had scheduled samples from Treatment Period 1 (prior to the Week 30 infusion) only, and who had at least one PK sample collected post-dose, were included in the PopPK analysis.
Figure 2. PopPK model development schematic. PF-SZ-IFX, PF-06438179/GP1111; PopPK, population pharmacokinetics; ref-IFX-EU, infliximab authorized in the European Union; VPC, visual predictive check.
2.3.2. Structural pharmacokinetic model and variability models
Model development was performed using nonlinear mixed-effects modeling (NONMEM 7.2.0, ICON Development Solutions, Ellicott City, MD, USA). Perl-speaks-NONMEM (PsN) 4.2.0 was used for stepwise covariate modeling (SCM); visual predictive check (VPC), R 3.0.2 and S-Plus 8.0 were used for pre- and post-processing, and for plotting results.
A hierarchical PopPK model was built to describe the PK of IFX. The structural PK model was based on prior published data for ref-IFX [Citation14–Citation18]. Hence, the model building in both treatment arms was started with a two-compartment model with linear clearance (CL) only, in terms of CL, the volume of distribution in the central compartment (V1), intercompartmental clearance (Q), and the volume of the peripheral compartment (V2).
PK models were coded using the ADVAN3 TRANS4 subroutine of NONMEM, with parameterization as volume and CL terms with the Laplacian approximation method implemented for the analyses. The impact of omitting data below LLOQ (<LLOQ) on the PK of IFX was investigated using the M3 method, which is a likelihood-based approach where <LLOQ data were flagged and treated as categorical data [Citation19]. This method considered this below limit of quantitation (BLQ) value as a normally distributed, random value somewhere between negative infinity and the limit of quantitation.
Inter-individual variability (IIV) in the PK parameters was modeled using multiplicative exponential random effects of the form:
where θ is the typical individual (population mean) value of the parameter and ηi denotes the inter-individual random effect accounting for the ith individual’s deviation from the typical value having zero mean and variance ω2.
Residual variability (ε) was modeled additively based on log-transformed observation data using a variance-covariance matrix of the intra-individual random effects (ε) estimated by a θ parameter:
where ln(Yij) denotes the observed concentration for the ith patient at time tj on a log scale, ln(Fij) denotes the corresponding model-predicted concentration on the log scale, and εij denotes the intra-individual random effect, assumed to have a mean of 0 and variance σ2 of 1. W was one of the θ values to be estimated.
In addition to goodness-of-fit plots and parameter stability, two structural models were compared by investigating the change in the objective function value (ΔOFV). The difference in OFV between two hierarchical models has an approximate chi-squared probability distribution with the number of degrees of freedom (df) equal to the difference in the number of parameters between the models. Based on the chi-squared distribution with df = 1, a ΔOFV of 6.63 corresponds to a P-value of 0.01.
2.3.3. Covariate evaluations
Potential covariates of interest for evaluation on PK parameters comprised: baseline demographic characteristics (age, body surface area or body weight, sex, race, serum albumin, ethnicity [Japanese vs. non-Japanese]); baseline disease status (hs-CRP levels, rheumatoid factor, white blood cell count); antidrug antibody (ADA) occurrence; previous biologic use; MTX dose. Following the identification of the base structural PK model, the full and final models were generated with the testing of covariates, which were chosen based on the mechanistic plausibility, and exploratory graphical analysis. The effects of the relevant covariates () on the variability of the systemic PopPK parameters were formally evaluated in NONMEM using the SCM method as implemented in PsN with a stepwise forward addition followed by stepwise backward elimination procedure.
Table 1. Covariates included in population pharmacokinetic analysis.
Categorical covariates were included by the linear model. Continuous covariates were included by either the linear or power model and/or were tested in parallel for all of the included covariates. The covariate parameter structures are described below:
Linear model for a categorical covariate (COV) x:
; most common,
for group x within a given category,
where θ0 denotes the population value of the parameter at the most common value for that characteristic (reference). The parameter θx denotes the fractional change in θ0 for a group of the population within that category in such a manner that the sum of all the groups within a category represents the whole study population.
Linear model for a continuous covariate x:
where θ0 denotes the population value of the parameter when x = xmedian. The parameter θ denotes the population value conditional on the value of x through the slope θx that is estimated from the model. When θx = 0, it is suggested that covariate x has little impact on the estimate of θ.
Power model for a continuous covariate x:
where θ0 denotes the population value of the parameter when x = xmedian. The parameter θ denotes the population value conditional on the value of x, which is proportional to the power θx. θx is estimated from the model, and when θx = 0, it is suggested that covariate x has little impact on the estimate of θ.
Except for ADAs, all other covariates were tested using their baseline value. The impact of ADAs was assessed by evaluating the effect of ADA titers on CL. The covariate structure for this evaluation was based on the modification of the time-varying covariate model reported by Wählby et al. [Citation20] to account for missing post-dose ADA titers and replacing them with last observation carried forward value.
The final structure for each significant covariate was determined based on OFV. Covariates were included if the ΔOFV was larger than 3.84, which corresponds to a statistical significance of P < 0.05, based on a chi-squared distribution (df = 1). During subsequent backward elimination of covariates, a more conservative statistical significance criterion was used (ΔOFV > 10.83, P < 0.001).
2.3.4. Model goodness of fit and evaluation
The goodness of fit was assessed for each model by plotting observed (OBS) vs. population-predicted (PRED) values and OBS vs. individual-predicted (IPRED) values based on individual η values with evaluation for randomness around the line of unity. Models were also evaluated for graphical visualization of longitudinal profiles of PK concentration to compare observations and predictions. Plot of conditional weighted residuals (CWRES) vs. time was evaluated for randomness around the zero line. In addition, plots of individual η values in the final model vs. each covariate were compared with similar plots for the base model. Confidence intervals (95% CI; that is, 2.5th and 97.5th percentiles) around the parameter estimates were generated based on standard errors determined from the NONMEM covariance step.
Nonparametric bootstrap technique was applied as an internal validation tool to assess the stability of the final parameter estimates and to confirm the robustness of the final model [Citation21]. One thousand bootstrap replicates were generated by randomly resampling the original dataset with replacement [Citation22]. The base and final models were fitted to the replicate datasets. The median values and 95% CI of these 1000 bootstrap replicates were compared with the point estimates from the original dataset.
Both η-shrinkage (1-standard deviation [ηEBE]/ω) and ε-shrinkage (1-standard deviation [IWRES]) were evaluated to assess the validity of using post hoc individual parameter estimates for model diagnosis.
The performance of the final model was evaluated by simulating data using the parameter estimates from the final model (fixed and random effects) and conducting VPCs. Simulations (N = 1000 replicates) were performed using the patients’ characteristics as well as the dosing and sampling history from the original dataset. The concordance between individual observations and simulated values, as well as the distribution of observed and simulated data, was evaluated.
In VPCs for the M3 method, all PK data <LLOQ were retained in the dataset to ensure correctly calculated percentiles [Citation23]. The 5th and 95th percentiles for observed data were calculated and presented for those percentiles where data <LLOQ constituted a smaller fraction than the percentile in question.
Additional VPCs, with stratification based on Japanese vs. non-Japanese, were conducted to understand the model performance characteristics between these two ethnicities. For improved viewing of the comparison of nonzero concentrations between ethnicities, only the predicted median and 5th–95th percentiles are shown.
3. Results
3.1. Study population
PK data were obtained from 649 patients, the demographics for whom are presented in . Overall, the demographics and baseline parameters were generally comparable between the PF-SZ-IFX and ref-IFX-EU arms.
Table 2. Summary of demographics and key parameters by treatment groupa.
3.2. Data inclusions and exclusions
The final NONMEM PopPK dataset used for the pooled analysis included a total of 4881 PK observations (including data <LLOQ) from 649 patients treated with ref-IFX-EU and PF-SZ-IFX (2415 and 2466 PK observations, respectively), for whom serum concentrations from at least one post-dose visit were available with associated dosing times. Since the number of samples with concentrations <LLOQ was larger than 10% (~15.6%), the M3 method [Citation19] was used as the analysis method for handling concentrations <LLOQ.
3.3. Population pharmacokinetics results
3.3.1. Model development for ref-IFX-EU and PF-SZ-IFX
Consistent with the historical PopPK results of ref-IFX [Citation14,Citation15,Citation17,Citation18], a two-compartment model with linear elimination with IIV on CL parameter was chosen as the starting structural model. Given the sparse sampling nature of the PK collection in Study B5371002, the intercompartmental CL parameter (Q) was fixed to the average of the published literature value of 0.2 L/h in the model [Citation14–Citation18].
Addition of IIV parameters on V1 significantly reduced the OFV; however, further addition of IIV on V2 did not minimize successfully, suggesting that the model was overparameterized. The correlation of CL and V1 IIV using OMEGA Block(2) for CL and V1 did not reduce the OFV significantly. Hence, the base model used for covariate testing comprised a two-compartment structural mode with linear elimination with IIV (diagonal) on CL and V1 (Supplemental Table S1). The model-building steps for PF-SZ-IFX also resulted in the base model with the same structural PK and IIV parameters (Supplemental Table S1).
3.3.2. Covariate effects and final model
Following the selection of the base model for both ref-IFX-EU and PF-SZ-IFX arms, inclusion of covariates was tested using the SCM method in PsN. The results of the SCM analysis for both the ref-IFX-EU and PF-SZ-IFX arms in PsN showed that the full model (after the forward selection) included the effects of baseline albumin (BALB) as power function relation, time-varying ADA titers (ADATL) and sex as linear function relation on CL, and effects on baseline body weight (BWT) as power function relation on V1. None of the other tested covariates (including BALB and CRP on CL [see Supplemental Figure S1]) were significant in the analysis. Race and Japanese ethnicity were not tested as covariates because of the limited number of Japanese patients who participated in the study.
After one backward elimination step (α = 0.001; removal of any of these covariates resulted in a more than 10.83 increase in OFV), the effect of BALB on CL was eliminated from the full model. The backward elimination step in the covariate selection process resulted in the final model with identical covariates influencing the CL and V1 for both the ref-IFX-EU and PF-SZ-IFX treatment arms ().
Table 3. Final model parameter estimates and CIs for the ref-IFX-EU and PF-SZ-IFX arms.
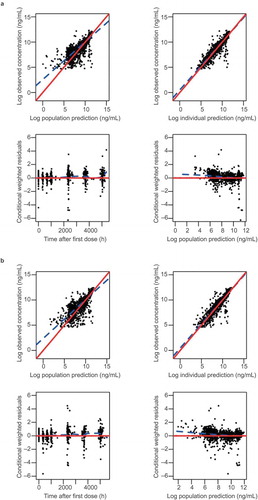
In the final models, the CL values of ref-IFX-EU and PF-SZ-IFX were estimated to be 0.015 L/h and 0.014 L/h, respectively, which are consistent with the CL values reported previously for ref-IFX [Citation18,Citation24]. Likewise, the V1 values were similar between the treatment arms (ref-IFX-EU: 3.57 L and PF-SZ-IFX: 3.38 L) and also consistent with reported values. The diagnostic plots of the final model (), which compared the observed ref-IFX-EU or PF-SZ-IFX concentrations with population-predicted concentrations, showed that the population predictions track well with the central tendency of the observed data. The magnitude of the spread for OBS vs. IPRED values was small around the line of identity, indicating that the model predicted the individual concentrations well. CWRES plotted against IPRED values (not shown) did not indicate any appreciable model misspecification of the structural model or the residual error model. In the plots of CWRES vs. time after first dose, the majority of the data were evenly distributed across the x-axis, indicating no major deviation or trend over the entire observation time in the population. Normalized prediction distribution errors were normal for both treatment arms (Supplemental Figure S2).
Figure 3. Diagnostic plots for final model for the ref-IFX-EU arm (a) and the PF-SZ-IFX arm (b). In the scatter plots of observations vs. predictions, the solid red line and dashed blue line show the reference line (diagonal line) and linear regression line based on the individual data points. In the scatter plots of residuals, the solid and dotted lines show the reference line (y = 0) and the locally weighted scatter-plot smoothing trend line (LOESS), respectively. Observed concentrations and individual predictions were log-transformed. PF-SZ-IFX, PF-06438179/GP1111; ref-IFX-EU, infliximab authorized in the European Union.
The covariate analysis revealed that the magnitude of greater clearance in males compared with females was similar between ref-IFX-EU (25.5%) and PF-SZ-IFX (28.3%). Inclusion of sex reduced the IIV on CL as observed by the difference in ηCL values between the base and final models (Supplemental Figure S1).
The effect of ADATL was evaluated as a simplified time-varying covariate on CL instead of testing ADA status as a binary covariate on CL. This was an application of a novel approach to account for decreasing drug concentrations (including BLQs), as a result of ADA appearance and with the intent to describe the curvature in the concentrations. A positive correlation was observed between ηCL and ADATL from the base model for both ref-IFX-EU and PF-SZ-IFX (Supplemental Figure S1). The effect of ADATL was statistically significant on CL and quantified in the covariate model through linear function with the slope estimated as 0.478 and 0.394 in the ref-IFX-EU arm and the PF-SZ-IFX arm, respectively ().
A slightly positive yet statistically significant correlation was observed between V1 and BWT from the base model. In the ref-IFX-EU arm, compared with the typical value of 3.57 L at a median body weight 70.8 kg, V1 was reduced by 11.5% and increased by 12.1% at a body weight of 59 kg (1st quartile) and 84 kg (3rd quartile), respectively. In the PF-SZ-IFX arm, compared with the typical value of 3.38 L at a median body weight of 70.3 kg, V1 was reduced by 6.60% and increased by 8.40% at a body weight of 60 kg (1st quartile) and 85 kg (3rd quartile), respectively. In both treatment arms, the differences are not considered clinically significant.
3.3.3. Model evaluation and predictive performance
The statistical distributions of the parameter estimates obtained from the bootstrap analyses were symmetrical around the mean and appeared to follow a normal distribution. Median values of the parameters estimated from the bootstrap analyses of the final models were in good agreement with NONMEM point estimates and the 95% CIs, indicating acceptable precision (). The significance of included covariates was further supported by the bootstrap analyses, as none of the 95% CIs for the covariate effects included zero. Additionally, the 95% CIs generated from the NONMEM model and bootstrap analyses were similar between the treatment arms.
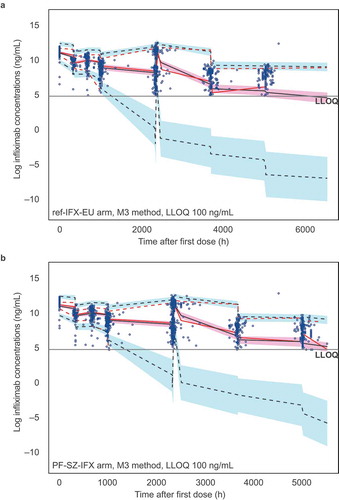
The VPC simulations results () showed that the model reproduced the observed longitudinal concentration profiles successfully. The blue-shaded region is based on the ability of the M3 method to estimate the probability of concentrations to be below LLOQ. Additionally, the observed fraction of data <LLOQ was within the 95% CI for the simulated fraction of data <LLOQ for both the ref-IFX-EU and PF-SZ-IFX arms (Supplemental Figure S3), further confirming the robustness of the PK model.
Figure 4. VPC for final model for the ref-IFX-EU arm (a) and the PF-SZ-IFX arm (b). Blue circles represent the observed data, and red lines represent the median (solid line), 5th percentile (dashed line), and 95th percentile (dashed line) of the observed data. For 1000 simulated trials, the median, 5th percentile, and 95th percentile of simulated concentrations were calculated for each time point and are represented by black lines. The 95% CI for simulated median and each percentile are shown by light pink and light blue shaded areas. CI, confidence interval; h, hours; LLOQ lower limit of quantification; PF-SZ-IFX, PF-06438179/GP1111; ref-IFX-EU, infliximab authorized in the European Union; VPC, visual predictive check.
3.3.4. Pharmacokinetics of PF-SZ-IFX in Japanese vs. non-Japanese patients
The VPC simulation of PF-SZ-IFX concentrations stratified by Japanese patients vs. non-Japanese patients showed that the median and 95th percentile concentrations over time were similar (Supplemental Figure S4).
4. Discussion
In the development of a biosimilar to Remicade®, the PK similarity between PF-SZ-IFX and ref-IFX (ref-IFX-US and ref-IFX-EU) was demonstrated using a noncompartmental analysis (NCA) approach in healthy subjects (Study B5371001) [Citation10]. Although regulatory agencies consider an NCA approach as the regulatory standard for demonstrating PK similarity between a proposed biosimilar and its RP [Citation12,Citation13], the use of model-based approaches, such as PopPK analysis, is beneficial in generating supportive PK data, which add to the totality-of-the-evidence approach used in the assessment of biosimilars. A PopPK approach offers methodologic advantages by virtue of being able to use sparse data, the ability to investigate the effect of covariates, and to account for differences resulting from protocol deviations, with regard to dose timing, sample collection, missing samples, etc.
Despite their similarity, a biosimilar and originator RP are not identical and should, therefore, be considered distinct for the purposes of the biosimilar development program [Citation5,Citation6]. As such, rather than combining data from both treatment arms in a single model, we performed the PopPK analysis separately for ref-IFX-EU and PF-SZ-IFX. Moreover, the study was designed mainly to determine similarity in the efficacy of the two products, and was not designed to test treatment as a covariate for PK. For ref-IFX-EU and PF-SZ-IFX, the final structural PK model was a two-compartment model with first-order elimination from the central compartment. IIV was incorporated on CL and V1 through an exponential model, with sex and ADATL influencing CL and BWT influencing the V1 parameter.
All parameters were estimated with a sufficient level of certainty and identifiability in the final model. The random effect on V1 had a slightly higher shrinkage, but this is not uncommon with monoclonal antibodies and the use of sparse PK sampling [Citation25]. In the current analysis, the clinical relevance of the slightly higher shrinkage on the V1 parameter is unknown at this time, but it is not uncommon to observe high shrinkage in studies. For instance, a higher shrinkage was also noted on the Q parameter in the study by Fasanmade et al. [Citation16]. It should be noted that the nonparametric bootstrap-derived 95% CI suggests that the random effect on the V1 parameter can be estimated for the two treatment arms in our study.
The distributional clearance (Q) had to be fixed to the average of the previously published value of 0.2 L/h because it could not be resolved by the sparse sampling scheme designed to take advantage of routine clinical care visits during this phase III efficacy and safety study. Demonstration of the PK similarity between PF-SZ-IFX and ref-IFX-EU/ref-IFX-US in healthy subjects notwithstanding [Citation10], REFLECTIONS B537-02 was not designed for full PK characterization, including the distribution phase of IFX following an IV infusion that may be critical for the purpose of PK similarity determination. The final model included IIV terms for the two PK parameters (CL and V1) for which the assessment of IIV is of primary interest.
The covariates influencing the CL and V1 were identical between the two products, with sex and ADATL affecting the CL and BWT altering the V1 parameter. This is generally consistent with previously reported covariate effects [Citation14–Citation18]. The development of ADAs to ref-IFX is a factor known to increase IFX clearance [Citation14–Citation18]. The interaction of ADAs with circulating IFX may form complexes that clear more rapidly than IFX alone [Citation16]. In this analysis, inclusion of ADATL as a covariate was responsible for the largest reduction in OFV compared with the other covariates, which is consistent with the literature observation of the effect of ADAs on IFX PK. When evaluating the effect of ADAs, we used time-varying ADATL instead of binary ADA status to be able to improve the fitting of the concentration–time data, as the impact of immunogenicity on serum concentrations of ref-IFX-EU and PF-SZ-IFX could be ADATL dependent. The bootstrapped point estimates of the value for the impact of ADATL on CL for each product fall within the 95% CI of the other product (), implying there is no difference in the covariate effect between products.
It is apparent from the final model that BWT is an important determinant of IFX exposure. BWT influences V1 (with a power factor of 0.669 for ref-IFX-EU and 0.425 for PF-SZ-IFX) but not CL. Similar to our observation, previous analyses also showed that body weight is a covariate of V1, although the coefficients varied for these patient populations [Citation26]. The bootstrapped point estimates (95% CI) for impact of BWT on V1 for PF-SZ-IFX [0.425 (0.222, 0.634)] fall just outside the associated estimate (95% CI) for ref-IFX-EU [0.676 (0.496, 0.862)]. This difference could be due to the slight differences in the body weights of patients in each treatment arm and is not considered clinically meaningfully different.
In this study, patients’ sex was associated with CL for both ref-IFX-EU and PF-SZ-IFX. However, the impact of sex on the overall CL value was marginal, an effect that is consistent with previous PopPK analyses [Citation26]. Additionally, similar to the ADATL effect on CL, the bootstrapped point estimates of the value for the impact of sex on CL for each product fall within the 95% CI of the other product (), implying there is no difference in the covariate effect between products. A previous PopPK analysis identified baseline CRP and MTX co-treatment as significant covariates on IFX PK in patients with RA, with the assessment of inclusion and exclusion of covariates into the model at α-values of 0.1 and 0.01, respectively [Citation18]. In our analysis, we used more stringent α-values of 0.05 and 0.001, respectively, and baseline CRP and other potential covariates, including BALB and MTX co-treatment, were found to be not significant.
This PopPK analysis adds value to the PK similarity study in healthy subjects [Citation10]. Specifically, it shows that the PK parameters/variability and the major covariates influencing PK are not different between the two products, further supporting the PK similarity between the products. In addition, it provides evidence to indicate that PK similarity is unaffected by ethnicity (i.e. Japanese vs. non-Japanese patients).
The PK of ref-IFX-EU and PF-SZ-IFX in patients with moderately to severely active RA was adequately described by a two-compartmental model with linear elimination from the central compartment, consistent with the PopPK analysis for ref-IFX reported in the literature. The PopPK analysis did not reveal any appreciable difference between the PK of ref-IFX-EU and PF-SZ-IFX in this patient population. The final PK model was verified using different approaches, providing reliable post hoc estimates of PK parameters for ref-IFX-EU and PF-SZ-IFX. This analysis identified covariates of BWT, sex, and ADATL as significant factors influencing ref-IFX-EU and PF-SZ-IFX PK. VPC simulations showed that the PK of PF-SZ-IFX was no different between Japanese and non-Japanese patients. Additionally, results of this PopPK analysis provide further supporting evidence for the PK similarity of ref-IFX-EU and PF-SZ-IFX adding to the totality of the evidence to support the similarity of PF-06438179/GP1111 to reference infliximab (Remicade).
Author contributions
R Palaparthy, D Yin, and MI Rehman were involved in the study design, data collection and data analysis. O von Richter was involved in the data analysis. All authors were involved with the interpretation of data. All authors participated in drafting the manuscript and revising the manuscript critically for important intellectual content, and have given final approval of the version to be published. All authors agree to be accountable for all aspects of the work.
Availability of data
Upon request, and subject to certain criteria, conditions and exceptions (see https://www.pfizer.com/science/clinical-trials/trial-data-and-results for more information), Pfizer will provide access to individual de-identified participant data from Pfizer-sponsored global interventional clinical studies conducted for medicines, vaccines and medical devices (1) for indications that have been approved in the US and/or EU; or (2) in programs that have been terminated (i.e. development for all indications has been discontinued). Pfizer will also consider requests for the protocol, data dictionary, and statistical analysis plan. Data may be requested from Pfizer trials 24 months after study completion. The de-identified participant data will be made available to researchers whose proposals meet the research criteria and other conditions, and for which an exception does not apply, via a secure portal. To gain access, data requestors must enter into a data access agreement with Pfizer.
Declaration of interest
R Palaparthy, D Yin, and MI Rehman are employees of and hold stock in Pfizer Inc. O von Richter is an employee of Sandoz Biopharmaceuticals, Hexal AG (a Sandoz company). The authors have no other relevant affiliations or financial involvement with any organization or entity with a financial interest in or financial conflict with the subject matter or materials discussed in the manuscript apart from those disclosed.
Reviewer Disclosures
Peer reviewers on this manuscript have no relevant financial relationships or otherwise to disclose.
Inflix_Ph_3_PopPK_supp_material_EOBT_7jun19_2.0.docx
Download MS Word (844.7 KB)Acknowledgments
Editorial support was provided by Iain McDonald, PhD, of Engage Scientific Solutions, and was funded by Pfizer Inc.
Supplementary material
Supplemental data for this article can be accessed here.
Additional information
Funding
References
- Janssen Biotech Inc. Remicade® (infliximab) US prescribing information. Horsham, PA: Janssen Biotech Inc; 2017 October [cited 2018 May 8]. Available from: http://www.remicade.com/shared/product/remicade/prescribing-information.pdf
- European Medicines Agency. Remicade (infliximab) summary of product characteristics. European Medicines Agency. 2018 November 15 [cited 2018 Nov 27]. Available from: https://www.ema.europa.eu/documents/product-information/remicade-epar-product-information_en.pdf
- Weise M, Bielsky MC, De Smet K, et al. Biosimilars: what clinicians should know. Blood. 2012;120:5111–5117.
- World Health Organization. Guidelines on evaluation of similar biotherapeutic products (SBPs). October 2009 [cited 2018 May 8]. Available from: http://www.who.int/biologicals/areas/biological_therapeutics/BIOTHERAPEUTICS_FOR_WEB_22APRIL2010.pdf
- US Food and Drug Administration. Scientific considerations in demonstrating biosimilarity to a reference product. 2015 April [cited 2018 May 8]. Available from: http://www.fda.gov/downloads/Drugs/GuidanceComplianceRegulatoryInformation/Guidances/UCM291128.pdf
- European Medicines Agency, Committee for medicinal products for human use (CHMP). Guideline on similar biological medicinal products. CHMP/437/04 Rev. 2014 October 23 [cited 2018 May 8]. Available from: http://www.ema.europa.eu/docs/en_GB/document_library/Scientific_guideline/2014/10/WC500176768.pdf
- Pfizer Inc. Ixifi™ (infliximab-qbtx) for injection. US prescribing information. New York, NY: Pfizer Inc; 2017 December [cited 2018 May 8]. Available from: https://www.accessdata.fda.gov/drugsatfda_docs/label/2017/761072s000lbl.pdf
- European Medicines Agency. Zessly (Infliximab). Summary of product characteristics. [cited 2018 Nov 27]. Available from: https://www.ema.europa.eu/documents/product-information/zessly-epar-product-information_en.pdf
- Derzi M, Johnson TR, Shoieb AM, et al. Nonclinical evaluation of PF-06438179: a potential biosimilar to Remicade® (infliximab). Adv Ther. 2016;33:1964–1982.
- Palaparthy R, Udata C, Hua SY, et al. A randomized study comparing the pharmacokinetics of the potential biosimilar PF-06438179/GP1111 with Remicade(R) (infliximab) in healthy subjects (REFLECTIONS B537-01). Expert Rev Clin Immunol. 2018;14:329–336.
- Cohen SB, Alten R, Kameda H, et al. A randomized controlled trial comparing PF-06438179/GP1111 (an infliximab biosimilar) and infliximab reference product for treatment of moderate to severe active rheumatoid arthritis despite methotrexate therapy. Arthritis Res Ther. 2018;20:155.
- US Food and Drug Administration. Guidance for industry. Clinical pharmacology data to support a demonstration of biosimilarity to a reference product. Silver Spring, MD: US Department of Health and Human Services, US Food and Drug Administration, Center for Drug Evaluation and Research (CDER), Center for Biologics Evaluation and Research (CBER); 2016 December [cited 2018 May 8]. Available from: https://www.fda.gov/downloads/Drugs/GuidanceComplianceRegulatoryInformation/Guidances/UCM397017.pdf
- European Medicines Agency. Committee for medicinal products for human use (CHMP). Guideline on similar biological medicinal products containing biotechnology-derived proteins as active substance: non-clinical and clinical issues. London: European Medicines Agency; 2014 December 18 [cited 2018 May 8]. Available from: http://www.ema.europa.eu/docs/en_GB/document_library/Scientific_guideline/2015/01/WC500180219.pdf
- Buurman DJ, Maurer JM, Keizer RJ, et al. Population pharmacokinetics of infliximab in patients with inflammatory bowel disease: potential implications for dosing in clinical practice. Aliment Pharmacol Ther. 2015;42:529–539.
- Fasanmade AA, Adedokun OJ, Blank M, et al. Pharmacokinetic properties of infliximab in children and adults with Crohn’s disease: a retrospective analysis of data from 2 phase III clinical trials. Clin Ther. 2011;33:946–964.
- Fasanmade AA, Adedokun OJ, Ford J, et al. Population pharmacokinetic analysis of infliximab in patients with ulcerative colitis. Eur J Clin Pharmacol. 2009;65:1211–1228.
- Fasanmade AA, Adedokun OJ, Olson A, et al. Serum albumin concentration: a predictive factor of infliximab pharmacokinetics and clinical response in patients with ulcerative colitis. Int J Clin Pharmacol Ther. 2010;48:297–308.
- Ternant D, Ducourau E, Perdriger A, et al. Relationship between inflammation and infliximab pharmacokinetics in rheumatoid arthritis. Br J Clin Pharmacol. 2014;78:118–128.
- Ahn JE, Karlsson MO, Dunne A, et al. Likelihood based approaches to handling data below the quantification limit using NONMEM VI. J Pharmacokinet Pharmacodyn. 2008;35:401–421.
- Wählby U, Thomson AH, Milligan PA, et al. Models for time-varying covariates in population pharmacokinetic-pharmacodynamic analysis. Br J Clin Pharmacol. 2004;58:367–377.
- Ette EI. Stability and performance of a population pharmacokinetic model. J Clin Pharmacol. 1997;37:486–495.
- Mould DR, Upton RN. Basic concepts in population modeling, simulation, and model-based drug development-part 2: introduction to pharmacokinetic modeling methods. CPT Pharmacometrics Syst Pharmacol. 2013;2:e38.
- Bergstrand M, Karlsson MO. Handling data below the limit of quantification in mixed effect models. AAPS J. 2009;11:371–380.
- Klotz U, Teml A, Schwab M. Clinical pharmacokinetics and use of infliximab. Clin Pharmacokinet. 2007;46:645–660.
- Savic RM, Karlsson MO. Importance of shrinkage in empirical Bayes estimates for diagnostics: problems and solutions. AAPS J. 2009;11:558–569.
- Xu Z, Seitz K, Fasanmade A, et al. Population pharmacokinetics of infliximab in patients with ankylosing spondylitis. J Clin Pharmacol. 2008;48:681–695.