Abstract
The effects of hydrogen peroxide (H2O2) on prawn NAGase activity for the hydrolysis of pNP-β-D-GlcNAc have been studied. The results show that H2O2 can reversible inhibit the enzyme (IC50 ≏ 0.85 M) and the inhibition is of a mixed type. The kinetics show that k+0 is much larger than indicating the free enzyme is more susceptible than the enzyme-substrate complex in the H2O2 solution. It is suggested that the presence of the substrate offers marked protection against inhibition by H2O2. Changes of activity and conformation of the enzyme in different concentrations of H2O2 have been compared by measuring the fluorescence spectra and residual activity and show that the change of conformation is more rapidly than that of the residual activity, which implies that the whole conformation of the enzyme changes more rapidly than the conformation of the active centre of the enzyme in the H2O2 solution.
1 Introduction
The enzymatic degradation of chitin, a linear polymer of N-acetylglucosamine (NAG) units, is carried out by exo-chitinase, endo-chitinase and β-N-Acetyl-D-glucosaminidase (NAGase, EC 3.2.1.52). NAGase catalyzes the hydrolysis of dimer and trimer oligomers of NAG into monomer NAG. The enzyme is ubiquitous and has been studied from animals, plants and microbes Citation1-4. Their functions vary from playing an important role in defense systems against parasites, moulting cycle and digestion of chitinous foods and so on. In crustaceans, NAGase also play an important role in the moulting and hatching processes [Citation5]. Crustacean NAGases in Antarctic krill [Citation6,Citation7], lobster (Homarus americanus) [Citation8], and fiddler crab (Uca pugilator) [Citation9] have also been characterized in terms of enzyme purification, enzymatic properties, their concentrations in different growth stages and distribution in different organs, respectively. However, very little is known about NAGase from Prawn (Penaeus vannamei). In our previous studies, we reported the purification and some characterizations of prawn NAGase [Citation10].
Hydrogen peroxide (H2O2) is a relatively nonspecific oxidizing agent that has been extensively used for the study of methionine oxidation in proteins. It also has the potential to oxidize cysteine, tyrosine, histidine, and tryptophan. The oxidation of amino acids may change the protein's global conformation or the electronic configuration around the oxidized residue, leading to structure change and the activity loss. Specific protein activities have been shown to be both up- and down-regulated following methionine oxidation. Also, in specially designed model peptides, methionine oxidation has been shown to serve as a conformational switch between α-helical and β-sheet structures [Citation11]. At present, the effect of H2O2 on prawn NAGase has been little reported. In our investigation, we found that enzyme activity could be strongly affected by H2O2, and the inhibition of the enzyme in H2O2 solution was shown to be reversible. The aim of this current paper is, therefore, to carry out a kinetics study on the inhibition of NAGase by H2O2 to significantly improve knowledge on this aspect.
Materials and methods
Preparation of prawn NAGase (EC3.2.1.52) was as described previously [Citation10]. The crude preparation was further chromatographed on a Sephadex G-100 column following on a DEAE-cellulose column. The final preparation was homogeneous on PAGE and SDS-PAGE. The specific activity of the purified enzyme was 1560 U/mg. p-Nitrophenyl-N- acetyl-β-D-glucosaminide (pNP-β-D-GlcNAc) was purchased from the Biochemistry Laboratory of Shanghai Medicine Industry Academy (China). Sephadex G-100 was from Pharmacia and DEAE-cellulose (DE-32) was from Whatman. Hydrogen Peroxide (H2O2) and all other reagents were local products of analytical grade. The water used was re-distilled and ion-free.
Enzyme concentration was measured by the method of Lowry et al. [Citation12]. Enzyme activity was determined at 37°C by following the increase in absorbance at 405 nm, using a Beckman UV-650 spectrophotometer, accompanying the hydrolysis of the substrate (pNP-β-D-GlcNAc) [Citation13] with a pNP molar absorption coefficient of 1.73 × 10⁴ M− 1 cm− 1[Citation14]. A portion of 10 μl of enzyme solution was added to the reaction media (2.0 ml) containing 0.5 mM pNP-β-D-GlcNAc in 0.15 M NaAc-HAc buffer (pH5.2). After reaction for 10 min at 37°C, 2 ml of 0.5 M NaOH was added to the reaction mixture to stop the reaction. One unit (U) of enzymatic activity was defined as the amount of enzyme required to produce 1 μM of pNP per minute under these conditions.
The fluorescence spectra were measured with a Hitachi 4010 spectrophotometer. 50 μg of NAGase was dissolved in 1.0 ml of 0.15 M NaAc-HAc buffer (pH 5.2) with different concentrations of H2O2. The mixture was preincubated for 2 min before fluorescence spectra measurements with an excitation wavelength of 280 nm. The temperature was controlled constant at 37°C.
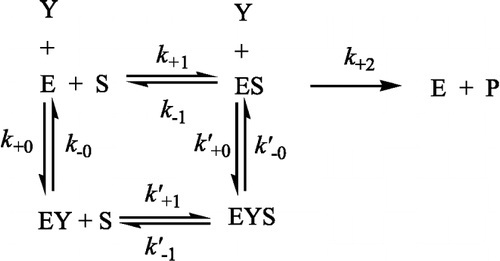
The progress-of-substrate-reaction theory previously described [Citation15] was applied to the current study of the inhibition kinetics of prawn NAGase by H2O2. In this method, 10 μl of enzyme (4 μM) was added to 2.0 ml of assay system containing different concentrations of substrate in 0.15 M NaAc-HAc buffer (pH 5.2) with different concentrations of H2O2 at a constant temperature of 37°C. The substrate reaction progress curve was analyzed to obtain the reaction rate constants as detailed below. The time course of hydrolysis of the substrate in the presence of different H2O2 concentrations showed that, at each concentration of H2O2, the rate decreased with time until a straight line was approached. The results showed that the inhibition reaction was a reversible reaction with fractional residual activity. This can be written as: Scheme Citation16-18:
where E, S, Y and P denote enzyme, substrate, H2O2 and product, respectively; ES, EY and EYS are the respective compounds. As is usually the case, [S] ≫[E0] and [Y] ≫ [E0], the product formation can be written as [Citation14]:
where [P]t is the concentration of the product formed at time t, which is the reaction time; A and B are the apparent rate constants for the forward and reverse reactions of inhibition, respectively; [S] and [Y] are the concentrations of the substrate and H2O2, respectively; v is the initial rate of reaction in the absence of H2O2, and
When t is sufficiently large, the curves become straight lines and the product concentration is written as [P]calc:
Combining Equations (1) and (4) yields
where [P]calc is the product concentration to be expected from the straight-line portions of the curves as calculated from Equation (4) and [P]t is the product concentration actually observed at time t. Plots of ln([P]calc − [P]t) versus reaction time (t) give a series of straight lines at different concentrations of H2O2 with slopes of − (A[Y] +B). A secondary plot of the slopes versus [Y] gives a straight line. The apparent forward and reverse rate constants, A and B, can be obtained from the slope and intercept of this straight line.
Combining Equations (2) and gives,
A plot of
versus 1/[S] gives a straight with slope
and intercept of
on the y-axis. As Km and Vm are known quantities from the measurements of the substrate reaction in the absence of the inactivator at different substrate concentrations, the rate constants k+0 and
can be obtained from the slope and intercept of the straight line.
Results
Determination of the kinetic parameters of the enzyme
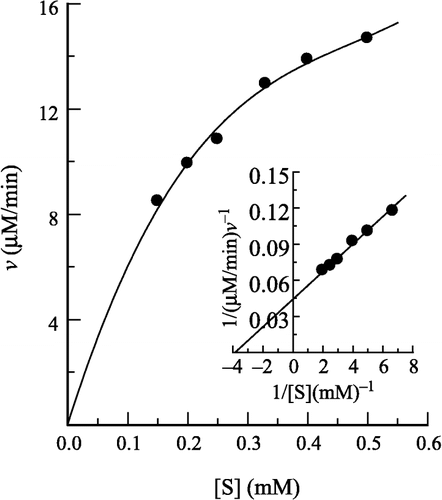
The kinetic behavior of prawn NAGase for the hydrolysis of pNP-β-D-GlcNAc has been studied in the absence of H2O2. Under the condition employed in the present study, the hydrolysis of pNP-β-D-GlcNAc by the enzyme follows Michaelis-Menten kinetics (). Kinetic parameters for this enzyme have been determined and the results obtained are shown in the inset of as a Lineweaver–Burk plot. The values of Km and Vm are determined to be 0.259 mM and 22.60 μM/min, respectively.
Figure 1 Determination of the kinetic parameters of prawn NAGase. Conditions were 2 ml system containing 0.15 M NaAc-HAc buffer (pH 5.2) and different concentrations of pNP-β-D-GlcNAc at 37°C. The enzyme final concentration was 0.020 μM. The inset is a Lineweaver-Burk plot for the determination of Km and Vm for NAGase on the hydrolysis of pNP-β-D-GlcNAc.
Effect of H2O2 on the enzyme activity
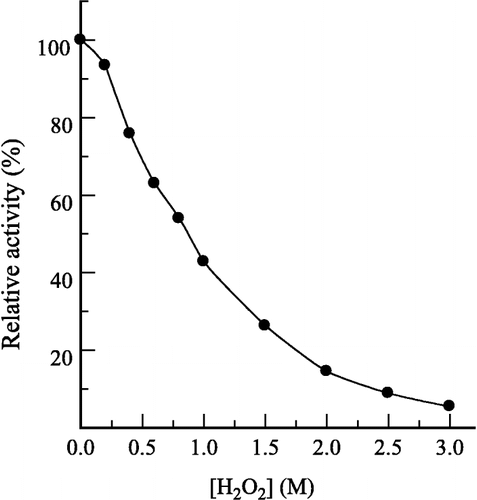
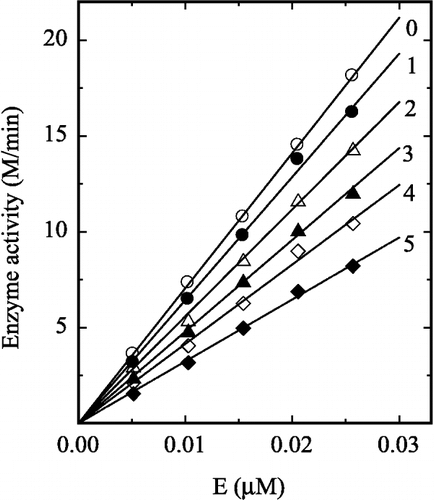
The effect of H2O2 on the hydrolysis of pNP-β-D-GlcNAc by prawn NAGase was first studied. The relationship between residual enzyme activity and the concentrations of H2O2 is shown in . The effect of H2O2 on the enzyme was concentration-dependent. The residual enzyme activity rapidly decreased with increasing concentrations of H2O2. The H2O2 concentration leading to 50% activity lost (IC50) was estimated to be 0.85 M. The mechanism for inhibition of the enzyme by H2O2 for the hydrolysis of pNP-β-D-GlcNAc was studied. shows the relationship between enzyme activity and its concentration in the presence of different concentrations of H2O2. The plots of the remaining enzyme activity versus the concentrations of enzyme in the presence of different concentrations of H2O2 gave a family of straight lines, which all passed through the origin. Increasing the H2O2 concentration resulted a decrease of the line slope, indicating that the inhibition of H2O2 on the enzyme was a reversible reaction course. The presence of H2O2 did not bring down the amount of the efficient enzyme, but just resulted in the inhibition and a decrease in the activity of the enzyme.
Determination of the inhibition type by H2O2 on the enzyme
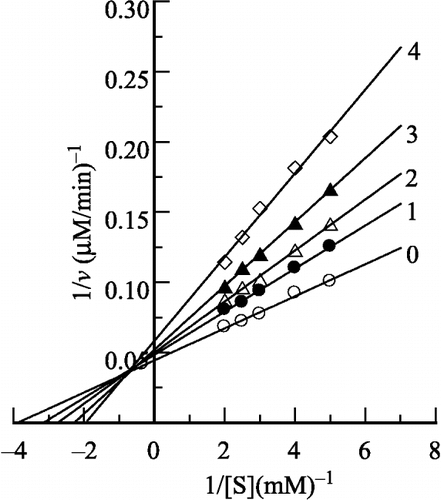
In the presence of H2O2, the inhibition kinetics of the enzyme are shown in as Lineweaver–Burk plots. The results showed that the inhibition of the enzyme by H2O2 was a mixed-typed since increasing the H2O2 concentration resulted in a family of lines with different slope and intercept, and they intersected in the second quadrant. This observed behaviour indicated that both free enzyme and enzyme-substrate complex were inhibited in H2O2 solution.
Kinetics of the substrate reaction in the presence of different concentrations of H2O2
The temporal variation of the product concentration during substrate hydrolysis in the presence of different H2O2 concentrations is shown in . At each concentration of H2O2, the rate decreased with increasing time until a straight line was approached, the slope of which decreased with increasing H2O2 concentration. The results suggested that inhibited NAGase still had partial residual activity (curves 1–4). The above results, as analyzed by Tsou's method[Citation15], suggested that formation of the inhibited EY or EYS complex was a slow and reversible reaction. According to Equation (5), plots of ln ([P]calc − [P]t) versus t give a series of straight lines with slopes of − (A[Y] +B) as shown in .
Figure 5 Course of inhibition of the enzyme in different concentrations of H2O2. The assay conditions were the same as in Figure 1 except that the concentration of pNP-β-D-GlcNAc was 0.4 mM. (a) Substrate reaction course. The final H2O2 concentrations for curves 0–4 were 0, 0.2, 0.4, 0.6, and 0.8 M, respectively. (b) Semilogarithmic plots of ln([P]calc − [P]t) against time. Data were taken from curves 1–4 in (a).
![Figure 5 Course of inhibition of the enzyme in different concentrations of H2O2. The assay conditions were the same as in Figure 1 except that the concentration of pNP-β-D-GlcNAc was 0.4 mM. (a) Substrate reaction course. The final H2O2 concentrations for curves 0–4 were 0, 0.2, 0.4, 0.6, and 0.8 M, respectively. (b) Semilogarithmic plots of ln([P]calc − [P]t) against time. Data were taken from curves 1–4 in (a).](/cms/asset/a4771fe4-d418-476a-9c44-d28172c6b35e/ienz_a_114862_f0006_b.gif)
Kinetics of the reaction at different substrate concentrations in the presence of H2O2
shows the kinetic course of the reaction at different substrate concentrations in the presence of 0.4 M of H2O2. It can be seen from that when t is sufficiently large, the curves become approximately straight lines. Both the initial rate and the slope of the asymptote increase with increasing substrate concentration. Similarly, plots of ln([P]calc − [P]t) versus t give a family of straight lines at different concentrations of the substrate with slopes of − (A[Y] +B) as shown in .
Figure 6 Course of inhibition at different substrate concentration in the presence of 0.40 M H2O2. (a) Curves 1–5 are progress curves with 0.50, 0.40, 0.33, 0.25 and 0.20 mM pNP-β-D-GlcNAc, respectively. (b) Semilogrithmic plot of ln ([P]calc − [P]t) against time. Data were taken from curves 1–5 in (a).
![Figure 6 Course of inhibition at different substrate concentration in the presence of 0.40 M H2O2. (a) Curves 1–5 are progress curves with 0.50, 0.40, 0.33, 0.25 and 0.20 mM pNP-β-D-GlcNAc, respectively. (b) Semilogrithmic plot of ln ([P]calc − [P]t) against time. Data were taken from curves 1–5 in (a).](/cms/asset/b55147f4-4bb4-4538-8949-75b2d1befe1c/ienz_a_114862_f0007_b.gif)
Determination of the microscopic rate constants for inhibition of the enzyme by H2O2
A plot of the slopes of the straight lines in versus H2O2 concentration [Y] gives the straight line, line 2 in . Similarly, data collected for other substrate concentrations give the other straight lines in . All the straight lines have a common intercept on the ordinate, indicating that k− 0 and have the same values. The apparent reverse rate constant B can be obtained from the ordinate intercept. The value of B is then equal to the microscopic rate constant k− 0 and
given in .
Figure 7 Secondary plots of the slopes of the semilogarithmic plots versus [H2O2] for a series of fixed substrate concentrations. The data for curve 2 is from Figure 5b (at 0.40 mM substrate). Substrate concentrations for curves 1–5 were 0.50, 0.40, 0.33, 0.25, 0.20 mM, respectively.
![Figure 7 Secondary plots of the slopes of the semilogarithmic plots versus [H2O2] for a series of fixed substrate concentrations. The data for curve 2 is from Figure 5b (at 0.40 mM substrate). Substrate concentrations for curves 1–5 were 0.50, 0.40, 0.33, 0.25, 0.20 mM, respectively.](/cms/asset/aa460b45-0a24-4294-9c30-dc1540e1b0ab/ienz_a_114862_f0008_b.gif)
Table I. Microscopic rate constants of the inactivation of prawn NAGase in H2O2 solution.
From Equation (6), a plot of versus 1/[S] gives a straight line () where the slope and the intercept of the straight line give the value of
and
which were used to determine the inhibition rate constants k+0 and
. These rate constants are given in .
Fluorescence emission spectra of the enzyme inhibited by H2O2
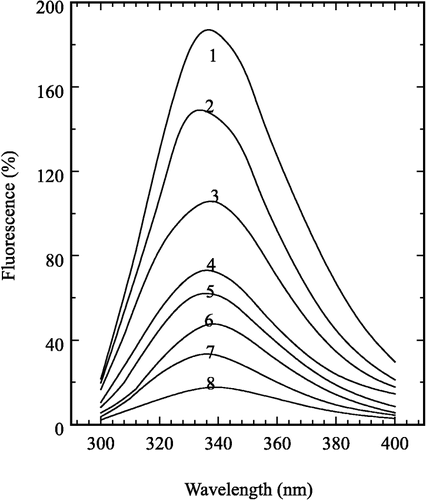
The fluorescence emission spectra of prawn NAGase inhibited by H2O2 is shown in . An excitation wavelength of 280 nm was used and the emission peak of the native enzyme is at 337.4 nm, which is contributed by Trp, Tyr and Phe residues [Citation19]. The emission peak at 337.4 nm decreased in intensity with increasing H2O2 concentration, but no obvious shift was seen. When H2O2 concentration reached 1.2 M, the fluorescence was approximatively quenched and the intensity decreased to a minimal value. Changes in the intrinsic fluorescence spectra of the enzyme suggested that the aromatic residues had been affected by H2O2 and the microenvironments of these residues had been markedly changed. H2O2 could combine the residues reversibly, which induced chemical conversion of the residues and change of the enzyme conformation in a reversible manner.
Discussion
It is known that many reactions take place in organisms that may form peroxide which is an oxidant and can oxidize some amino acids such as cysteine, tyrosine, tryptophan and methionine in proteins [Citation11,Citation20]. When these amino acid residues are oxidized, the protein conformation and its function will change. Thus, superfluous peroxides easily induce disease or endanger the animal's survival. H2O2 is the typical peroxide, so the investigation of the effect its on prawn NAGase is of considerable significance for breeding Penaeus vannamei.
In this paper, we discuss the inhibition kinetics of prawn NAGase in H2O2 solution, and evaluate the relationship between its conformation and its activity at different concentrations of H2O2. The results show that the inhibition of the enzyme by H2O2 is reversible. The enzyme activity decreases rapidly with increasing H2O2 concentration. From the results listed in Table, it is readily seen that k+0 is larger than indicating that the free enzyme molecule is more sensitive than the enzyme-substrate complex to H2O2 and substrate can protect enzyme activity.
Accompanying the increase in H2O2 concentration, the fluorescence emission spectra show an obvious change; the fluorescence intensity quickly decreases without any peak shift. The changes in enzyme activity and fluorescence intensity are compared. At a concentration of 0.2 M H2O2, the fluorescence intensity decreases 43.5% but the enzyme activity just loses 6.6%. When the H2O2 concentration reaches 1.2 M, the fluorescence intensity is almost quenched and the enzyme activity retains 32.5%. In accord with the literature about on enzymes or proteins, only aromatic amino acid residues have intrinsic fluorescence spectra. The maximal fluorescence intensities of Trp, Tyr, Phe residue are at 348 nm, 303 nm and 282 nm, respectively [Citation19]. Changes in the intrinsic fluorescence spectra of the enzyme (in ) suggests that the aromatic residues had been affected by H2O2. The fluorescence intensity decreases more rapidly than the residual activity, which implies that the conformation of the whole enzyme molecule is flexible in H2O2 solution. The results obtained suggest that H2O2 not only oxidizes methionine, but also possibly oxidizes the Tyr and Trp residues from the exterior of the enzyme active site [Citation21]. These outer oxidized residues may change the enzyme's global conformation or its electronic configuration, leading to the reversible activity loss.
Acknowledgements
The present investigation was supported by grant 2004J054 of the Scientific Technology Innovation Fund for the Young Scholar of Fujian Province.
References
- Koga D, Shimazaki C, Yamamoto K, Inoue K, Kimura S, Ide A. Agric Biol Chem 1987; 51: 1679–1681
- Cannon RD, Nimi K, Jenkinson HF, Shepherd MG. J Bacteriol 1994; 176: 2640–2647
- Moudni BEL, Rodier MH, Jacquemin JL. Exp Parasitol 1996; 83: 167–173
- Zen KC, Choi HK, Krishnamachary N, Muthukrishnan S, Kramer KJ. Insect Biochem Mol Biol 1996; 26: 435–444
- Funke B, Spindler KD. Artemia Research and its Applications, C Decleir, et al. Universa Press, Wetteren 1987; 67–78
- Peters G, Saborowski R, Mentlein R, Buchholz F. Comp Biochem Physiol 1998; 120B: 743–751
- Peters G, Saborowski R, Buchholz F, Mentlein R. Mar Biol 1999; 134: 697–703
- Lynn KR. Comp Biochem Physiol 1990; 96B: 761–766
- Zou E, Fingerman M. Mar Biol 1999; 133: 97–101
- Xie XL, Chen QX, Lin JC, Wang Y. Mar Biol 2004; 146: 143–148
- Nakao LS, Iwai LK, Kalil J, Augusto O. FEBS Lett 2003; 547: 87–91
- Lowry OH, Rosebrough NJ, Farr AL, Randall RJ. J Biol Chem 1951; 193: 265–269
- Kono M, Matsui T, Shimizu C, Koga D. Agric Biol Chem 1990; 54: 2145–2147
- Chen QX, Zhang W, Zheng WZ, Zhao H, Yan SX, Wang HR, Zhou HM. J Protein Chem 1996; 15: 345–350
- Tsou CL. Adv Enzymol Related Areas Mol Biol 1988; 61: 381–436
- Zhang RQ, Chen QX, Xiao R, Xie LP, Zeng XG, Zhou HM. Biochim Biophys Acta 2001; 1545: 6–12
- Chen QX, Song KK, Wang Q, Huang H. J Enz Inhib 2003; 18: 491–496
- Chen QX, Zhang W, Yan SX, Zhang T, Zhou HM. J Enz Inhib 1997; 12: 123–131
- Chen QX, Zhang Z, Huang H, Zhao FK, Xu GJ. Int J Biochem Cell Biol 2003; 35: 1227–1233
- Lin JC, Chen QX, Shi Y, Li SW, Zhao H. IUBMB Life 2003; 35: 547–552
- Chen QX, Zhang Z, Zhou XW, Zhuang ZL. Int J Biochem Cell Biol 2000; 32: 717–723

![Figure 8 Plot of A/v versus 1/[S]. The values of v and A were obtained from Figures 1 and 7.](/cms/asset/04bced5b-f6cd-4b70-9a98-a1919a26c6c5/ienz_a_114862_f0009_b.gif)
