Abstract
When an unstable enzyme is incubated with its substrate(s), catalysis may cease before chemical equilibrium is attained. The residual substrate concentrations depend on their initial concentrations, the initial enzymic activity, and the inactivation rate constants for each molecular species that comprise the catalytic cycle. The underlying theory has been elaborated previously for single-substrate reactions and here it is extended to bi-substrate reactions. The theory is illustrated by application to glucose 6-phosphate dehydrogenase, which is unstable when exposed to a low concentration of sodium dodecyl sulphate. It is shown that the ternary complex containing both substrates is resistant to inactivation while each of the remaining complexes undergoes first-order decay. Rate constants for the inactivation of each complex are calculated.
Introduction
When an enzyme is incubated with its substrate(s), catalysis normally proceeds until the substrates and products are in chemical equilibrium. If the reaction is nearly irreversible, this equilibrium will approximate exhaustion of the limiting substrate. This simple property is used widely for the estimation of biochemical compounds.
If the enzyme is unstable, its activity will decline over time leading to the possibility that all activity is lost before chemical equilibrium is attained. In these circumstances there will be some residual substrate even when the catalyzed reaction itself is irreversible. Previous work by this author [Citation1] and others [Citation2] has developed the basic theory and equations for this situation for enzymes catalyzing single-substrate reactions.
One of the outcomes of this theory is specific predictions about the effects of variations in the initial substrate concentration and the initial enzymic activity on the residual concentration of substrate. From these measurements it is possible to quantify the inactivation rates of various complexes along the catalytic pathway. This theory has been applied to, and extended for, several enzymes Citation3-12. For example, alkaline phosphatase is inactivated by metal-chelating agents [Citation3]. It was shown that the essential zinc ion is only accessible in the free enzyme; it is locked into the enzyme-substrate and enzyme-phosphate complexes of the catalytic cycle, making these resistant to inactivation by chelators. Of particular interest are mechanism-based inhibitors (“suicide substrates”), which inactivate a catalytic intermediate without affecting the free enzyme. A recent example of this is illustrated by the effect of hydroxypyruvate on acetohydroxacid synthase [Citation10].
To date, the theory has been applied mainly to enzymes catalyzing single-substrate reactions, or to ones where the effect of any second substrate can be ignored. Here I develop a general extension to bi-substrate reactions and illustrate the theory with some results on the inactivation of Leuconostoc mesenteroides glucose 6-phosphate (G6P) dehydrogenase.
Theory
The basic mechanism that is considered here is shown in Scheme . It is assumed explicitly that the conversion of EAB to EQ is irreversible, which may result from the irreversible release of product P, or its removal by a coupling reaction. In the specific case of G6P dehydrogenase, the overall reaction is irreversible due to the rapid and spontaneous hydrolysis of the 6-phosphoglucono-δ-lactone product.
Scheme 1 Inactivation mechanism of a bi-substrate enzyme-catalyzed reaction. The conventional catalytic pathway for an ordered sequential mechanism is shown at the top, with the conversion of EAB to EQ taken to be irreversible. This could occur by release of a product that is then removed by further reaction. Each discrete enzyme species is capable of undergoing conversion to the inactive species F1 to F4, at rates governed by the rate constants j1 to j4, respectively.

Each of the complexes on the catalytic pathway is subject to inactivation in a first-order manner, being converted to the inactive forms Fl to F4 with rate constants jl to j4, respectively. It does not matter whether Fl to F4 are identical, or if they differ from one another either in conformation or molecular composition. The rate of catalysis (v) for the ordered Bi Bi mechanism [Citation13] can be simplified by setting [P] = 0, giving Equations (1-3) in which is the total concentration of active enzyme (i.e. that which has not decayed to Fl − F4). The kinetic constants Ka, Kb, Kia and Kiq have their conventional definitions [Citation13].
In order to derive an expression for the total rate of enzyme inactivation, it is necessary to know the fraction of the enzyme that is present as each of the four species on the catalytic pathway. These fractions are given as Equations (4-7) where λ is the dimensionless quantity k5/(k5+k7).
Using Equations (1-7) it is possible to write differential equations for the time dependence of substrate concentrations (e.g. d[A]/dt) and active enzyme (). However, these equation cannot be solved algebraically because d[A]/dt depends upon [E]o and
depends upon [A]. As outlined by Duggleby [Citation1], the two differential equations can be combined to obtain an expression for the change in enzyme activity relative to the change in the substrate concentration (i.e.
). Integrating and setting
defines residual substrate concentration when all enzymic activity has been lost and catalysis ceases. This can be done for any initial concentration of substrates and enzyme but it is more useful to consider some limiting cases that can be set up in practice. These are a saturating concentration of substrate A, and a saturating concentration of substrate B. The effects of these simplifying conditions are illustrated in Scheme . When neither substrate is saturating, the catalytic cycle is as represented in the upper panel of Scheme . However, saturating with A (middle panel, Scheme ) means that when EQ releases Q to form E, this will be converted immediately and irreversibly to EA. Effectively, there is a single irreversible step where EQ is converted directly to EA. Similarly, saturating with B (bottom panel, Scheme ) results in the conversion of E to EAB in a single irreversible step. The relevant equations for these two situations will now be developed.
Scheme 2 Simplifications of the mechanism of a bi-substrate enzyme-catalyzed reaction. The conventional catalytic cycle for Scheme 1 is shown in the top panel. Saturation with substrate A effectively removes free enzyme (E) from the cycle (middle panel), while saturation with substrate B results in direct conversion of E to EAB (bottom panel).

Saturating [A]. When the concentration of substrate A is much greater than both Ka and Kia, Equations (1-7) are greatly simplified as shown by Equations (8) and (9). Expressions for v, and
are not shown as they are identical Equations (1), (5) and (6) except for the replacement of Δ by Δa, while
.
Using these relationships, we may write an expression for the change in enzyme activity relative to the change in the concentration of the non-saturating substrate, B. This is given as Equation (10).
Integrating Equation (10) and setting yields an expression (Equation 11) that relates [B]f, the residual concentration of substrate B, to its initial concentration ([B]o), and the original amount of enzyme before inactivation ([E]o).
In Equation (11), Vm equals kc[E]o while jb is a composite inactivation rate constant that is defined by Equation (12).
It is evident from Equation (11) that a plot of Vm/([B]o–[B]f) against ln([B]o/[B]f)/([B]o–[B]f) will yield a straight with a slope of j2Kb and a non-negative intercept on the ordinate at jb.
Saturating [B]. An alternative experimental simplification is to set the concentration of substrate B much higher than Kb. In these circumstances, the expressions for v and [EAB]/[E]′o are identical to Equation (1) and (6) except that Δ is replaced by Δb (Equation 13).
The quantity becomes zero while the remaining distribution equations are given by Equations (14) and (15).
Integrating, setting and rearrangement then gives Equation (16).
Plotting Vm/([A]o − [A]f) against ln([A]o/[A]f)/([A]o − [A]f) gives a family of straight lines with a slope that increases in a linear fashion with the initial concentration of substrate A. These lines meet on the ordinate at a value of jb − j4Ka/Kiq that is not constrained to be positive.
Materials and methods
L. mesenteroides G6P dehydrogenase, G6P, NAD+, NADP+ and NADPH were purchased from the Sigma Chemical Company (St. Louis, MO, USA). Other chemicals were obtained from local commercial suppliers. For steady-state kinetic measurements, reactions contained G6P, NAD+ (or NADP+) and NADPH concentrations as required for the particular experiment, and 0.025% (w/v) sodium dodecyl sulphate (SDS) in 0.1 M Tris-HCl buffer (pH 7.8). Reactions were initiated by adding the enzyme and followed at 340 nm and 30°C. For inactivation experiments, the enzyme was incubated at 30°C in the desired buffer and the residual activity was measured by taking samples at timed intervals. These were then added to reaction mixtures as above, but omitting SDS to prevent further inactivation, and the initial velocity was measured. End-point assays used a similar procedure to steady-state kinetic measurements except that the reaction was followed to completion at a wavelength ( ≥ 340 nm) chosen so that the total change in absorbance was no greater than 1.5. Using the spectrum of authentic NAD(P)H as a reference, the amount formed in the reaction was determined.
Results
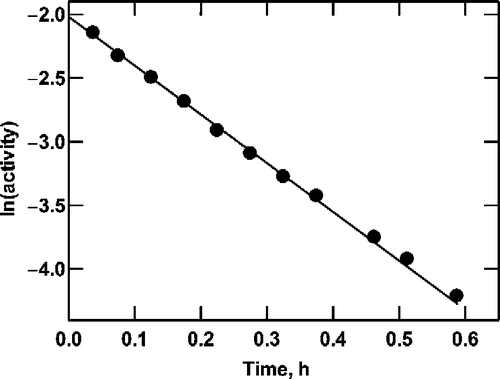
G6P dehydrogenase from L. mesenteroides is a fairly stable enzyme. In order to induce instability for the purpose of testing the theory outlined above, SDS (0.025%, w/v), was added. Under these conditions the enzyme is unstable, showing a first-order loss of activity for at least three half-lives (). The rate constant for activity loss is 3.83 ± 0.06 h− 1. Addition of a saturating (10 mM) concentration of NAD+ destabilizes the enzyme somewhat (data not shown), increasing the inactivation rate constant to 9.74 ± 0.37 h− 1. In contrast, both NADH and NADPH results in some stabilization (data not shown); for the latter compound, the inactivation rate constant decreases to 1.43 ± 0.09 h− 1.
Figure 1 Inactivation of G6P dehydrogenase. Enzyme was incubated at 30°C in 0.1 M Tris-HCl (pH 7.8) containing 0.025% (w/v) SDS. At intervals, samples were removed and assayed for residual activity. The initial activity was 0.22 U/mL.

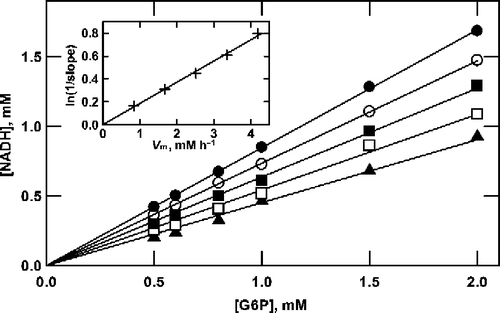
One result of this instability is that after prolonged incubation of the enzyme with limiting [G6P] (substrate B) and excess [NAD+] (substrate A), the amount of NADH formed is less than the amount of G6P initially present (). The extent of reaction appears to be proportional to the initial concentration of G6P with the slope inversely related to the amount of enzyme added. When ln(1/s1ope) is plotted against the quantity of enzyme, the results are described by a straight line passing through the origin (, inset).
Figure 2 Product formation by G6P dehydrogenase at saturating NAD+. Reactions were as described in the text, containing 10 mM NAD+, G6P as shown (0.5 to 2.0 mM) and initial enzyme concentrations of 70 (•), 56 (○), 42 (▪), 28 (▪) and 14 (▴) mU/mL. A straight line passing through the origin was fitted by linear regression to the data at each enzyme concentration to determine the slope. As shown in the inset, the value of ln(1/slope) is proportional to the enzyme concentration.

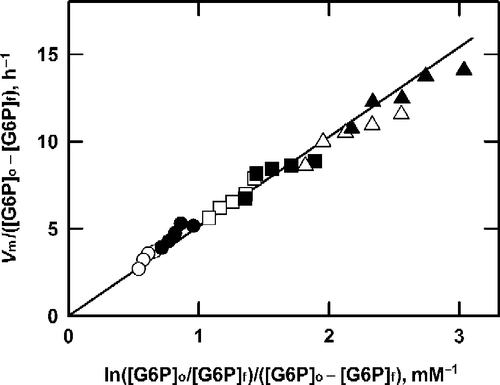
It has been shown previously [Citation1] that the results seen in are characteristic of an unstable enzyme that forms a stable enzyme-substrate complex. In terms of Equation (11), jb would be zero while j2 would be finite. This interpretation received further support when the results shown in were used to construct a plot () of Vm/([G6P]o − [G6P]f) versus ln([G6P]o/[G6P]f)/([G6P]o − [G6P]f). It is clear that irrespective of the initial G6P and enzyme concentration, a common straight line describes all of the data, which is consistent with Equation (11). Moreover, the intercept on the ordinate (jb) is close to zero, confirming the conclusion drawn from . Assuming that the line in passes through the origin, its slope (j2Kb) was estimated. Knowing that Kb is equal to 0.550 mM (determined from steady-state kinetic measurements, data not shown) yields a value for j2 of 9.507 ± 0.130 h− 1. Two further repetitions of this experiment gave similar results: 8.307 ± 0.183 h− 1 and 9.017 ± 0.206 h− 1; analysis of the combined results from three experiments gave a value for j2 of 8.953 ± 0.114 h− 1.
Figure 3 Analysis of product formation by G6P dehydrogenase at saturating NAD+. The data from Figure 2 are plotted according to Equation (11).

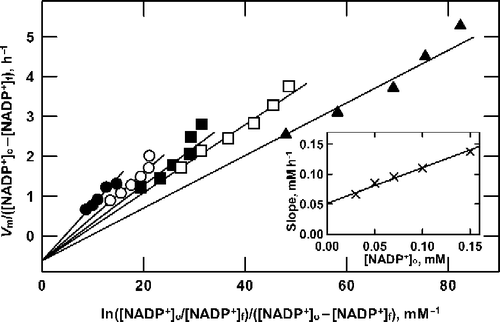
As mentioned earlier, jb is a composite rate constant (Equation 12) that depends on the values of j3, j4 and λ. In order to separate j4 from jb, a second series of experiments was performed in which the concentration of the pyridine nucleotide was varied while maintaining G6P at a high and saturating concentration. To avoid very high substrate concentrations, these experiments were performed using NADP+ rather than NAD+ because the former has a much lower Michaelis constant. The results from one such experiment are shown in from which it is clear that the data fall on a series of straight lines with a common intercept on the ordinate below the origin and with slopes that depend on the initial concentration of NADP+. This is in accord with Equation (16), which requires that the slopes of the lines should be a linear function of the initial concentration of NADP+; as shown in the inset to , this prediction is borne out by the data.
Figure 4 Analysis of product formation by G6P dehydrogenase at saturating G6P. Reactions were as described in the text, containing 10 mM G6P and 150 (•), 100 (○), 70 (▪), 50 (▪) or 30 (▴) μM NADP+. For each concentration of NADP+ the enzyme concentration was varied from 0.69 to 2.76 mU/mL, to obtain the series of data points shown along each line shown. Data are plotted according to Equation (16). As shown in the inset, the slope of the lines in the main graph is proportional to the NADP+ concentration.

Equation (16) may be considered to be defined by three independent parameters; j1Ka, j4Ka/Kiq and jb. I have determined Ka (11.9 μM) and Kiq (20.1 μM) from steady-state kinetic measurements so the data shown in may be used to estimate j1, j4 and the composite rate constant, jb. The results of such an analysis are shown in the first row of as experiment ‘1’.
Table I. Analysis of G6P dehydrogenase inactivation during catalysis with saturating G6P. Reactions were as described for Figure 4. Data from experiment 1 were analyzed by nonlinear regression using Equation (16) to obtain best fit values and standard errors for j1, j4 and jb (row 1) The latter was found to be close to zero so the data were reanalyzed with jb=0 (row 2). Experiments 2 (row 3) and 3 (row 4), and the combined results from all three experiments (row 5) were also analyzed with jb=0.
The value of jb is not well determined with a standard error more than five times the value. Moreover, jb is negative which is physically meaningless. This is because the definition of λ is such that it must lie in the range 0 to 1; therefore jb can only fall in the range j3 to j4 (Equation 12) and must therefore be positive. The most reasonable interpretation, and one that agrees with the conclusions drawn from Figures 2 and 3, is that jb = 0.
The data were reanalyzed with this constraint to obtain the results shown in the second row of . Two further experiments (, experiments 2 and 3) gave similar results to experiment 1 and the three sets of data were combined to give overall estimates of j1 and j4 (, bottom row).
Discussion
Values for the four inactivation rate constants (j1, j2, jb and j4) of Equations (11) and (16) have been determined. Although j3 has not been measured, the fact that jb is zero implies that j3 = 0, since jb must lie between j3 and j4 (Equation 12) and the latter is finite. It follows that λ must be close to zero, which will occur when catalysis (k5) is much slower than the rate constant for release of the lactone product (k7). The best estimates of the four inactivation rate constants are: j1 = 4.02 ± 0.17 h− 1, j2 = 8.95 ± 0.11 h− 1, j3 = 0 h− 1, and j4 = 1.28 ± 0.12 h− 1.
The rate constants j1, j2 and j4 correspond to the inactivation of free enzyme (E), EA and EQ (Scheme ). These rate constants could be confirmed independently by directly measuring inactivation of the enzyme when it was incubated under the appropriate conditions. One such experiment was shown in . The rate constant for loss of activity in the absence of substrates (3.83 ± 0.06 h− 1) should correspond to j1 (4.02 ± 0.17 h− 1, ) and there is good agreement between the values. In the presence of a saturating concentration of substrate A, the rate constant for inactivation was estimated to be 9.74 ± 0.37 h− 1, in reasonable agreement with the value of j2 determined from (8.95 ± 0.11 h− 1). Similarly, the value for j4 (1.28 ± 0.12 h− 1) should correspond to the inactivation rate constant for the enzyme saturated with Q. This rate constant was determined to be 1.43 ± 0.09 h− 1.
The values of j1, j2 and j4 are of a comparable magnitude, all in the range 1 to 10 h− 1. In contrast, j3 = is very much lower and seems to be close to zero. Why should the EAB complex be stable while each of the other enzyme forms in the catalytic cycle is susceptible to inactivation? In E, EA and EQ the active site must be open in order to admit entrance of a substrate or release of a product. However, in the ternary EAB complex, catalysis occurs. Thus it appears that the closure of the active site gives added stability to the enzyme.
Here I have shown that it is possible to extend the theory and analysis of unstable enzymes [Citation1] to those with two substrates. The theory was employed to analyze an enzyme catalyzing an ordered sequential mechanism. However, there is no reason why it could not be applied to enzymes with random or ping-pong mechanisms, or those where both products are kinetically significant. The equations would differ somewhat but the basic principles outlined here would remain the same. The process would involve the following steps.
Write down expressions for the fraction of enzyme present as each of the molecular species in the catalytic cycle. Computer programs are available to automate this process (e.g. [Citation14]).
Use these distribution equations to write down the overall rate equation (d[A]/dt) for the reaction mechanism.
Use these distribution equations to write down the overall rate of enzyme inactivation,
.
Combine these two differential equations to determine
.
Integrate and simplify for experimental conditions that can be achieved in practice.
| Abbreviations | ||
| G6P: | = | glucose 6-phosphate |
| SDS: | = | sodium dodecyl sulphate |
Acknowledgements
Some of the experiments reported here were performed by Stephen Pike.
References
- Duggleby RG. Progress curves of reactions catalyzed by unstable enzymes. A theoretical approach. J Theor Biol 1986; 123: 67–80
- Wang ZX, Tsou CL. An alternative method for determining inhibition rate constants by following the substrate reaction. J Theor Biol 1990; 142: 531–549
- Pike SJ, Duggleby RG. Resistance to inactivation by EGTA of the enzyme-substrate and enzyme-phosphate complexes of alkaline phosphatase. Biochem J 1987; 244: 781–785
- Garrido del-Solo C, García-Canovas F, Havsteen BH, Valero E, Varón R. Kinetics of an enzyme reaction in which both the enzyme-substrate complex and the product are unstable or only the product is unstable. Biochem J 1994; 303: 435–440
- Wang ZX, Wang HR, Zhou HM. Kinetics of inactivation of aminoacylase by 2-chloromercuri-4-nitrophenol – a new-type of complexing inhibitor. Biochemistry 1995; 34: 6863–6868
- Wang MH, Wang ZX, Zhao KY. Kinetics of inactivation of bovine pancreatic ribonuclease A by bromopyruvic acid. Biochem J 1996; 320: 187–192
- Wu Y, Wang ZX. Comparison of conformational changes and inactivation of soybean lipoxgenase-1 during urea denaturation. Biochim Biophys Acta 1998; 1388: 325–336
- Vaillancourt FH, Labbé G, Drouin NM, Fortin PD, Eltis LD. The mechanism-based inactivation of 2, 3-dihydroxybiphenyl 1,2-dioxygenase by catecholic substrates. J Biol Chem 2002; 277: 2019–2027
- Goličnik M. On a nonelementary progress curve equation and its application in enzyme kinetics. J Chem Inf Comput Sci 2002; 42: 157–161
- Duggleby RG. Suicide inhibition of acetohydroxyacid synthase by hydroxypyruvate. J Enz Inhib Med Chem 2005; 20: 1–4
- Toti P, Petri A, Gambicorti T, Osman AM, Bauer C. Kinetic and stability studies on the chloroperoxidase complexes in presence of tert-butyl hydroperoxide. Biophys Chem 2005; 113: 105–113
- Toti P, Petri A, Gambicorti T, Osman AM, Bauer C. Inactivation studies on native and silica gel non-homogeneous immobilized chloroperozidase. J Mol Catal B-Enzym 2006; 38: 65–72
- Cleland WW. Statistical analysis of enzyme kinetic data. Adv Enzymol 1967; 29: 1–32
- Varón R, García-Sevilla F, García-Moreno M, García-Cánovas F, Peyró R, Duggleby RG. Computer program for the equations describing the steady-state of enzyme reactions. Comput Appl Biosci 1997; 13: 159–167
