Abstract
Fatty acid synthase (FAS) is a potential target for cancer, but potent inhibitors against FAS are scarce. In this study, we found that activities of catechins on inhibiting FAS increased greatly by heating them in acid. The enhancement was positively correlated to H+ concentration. The inhibitory activities of the final products from different catechins were similar, all of which were less than 1 μg/mL. The product from ( − )-epigallocatechin gallate (EGCG) was stable at room temperature, and its inhibitory kinetics and reacting sites on FAS were obviously different from the known FAS inhibitors. It also affected the viability of MCF-7 cells more obviously than EGCG. A putative route of the reaction progress was proposed and the effective inhibitors were deduced to be oligomers of 2-hydroxy-3-(3′, 4′, 5′-trihydroxyphenyl) propenoic acid by analysis of their spectra. The work affords new and potent FAS inhibitors that would be promising candidates for the treatment of cancer.
| Abbreviations | ||
| FAS, | = | fatty acid synthase |
| EGCG, | = | ( − )-epigallocatechin gallate |
| EGC, | = | ( − )-epigallocatechin |
| OA, | = | overall reaction |
| KR, | = | ketoacyl reduction |
| HSCCC, | = | high speed counter-current chromatography |
| MALDI-TOF MS, | = | matrix assisted laser desorption/ionization time-of-flight mass spectrometry |
| C-2, E-2 and EG-2, | = | inhibitors of FAS derived from (+)-catechin, EGC and EGCG respectively |
Introduction
Animal fatty acid synthase (FAS, EC 2.3.1.85) is a key enzyme participating in energy metabolism in vivo. It consists of two identical polypeptides, each carrying seven discrete functional domains. FAS catalyzes the synthesis of long chain fatty acids de novo from acetyl-CoA, malonyl-CoA and NADPH [Citation1,Citation2].
Most human tissues, except liver and adipose tissue, exhibit low levels of FAS expression. However, the expression of FAS is surprisingly high in a variety of common human cancers, such as cancer of the breast, prostate, ovary and lung Citation3,Citation4,Citation5,Citation6. The inhibitors of FAS demonstrate selective cytotoxicity against human tumor cells. These merits make FAS an attractive therapeutic target for cancer [Citation7].
Gallated catechins are a series of inhibitors against FAS [Citation8]. For example, ( − )-epigallocatechin gallate (EGCG) is the first catechin that was found to inhibit FAS [Citation9]. Later, Yeh et al. reported that the expression of FAS was suppressed by EGCG at both protein and mRNA levels, which may lead to the inhibition of MCF-7 cell lipogenesis and proliferation [Citation10]. However, EGCG is not a very potent inhibitor of FAS, with an IC50 value more than 20 μg/mL [Citation9]. Ungallated catechins, such as (+)-catechin, ( − )-epigallocatechin (EGC) and ( − )-epicatechin, do not even exhibit inhibition on FAS, the IC50 values of which range from 464 to 1100 μg/mL [Citation8].
In this study, unexpectedly, some novel and potent FAS inhibitors with IC50 less than 1 μg/mL were produced from catechins, including both gallated and ungallated ones. The reaction conditions and the inhibitory characteristics of the products were determined. The effect of the product from EGCG on the growth of MCF-7 cells was studied. Through further analysis of the products, a route of the reaction and the structure of the effective product were established.
Materials and methods
Materials
Acetyl-CoA, malonyl-CoA, NADPH, (+)-catechin, gallic acid, tert-butyl methyl ether, trifluoroacetic acid and MTT were purchased from Sigma-Aldrich Co. (St. Louis, MO, USA). EGCG was from Shanghai Healthjoy Chemical Co. Ltd. (Shanghai, China). EGC was obtained from Shanghai U-sea Biotech Co. Ltd. (Shanghai, China). Acetonitrile, n-butanol and ethyl acetate were purchased from the Beijing Chemical Reagent Co. (Beijing, China), and the methanol used in the HPLC analysis was chromatographic grade. All other chemicals and reagents were local products of analytical grade.
Preparation of FAS and substrates
The preparation, storage and use of FAS from chicken liver were performed as described previously [Citation11]. The purified FAS was homogeneous on polyacrylamide gel electrophoresis in the presence and absence of SDS. The enzyme and substrate concentrations were determined by spectrophotometry using the following coefficients: chicken liver FAS, 4.83 × 10⁵ M− 1cm− 1 at 279 nm; acetyl-CoA, 1.54 × 10⁴ M− 1cm− 1 at 259 nm, pH 7.0; malonyl-CoA, 1.46 × 10⁴ M− 1cm− 1 at 260 nm, pH 6.0; NADPH, 6.02 × 10³ M− 1cm− 1 at 340 nm and 1.59 × 10⁴ M− 1cm− 1 at 259 nm, pH 9.0 [Citation12].
Assays of FAS activity
The FAS activity for the overall reaction (OA) was determined using an Amersham Pharmacia Ultrospec 4300 pro UV-Vis spectrophotometer (Buckinghamshire, England, UK) at 37°C by detecting the decrease in NADPH absorption at 340 nm. The assay system contained 100 mM KH2PO4-K2HPO4 buffer (pH 7.0), 1 mM EDTA, 1 mM dithiothreitol, 3 μM Acetyl-CoA, 10 μM Malonyl-CoA, 35 μM NADPH and 10 nM FAS in a total volume of 2.0 mL as previously described [Citation11,Citation12].
The FAS activity for the β-ketoacyl reduction (KR) was determined at 37°C by detecting the decrease in NADPH absorption at 340 nm. The reaction mixture contained 200 mM ethyl acetoacetate, 35 μM NADPH, 1 mM dithiothreitol and 10 nM FAS in 100 mM KH2PO4-K2HPO4 buffer (pH 7.0).
Assay of FAS inhibition
The inhibition was determined by adding a sample (inhibitor) to the reaction system before FAS initiated the reaction. FAS activity in the presence and absence of sample were designated as Ai and A0 respectively. Ai/A0 was the remaining activity (R.A.) of FAS.
Growth inhibition of breast cancer cells
Human breast cancer MCF-7 cells were used to test the growth inhibition by samples inhibiting FAS. The MTT cell viability assay was performed according to the manufacturer's instructions. Briefly, MCF-7 cells were harvested and washed with 1 × PBS (137 mM NaCl, 8.1 mM Na2HPO4, 2.7 mM KCl, 1.5 mM KH2PO4, pH 7.4) and then were diluted to a final concentration of 1 × 10⁵/mL in an assay medium. One hundred microliters of cell suspension (104 cells per well) were dispensed into 96-well plates. The plates were incubated at 37°C for 24 h in a humidified CO2 incubator. One hundred microliters of complete culture media with different concentrations of samples were added to the wells. Sequentially the plates were incubated at 37°C for 24 h in a humidified CO2 incubator. Then cultured cells were washed with warm PBS. For the color development, dye solution (0.5 mg/mL MTT in DMEM without phenol red) was added to each well and the plates were incubated at 37°C for 4 h. After the dye solution was removed, 100 μl solubilization/stop solution was added to each well. The plates were kept at 4°C overnight and then the absorbance rate at 570 nm was recorded by a 96-well plate reader. Experiments were performed in triplicate.
Preparation of potent FAS inhibitors from catechins
The inhibitory activities of catechins, including (+)-catechin, EGC and EGCG, on FAS were significantly enhanced by heating them in acid. After they were treated with 1 M sulfuric acid at 100°C separately, their products were extracted with ethyl acetate at a ratio of 1:1 (V/V) three times. The three ethyl acetate layers were combined and evaporated to dryness. The resulting substances were referred to as C-2, E-2 and EG-2 respectively.
Separation and analysis of effective components inhibiting FAS
High speed counter-current chromatography (HSCCC) was used to isolate the effective components inhibiting FAS. The separation was carried out with TBE-300A high-speed counter-current chromatograph (Tauto Biotechnique, Shanghai, China). The separation was performed according to the standard procedure at 25°C [Citation13]. The effluent fraction was monitored at 280 nm.
Matrix assisted laser desorption/ionization time-of-flight mass spectrometry (MALDI-TOF MS) was applied to explore the molecular weight of active components using a Bruker BIFLEX™ III instrument (Bruker Daltonics, Bremen, Germany) equipped with a 337 nm N2-laser and employed in the reflection mode. NaCl was added to the matrix.
The NMR spectra were recorded at 400 MHz on a Bruker AVANCE DPX400 (Bruker, Switzerland), equipped with a 5-mm inverse broadband probe, using DMSO-d6 as solvent. IR spectra, as KBr disks, were recorded on a Thermo Nicolet AVATAR 360 FT-IR spectrometer (Madison, USA) (4000 cm− 1 to 400 cm− 1).
HPLC analysis was carried out with a Dionex System (California, USA), comprising a Model 680 Pump, a Model UVD 170U Detector and a Rheodyne 7725i Manual Injector. The analysis was performed at room temperature on a 250 × 4.6 mm i.d. Diamansil C18-5 μm ODS column.
Results
Unexpected enhancement of inhibitory ability on FAS by heating (+)-catechin in sulfuric acid
We found that the inhibitory effect of (+)-catechin on FAS was markedly enhanced during the process of heating it in sulfuric acid. A time process was needed for the enhancement of inhibitory activity, and the required time was positively related to the temperature of treatment. The results showed that a chemical reaction had happened to produce a FAS inhibitor with high activity. shows the time course of the enhancement of the inhibitory activity of (+)-catechin in 1 M sulfuric acid at 100°C. It also shows that the inhibitory activity remains unchanged after 40-minute treatment, which implies that the reaction has completed. The IC50 for FAS inhibition of the final product was 1.3 μg/mL. Thus, the inhibitory activity increased over 350-fold.
Figure 1. The inhibition of FAS by (+)-catechin heated in sulfuric acid. (A): Time course of remaining FAS activity by inhibition of (+)-catechin treated with 1M sulfuric acid at 100°C. The concentration of (+)-catechin was 2.5 mg/mL. A 1.2-μl aliquot was taken to measure the remaining activity of FAS in a 2 mL assay mixture at the indicated times. (B): Time course of remaining FAS activity by inhibition of (+)-catechin treated with 1 M sulfuric acid at different temperatures. The concentration of (+)-catechin was 2.5 mg/mL. A 2-μl aliquot was taken to measure the remaining FAS activity in a 2 mL assay mixture at the indicated times. ▴: 100°C; ♦: 60°C; ★: 25°C. (C): Time course of remaining FAS activity by inhibition of (+)-catechin treated with different concentrations of sulfuric acid at 100°C. The concentration of (+)-catechin was 2.5 mg/mL. A 2-μl aliquot was taken to measure the remaining FAS activity in a 2 mL assay mixture at the indicated times. ▴: 1 M sulfuric acid; ♦: 0.5 M sulfuric acid; ★: 0.1 M sulfuric acid; •: water. The data was the mean of three experiments.

At 60°C, the required time for completing the reaction increased to 1 h, and the IC50 of the final product for inhibition of FAS was 1.0 μg/mL, which was close to that obtained at 100°C. The results indicated that the reactions at 100°C and 60°C might be similar while the velocities of the two reactions were different. At 25°C, the reaction progressed very slowly; almost no enhancement of the inhibitory activity was observed in the first few hours ().
Furthermore, the results shown in indicate that the higher concentrations of sulfuric acid would result in faster enhancements of the inhibitory activities of the treated (+)-catechin.
Enhancement of the inhibition of FAS by (+)-catechin heated in other acids
Similar to the result in sulfuric acid, it was observed that (+)-catechin heated in other acids also exhibited very potent activity in inhibiting FAS. The experiments were carried out in 1-M samples of various acids with different acidities. The results listed in show that the higher the acidity is, the more quickly the inhibitory activity increases. However, the inhibitory activity was similar for the final products in different acids, with the exception of acetic acid, the acidity of which was the weakest among these acids.
Table I. (+)-catechin treatment at 100°C with 1 M hydrochloric acid or organic acids.
Enhancement of inhibitory activity of EGC and EGCG in 1 M sulfuric acid
In addition to (+)-catechin, the inhibitory activity was also enhanced significantly for EGCG and EGC treated in 1 M sulfuric acid at 100°C. For EGC, heating for about 60 minutes resulted in the most potent inhibitory activity; the IC50 of the final product was 0.83 μg/mL. These results were close to those of (+)-catechin.
It took about 3 hours for EGCG to exhibit the most effective inhibition on FAS. The IC50 of the final product was 0.85 μg/mL. The required time for EGCG was much longer than that for EGC and (+)-catechin, and the inhibitory activity of EGCG did not change in the first 20 minutes during the treatment. The results revealed that the increase of the inhibitory activity of treated EGCG was delayed. However, the IC50 values of the final products from EGC and EGCG were nearly the same.
IC50 values of the ethyl acetate extracts from the heated catechins in acid
Each of the products was extracted with ethyl acetate after the treatment with 1 M sulfuric acid at 100°C. The extracts of products from (+)-catechin, EGC and EGCG were designated as C-2, E-2 and EG-2 respectively. All of them showed potent inhibition on FAS. The IC50 values of them inhibiting FAS are listed in . It is indicated that their inhibitory activities were much stronger than those of untreated catechins.
Table II. IC50 values of different inhibitors of FAS in overall reaction (OA) and ketoacyl reduction (KR).
Kinetics study of inhibition on FAS by EG-2
Furthermore, a study on the inhibition kinetics of EG-2 was carried out. First, the overall reaction activity was studied in the presence of increasing EG-2 concentration with acetyl-CoA as the variable substrate. The double-reciprocal plot () indicates that EG-2 is a competitive inhibitor to acetyl-CoA. The inhibition constant Ki obtained from the plot of the slope vs. EG-2 concentration was 0.16 μg/mL.
Figure 2. Double-reciprocal plots for inhibition of FAS by EG-2. (A): The overall reaction of FAS was measured. The concentrations of malonyl-CoA and NADPH were fixed at 9.25 μM and 33.4 μM, respectively. Acetyl-CoA was a variable substrate. The concentrations of EG-2 were 0 (♦); 0.16 μg/mL (▪); 0.33 μg/mL (•); 0.50 μg/mL (▴). (B): The β-ketoacyl reduction reaction was measured. The concentration of ethyl acetoacetate was fixed at 50 mM. NADPH was a variable substrate. The concentrations of EG-2 were 0 (♦); 0.50 μg/mL (▪); 1.00 μg/mL (•); 1.50 μg/mL (▴).
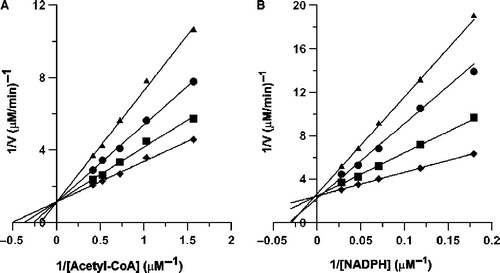
Then the β-ketoacyl reduction activity was measured in the presence of increasing EG-2 concentration with NADPH as the variable substrate. The double-reciprocal plot () indicates that EG-2 is also a competitive inhibitor to NADPH; and the inhibition constant Ki was 0.40 μg/mL. Compared to EGCG, the Ki values of EG-2 are much lower, which indicates that EG-2 is a much stronger inhibitor of FAS [Citation14].
Stability of EG-2
Then the stability of EG-2 stored at room temperature was tested. It was found that the IC50 value after 25 days storage was 0.74 μg/mL, which was similar to the initial IC50. Even after about 6 months of storage, the decrease of inhibitory activity was still limited and the IC50 reached 1.47 μg/mL. Therefore, for the inhibition on FAS, EG-2 is stable at room temperature.
Growth inhibition of EG-2 on MCF-7 cells
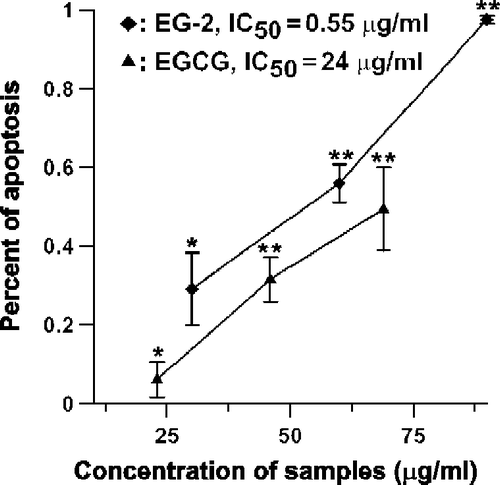
Since EG-2 was such a significant inhibitor of FAS, MTT assay was carried out to investigate whether EG-2 could influence the viability of cancer cells. Human breast cancer MCF-7 cells were employed in this study. It was observed that EG-2 inhibited the growth of MCF-7 cells obviously and the inhibition was in a dose-dependent manner (). Compared with EGCG, with similar doses, EG-2 inhibited the growth of MCF-7 cells more significantly, which is consistent with their inhibitory abilities on FAS.
Figure 3. Impact of EGCG and EG-2 on MCF-7 cell viability. After been seeded in the 96-well plate, the breast cancer cells, MCF-7, were incubated with different concentrations of EGCG or EG-2 for 24 h. The percentage of viable cells was determined by MTT assay. Data are represented as means ± SD (n = 3). *Significantly different (p < 0.05) from control cells (no EGCG or EG-2) by Tukey test. **Significantly different (p < 0.01) from control cells (no EGCG or EG-2) by Tukey test.
HSCCC isolation of active components from EG-2
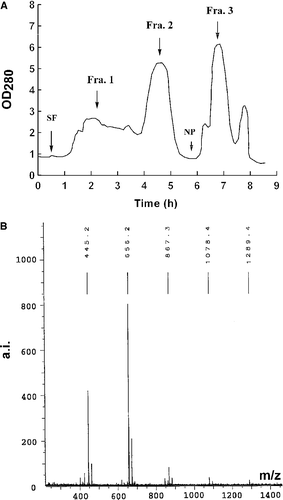
The next question was focused on what had happened during the treatment. HSCCC was applied in our study to isolate the effective components from EG-2. The separation used the two-phase solvent system ethyl acetate-butanol-H2O (4:0.6:5, V/V/V), which produced three main fractions (). NMR imaging confirmed that Fraction 2 was gallic acid. The percentages of the Fraction 1, 2 and 3 by mass were 24%, 26% and 33% respectively. The IC50 values of them were 0.76 μg/mL, 40 μg/mL and 0.72 μg/mL respectively. Covering about 99% inhibitory activity, Fractions 1 and 3 were the effective components to inhibit FAS. Then they were subsequently subjected to further fractionation by HSCCC, and four active fractions were isolated. Their IC50 values ranged from 0.45 μg/mL to 1.86 μg/mL and they were subsequently used for structural analysis.
Figure 4. HSCCC chromatogram of EG-2 and MALDI-TOF mass spectrum of one of active fractions in EG-2. (A): Separation of active components from EG-2. Conditions: Two-solvent system: ethyl acetate-butanol-H2O (4:0.6:5, v/v/v); 0–6 h, in reverse-phase partition mode (mobile phase: aqueous lower phase); 6–9 h, in normal-phase partition mode (mobile phase: organic upper phase); flow rate: 2 mL/min; revolution speed: 850 rpm; sample concentration: 600 mg/30 mL. (B): The MALDI-TOF mass spectrum of an active fraction that was separated from Fraction 3 in EG-2.
It was found that about 0.7 mole gallic acid could be obtained if 1 mole EGCG were treated. This result showed that most of EGCG had initially turned into EGC.
Analysis of active fractions
MALDI-TOF MS was used to explore the molecular weight distribution in those active fractions from EG-2. Na+ was added to improve the ionization, so each labeled mass represented the molecular ions of [M + Na+]. All of the MALDI-TOF mass spectra of active fractions in EG-2 exhibited similar characteristics. One of the spectra is displayed in . Regular repetitions of signals starting at m/z of 445 and separated by 211 Da are observed. It is suggested that oligomers, with a building unit of 211 Da, are produced during the treatment and those oligomers are the actual components potently inhibiting FAS. The mass range in all of the fractions measured was from 445 Da to 1289 Da. Thus, the polymerization degree of oligomers was from two to six monomers.
By using the signal height in spectra as the measure of relative abundance, the distributions of oligomers were evaluated. The results indicated that the most abundant oligomer was trimer for almost every fraction. Besides, there was a positive correlation between the trimer content and the inhibitory activity of fractions. Trimer seemed to be the most potent inhibitor of FAS among the oligomers.
NMR and IR spectrometry were used to unveil the typical characteristics of the fractions. The data of characterization of Fraction 2 was as follows: 1H-NMR (400 MHz, DMSO-d6) δ: 5.64 (2H, s, H-2, 6), 9.49 (1H, s, –COOH). 13C-NMR (400 MHz, DMSO-d6) δ: 168.1 (–COOH), 121.1 (C-1), 109.2 (C-2, 6), 145.9 (C-3, 5), 138.4 (C-4). These data show that Fraction 2 is gallic acid. The characterization of a fraction separated from C-2 was as follows: 1H-NMR (400 MHz, DMSO-d6) δ: 5.66 (3H, s, H-2, 4, 6), 8.97 (3H, s, –OH). 13C-NMR (400 MHz, DMSO-d6) δ: 159.3 (C-1, 3, 5), 94.5 (C-2, 4, 6). This compound was identified as phloroglucinol by comparing its spectra data with the NMR spectra of phloroglucinol in Spectral Database for Organic Compounds [Citation15]. The 13C NMR spectra of those active fractions showed evidence of carboxyl by a chemical shift at δ 165.7. The wave numbers of 3419 cm− 1 and 1625 cm− 1 in their IR spectra also indicated the existence of carboxyl. 13C NMR data of the chemical shifts at δ 165.7, 146.4, 145.9, 109.1 and 105.9 were also displayed in the spectra of those active fractions.
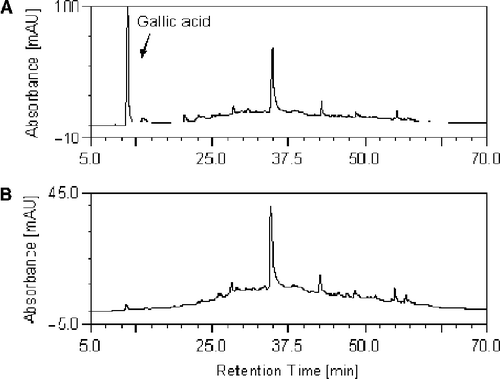
E-2 and EG-2 were analysed by HPLC (). The graph shows that most of their peaks match with each other. The peak at 10 min was identified as gallic acid by direct comparison with an authentic sample. This implies that there is gallic acid in EG-2 while almost no gallic acid exists in E-2.
Figure 5. The HPLC chromatogram of E-2 and EG-2. The chromatogram of EG-2 and E-2 are shown in (A) and (B) respectively. The binary mobile phases consisted of 0.1% H3PO4 in water (Solvent A) and 0.1% H3PO4 in methanol (Solvent B). The system was run with a total gradient program, 5% Solvent B to 100% Solvent B in 60 minutes. The flow rate was 1 mL/min, detected at 254 nm.
Discussion
Novel and potent inhibitors of FAS were produced in the reaction
In this study, a remarkable increase of the inhibitory activities on FAS of catechins was observed during the process of heating them in acid. The IC50 values of the products were much lower than that of cerulenin (20 μg/mL) and EGCG (24 μg/mL), two typical FAS inhibitors [Citation9,Citation16]. Even though the inhibitory activities on FAS of gallated and ungallated catechins differ a lot, it was shown that the inhibitory activities of C-2, E-2 and EG-2, which were derived from (+)-catechin, EGC and EGCG respectively, were similar.
It is found that the treated products from catechins inhibit FAS in a different way from the known inhibitors of FAS. The product EG-2 suppressed FAS activity through competitively inhibiting the binding of acetyl-CoA while EGCG inhibited FAS in a mixed manner of non-competitive and competitive inhibition to acetyl-CoA [Citation14]. The ratio of IC50 for the overall reaction to the β-ketoacyl reduction of FAS by EG-2 was 0.15 (), while that by EGCG was 0.52, which indicates that the β-ketoacyl reductase domain is the main reaction site for EGCG but not for EG-2. It is suggested that the main reaction site for EG-2 should be the acyl transferase domain, which is the acetyl-CoA binding site on FAS. Other two major FAS inhibitors, C75 and cerulenin, mainly react with the ketoacyl synthase domain on FAS [Citation16,Citation17]. Thus, EG-2 is a novel inhibitor of FAS different from the main known ones.
Hydrogen ions facilitate the reaction
As is demonstrated above, the speed and degree of the enhancement of FAS inhibition ability of catechins by treatment in acid were positively related to the concentration of acid and the acidity of acid. It seems that the enhancement was independent of the acid type. The results indicate that the hydrogen ion concentration is an essential factor for the reaction. Thus, the enhancement might stem from certain chemical modification of catechins by hydrogen ions.
Influence of MCF-7 cell viability by EG-2 via inhibition to FAS?
EG-2 exhibited significant inhibition on the growth of MCF-7 cells. The dose-response curve reflects the parallelism between inhibition of FAS activity and cancer cell proliferation (). Thus, the inhibition of MCF-7 cells by EG-2 may be related to its ability of inhibiting FAS activity. FAS has been reported to be a potential target for cancer [Citation7]. Since EG-2 shows potent inhibition on the growth of MCF-7 cells as well as inhibition of FAS, it could be developed into a candidate for anticancer drugs.
Analysis of route of the reaction progress and the structure of products
Together with the results of HSCCC, HPLC, MALDI-TOF mass spectra, IR spectra and a variety of NMR experiments, we carried out the following analysis.
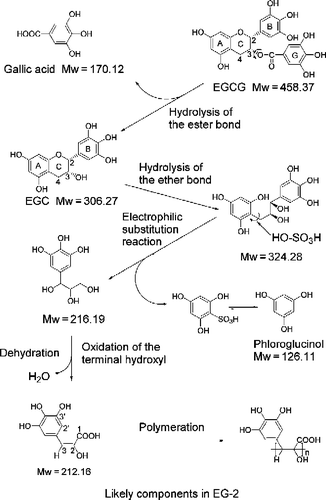
The production of high amount of gallic acid () implies that the ester bond between C3 and the galloyl moiety of EGCG was hydrolyzed in the process of heating EGCG in acid. The similarity of the HPLC graphs of E-2 and EG-2, except for a gallic acid peak on the EG-2 graph (), also confirms the release of gallic acid. Thus, the time course of inhibitory ability enhancement of EGCG during treatment lagged behind that of EGC. Therefore, after the release of gallic acid, the next reactions are similar for both gallated and ungallated catechins.
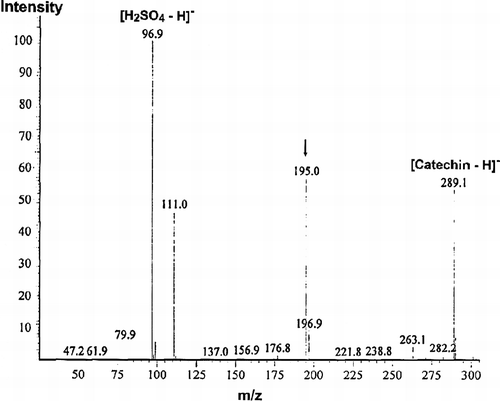
The MALDI-TOF mass spectra show that the main products are oligomers, with a building unit of 211 Da (). The EGC, with molecular weight of 306 Da, must release another part before polymerization. The NMR results showed that phloroglucinol was produced in the treatment. According to the structures of catechins, the phloroglucinol could only come from Ring A. This opinion is then consistent with the result of negative-ion ESI mass spectrum of C-2. (+)-Catechin has one less hydroxyl on Ring B than EGC. Thus, if the Ring B was released to produce phloroglucinol, there would be no difference in molecular weight between the products from EGC and (+)-catechin. However, according to the negative-ion ESI mass spectrum of C-2, a main molecular ionic peak of 195 rather than 211 appears (). Therefore, Ring A, not Ring B, was released during the treatment. This process should include two steps. Firstly, the C2-O bond of Ring C was hydrolyzed by the action of H+. Then the bond linking C4 and Ring A was hydrolyzed.
The remaining part contained Ring B and three adjacent alcohol hydroxyls. The primary hydroxyl was oxidized into carboxyl. Two adjacent hydroxyls of secondary alcohol were dehydrated to form alkene double bond. This product with molecular weight of 212 Da is the proposed building unit of oligomers. The important evidence to support this proposal is that both the IR and 13C NMR spectra showed the existence of carboxyl groups in the product. The existence of C-1, C-2, C-3′, C-5′, C-2′, C-6′ and C-3 of the building unit was corroborated by the 13C NMR data of fractions. Then the polymerization took place to produce oligomers. The proposed possible reaction process is shown in .
As is known, the basic monomer of condensed tannins is flavan-3-ol, such as (+)-catechin and ( − )-epicatechin. The condensation between (+)-catechin and ( − )-epicatechin occurs widely in plants [Citation18]. In vitro, Bishop et al. synthesized dimeric condensed tannin by directly adding a glycosided anthocyanin and catechin to aqueous 10 mM HCl in air-free conditions [Citation19]. However, in this study, condensation between flavan-3-ols in acidic conditions was not observed. If (+)-catechin or EGC served as the monomer, compounds with building unit of 288 or 304 Da should be detected.
The theaflavins in black tea are the products of oxidative coupling of catechins. They are effective inhibitors of FAS, with an IC50 value of 1.27 μg/mL [Citation14]. In this study, no theaflavins were observed in the product derived from catechins through HPLC analysis. It is interesting that all these “coupling” catechins inhibit FAS much more potently than catechins themselves do.
Conclusion
In this study, novel and potent inhibitors of FAS, with IC50 values less than 1 μg/mL, were obtained from treating catechins at higher temperature in acid. Moreover, the products were capable of inhibiting the growth of human breast cancer cells significantly. Through analysing the inhibition kinetics of these inhibitors, it was observed that they were more potent than the known FAS inhibitors and were different from the known ones. Through a series of structural analysis, these inhibitors were proposed to be oligomers with 2-hydroxy-3-(3′, 4′, 5′-trihydroxyphenyl) propenoic acid as building unit.
Acknowledgements
This work was supported by Grants 30572252 and 30670455 of the National Natural Science Foundation of China. We appreciate the help of Dr. Yang Jing-Kui (Chemistry College of GUCAS, Beijing, China) on the analysis of the chemical reaction and molecular structure.
Declaration of interest: The authors report no conflicts of interest. The authors alone are responsible for the content and writing of the paper.
References
- SJ Wakil. Fatty acid synthase, a proficient multifunctional enzyme. Biochemistry 1989;28:4523.
- S Smith. The animal fatty acid synthase: One gene, one polypeptide, seven enzymes. Faseb J 1994;8:1248.
- PL Alo, P Visca, G Trombetta, A Mangoni, L Lenti, S Monaco, C Botti, DE Serpieri, U Di Tondo. Fatty acid synthase (FAS) predictive strength in poorly differentiated early breast carcinomas. Tumori 1999;85:35.
- MS Shurbaji, JH Kalbfleisch, TS Thurmond. Immunohistochemical detection of a fatty acid synthase (OA-519) as a predictor of progression of prostate cancer. Hum Pathol 1996;27:917.
- TS Gansler, W Hardman3rd, DA Hunt, S Schaffel, RA Hennigar. Increased expression of fatty acid synthase (OA-519) in ovarian neoplasms predicts shorter survival. Hum Pathol 1997;28:686.
- P Visca, V Sebastiani, C Botti, MG Diodoro, RP Lasagni, F Romagnoli, A Brenna, BC De Joannon, RP Donnorso, G Lombardi, PL Alo. Fatty acid synthase (FAS) is a marker of increased risk of recurrence in lung carcinoma. Anticancer Res 2004;24:4169.
- FP Kuhajda. Fatty-acid synthase and human cancer: New perspectives on its role in tumor biology. Nutrition 2000;16:202.
- X Wang, KS Song, QX Guo, WX Tian. The galloyl moiety of green tea catechins is the critical structural feature to inhibit fatty-acid synthase. Biochem Pharmacol 2003;66:2039.
- X Wang, WX Tian. Green tea epigallocatechin gallate: A natural inhibitor of fatty-acid synthase. Biochem Biophys Res Commun 2001;288:1200.
- CW Yeh, WJ Chen, CT Chiang, SY Lin-Shiau, JK Lin. Suppression of fatty acid synthase in MCF-7 breast cancer cells by tea and tea polyphenols: A possible mechanism for their hypolipidemic effects. Pharmacogenomics J 2003;3:267.
- WX Tian, RY Hsu, YS Wang. Studies on the reactivity of the essential sulfhydryl groups as a conformational probe for the fatty acid synthetase of chicken liver. Inactivation by 5,5′-dithiobis-(2-nitrobenzoic acid) and intersubunit cross-linking of the inactivated enzyme. J Biol Chem 1985;260:11375.
- JM Soulie, GJ Sheplock, WX Tian, RY Hsu. Transient kinetic studies of fatty acid synthetase. A kinetic self-editing mechanism for the loading of acetyl and malonyl residues and the role of coenzyme A. J Biol Chem 1984;259:134.
- Y Ito. Golden rules and pitfalls in selecting optimum conditions for high-speed counter-current chromatography. J Chromatogr A 2005;1065:145.
- YT Du, X Wang, XD Wu, WX Tian. Keemun black tea extract contains potent fatty acid synthase inhibitors and reduces food intake and body weight of rats via oral administration. J Enz Inhib Med Chem 2005;20:349.
- Spectral Database for Organic Compounds [Internet]. A free site organized by National Institute of Advanced Industrial Science and Technology (AIST), Japan. 1982-[cited 2008 Apr 11]. Available from: http://riodb01.ibase.aist.go.jp/sdbs/cgi-bin/cre_index.cgi?lang = eng.
- D Vance, I Goldberg, O Mitsuhashi, K Bloch. Inhibition of fatty acid synthetases by the antibiotic cerulenin. Biochem Biophys Res Commun 1972;48:649.
- FP Kuhajda, ES Pizer, JN Li, NS Mani, GL Frehywot, CA Townsend. Synthesis and antitumor activity of an inhibitor of fatty acid synthase. Proc Natl Acad Sci USA 2000;97:3450.
- DY Xie, RA Dixon. Proanthocyanidin biosynthesis—still more questions than answers?. Phytochemistry 2005;66:2127.
- PD Bishop, CW Nagel. Characterization of the condensation product of malvidin 3,5-diglucoside and catechin. J Agric Food Chem 1984;32:1022.

