
Abstract
The PID1/NYGGF4/PCLI1 gene encodes for a protein with a phosphotyrosine-binding domain, which interacts with the lipoprotein receptor-related protein 1. Previous work by us and others suggested a function of the gene in cell proliferation of NIH3T3 fibroblasts and 3T3-L1 pre-adipocytes. The molecular characterization of PCLI1 protein, ectopically expressed in NIH3T3 fibroblasts, revealed two phosphorylation sites at Ser154 and Ser165. In order to clarify the functions of this gene, we analyzed the effects of its downregulation on cellular proliferation and cell cycle progression in NIH3T3 cell cultures. Downregulation of PID1/NYGGF4/PCLI1 mRNA levels by short hairpin RNAs (shRNAs) elicited decreased proliferation rate in mammalian cell lines; cell cycle analysis of serum-starved, synchronized NIH3T3 fibroblasts showed an increased accumulation of shRNA-interfered cells in the G1 phase. Decreased levels of FOS and MYC mRNAs were accordingly associated with these events. The molecular scenario emerging from our data suggests that PID1/NYGGF4/PCLI1 controls cellular proliferation and cell cycle progression in NIH3T3 cells.
Keywords:
Introduction
The phosphotyrosine interaction domain containing 1 gene PID1/NYGGF4/PCLI1 (PCLI1) was originally annotated in bioinformatic database as an EST coding for a protein with a phosphotyrosine binding (PTB) domain in vertebrates. The first experimental characterization of this EST was derived by a subtractive screening for genes differentially expressed in subcutaneous abdominal adipose tissue from obese individuals; in this effort, the PCLI1 cDNA was indeed found to be overexpressed in the obese set of samplesCitation1. Soon after, we reported the identification of PCLI1 in a functional screening, having described the dominant ability of its ectopically expressed PTB domain to interfere with cell cycle progression in NIH3T3 fibroblastsCitation2. The structural organization of the protein encoded by PCLI1 is very simple; indeed, its PTB domain largely covers the whole protein sequence at the C-terminal end. A search for ligands of the protein PTB domain identified a trimeric complex with cubilin and with the LDL receptor-related protein 1 (LRP1). This occurrence led us to assign the PCLI1 (PTB-containing, Cubilin, and LRP1 Interacting protein 1) acronym to the encoded proteinCitation2. Extensive screening efforts also validated the interaction of PCLI1 with the cytosolic domain of LRP1, highlighting also the reduced expression of the gene in early Alzheimer’s diseaseCitation3. A series of studies, mainly based on the stable overexpression of PCLI1, led to the characterization of the function of the gene in signal transduction and insulin resistanceCitation4–6. Indeed, ectopic expression of its cDNA in 3T3-L1 pre-adipocytes or in skeletal myotubes reduced insulin-stimulated Tyr phosphorylation of IRS-1 and Ser phosphorylation of AKT, resulting in the inhibition of insulin-stimulated glucose uptake through attenuation of the PI3K signaling pathway. Conversely, silencing of PCLI1 was associated with an enhanced glucose uptake in adipocytes via a PI3K-dependent mechanismCitation7. Recent evidences have also highlighted the involvement of PID1/NYGGF4/PCLI1 in the regulation of signal transduction mechanisms in mouse myocyte models, upon insulin stimulation. Namely, PCLI1 knockdown activated the IRS-1/PI3K/AKT insulin pathway in C2C12 mice skeletal myocytesCitation8. Furthermore, PCLI1 overexpression in L6 skeletal myotubes decreased insulin-stimulated Tyr phosphorylation of IRS1 and Ser phosphorylation of AKT, without affecting the phosphorylation of IR, ERK1/2, p38, or JNKCitation5. The mRNA levels of PCLI1 increase during differentiation of 3T3-L1 adipocytes, or upon treatment with free fatty acidsCitation9. Mitochondrial impairment was documented both in cellular clones overexpressing PCLI1 cDNACitation10 as well as in siRNA-interfered cellsCitation7; these controversial findings highlighted a potential dominant-negative effect of PCLI1 protein overexpression on mitochondrial activity, mimicking the effects of RNA interference-mediated downregulation.
PCLI1 gene function may be related to various aspects of cellular physiology in mammalian cells, including signal transduction, cellular proliferation, metabolism, and insulin resistanceCitation11,Citation12. The main molecular feature of the PCLI1 protein indeed seems to reside in its interaction with LRP1, a membrane receptor of the LDLR family. LRP1 is a multifunctional membrane receptor, widely expressed in several mammalian tissues (see Ref.Citation13 for a review). Such large protein consists of an 85-kDa membrane-anchored C-terminal polypeptide (β chain) and a 515-kDa (α chain) N-terminal fragment. Through its extracellular domain, LRP1 interacts with different ligands, including lipoproteins, extracellular matrix proteins, protease inhibitor complexes, and growth factors. It also acts as a co-receptor for other cell surface or integral membrane proteins; its intracellular domain binds scaffolding and signaling proteins. LRP1 interaction with PCLI1 involves its cytosolic domain; the latter may interact, other than PCLI1Citation2, with additional PTB domain-containing molecular adaptors, including ShcA, Fe65, and Dab1Citation14. The intricate network of protein interactions involving LRP1 supports its involvement in several cellular functions, including lipid metabolism, cell growth/differentiation processes, degradation of proteases, tissue invasion, endocytosis, and regulation of signal transduction pathways. Indeed, LRP1 associates with the PDGF receptor in endosomal compartments and modulates its signaling properties by affecting the MAPK and AKT/phosphatidylinositol 3-kinase pathwaysCitation15. Furthermore, PDGF mediates the Tyr phosphorylation of LRP1 at its cytoplasmic domain and modulates its phosphotyrosine-dependent interaction with other molecular adaptors, such as ShcCitation16.
More recently, PCLI1 was reported as a potential tumor suppressor gene in brain tumors, since its mRNA levels were found to be lower in aggressive medulloblastomas and glioblastomas, compared to their more favorable counterparts. Overexpression of PCLI1 in cultured brain tumor cell lines correlated with increased depolarization of mitochondrial membrane potential, reduced proliferation, increased cell death, and inhibition of serum-mediated phosphorylation of AKT and ERKCitation17.
Based on these experimental evidences, which associate PCLI1 to cell signaling, we further investigated the role of PCLI1 in controlling cell growth. Here we report that PCLI1 protein is phosphorylated in NIH3T3 cells, and describe the effects of its downregulation by short hairpin RNA (shRNA)-mediated silencing on cellular proliferation and cell cycle progression of NIH3T3 cells. We provide evidence for a supportive function of PCLI1 gene in these events.
Methods
Cell cultures, transfections, and serum starvation
Mouse NIH3T3 embryo fibroblasts and Neuro2A neuroblastoma cells were grown in 90% DMEM medium (Invitrogen, Carlsbad, CA) supplemented with 10% fetal bovine serum (Hyclone, Logan, UT) and 1% of penicillin/streptomycin (HyClone), using standard procedures. Medium for Neuro2A cells also contained nonessential amino acids (Sigma, Milan, Italy).
Transfection of flag-tagged PCLI1 (Q7Z2X4-3) and of shRNA constructs in NIH3T3 and Neuro2A cells was performed using Lipofectamine 2000 (Invitrogen), according to manufacturer’s instructions. Cells were plated in 100 mm dishes and transfected after 24 h with 10 g of each of the different constructs. Pools of stable clones were obtained for shRNA constructs targeting PCLI1, and with a nonsilencing construct (for NIH3T3 cells). Neuro 2A cells were transfected with the nonsilencing and with the 5A construct. Selection was started 48 h after transfection using puromycin (Sigma) at 3 g/ml and 6 g/ml for NIH3T3 and Neuro2A, respectively. The pools of clones obtained after 10 days of selection were maintained under a lower concentration of antibiotic (0.5 g/ml). Serum starvation of NIH3T3 cells and stable pools of clones was performed in DMEM medium supplemented with 0.5% fetal bovine serum for 24 h. After synchronization, cells were allowed to start cell cycle by supplementation with medium containing 20% fetal bovine serum for different time-points.
Mass spectrometric characterization of PCLI1
To investigate the phosphorylation status of PCL1, flag-tagged PCLI1 protein was obtained by transfection of NIH3T3 cells and purification of the recombinant protein on flag immunoaffinity resin (Sigma). The bound proteins were eluted in SDS–PAGE sample buffer, resolved by 12% SDS–PAGE and stained with ammoniacal silver stainingCitation18. PCLI1 band was excised, in-gel S-alkylated, digested with trypsin, and extracted as previously reportedCitation19. Digest was solved in 80% v/v acetonitrile, 0.1% v/v trifluoroacetic acid containing 2,5-dihydroxy-benzoic acid (20 mg/ml), loaded on a GELoader tip (Eppendorf) packed with TitanSphere TiO2 resin 5 μm (GL Science Inc.), which was washed and eluted as previously reportedCitation19. Enriched digest was directly analyzed by MALDI-TOF MS and nanoLC-ESI-LIT-MS/MS.
For MALDI-TOF/MS analysis, peptides were loaded on the MALDI target together with 2,5-dihydroxy-benzoic acid (30 mg/ml in 50% v/v acetonitrile, 1% v/v orthophosphoric acid) as matrix, by using the dried droplet technique; they were analyzed with a Voyager-DE PRO spectrometer (Applied Biosystems, Foster City, CA). Mass spectra were acquired in positive polarity by using the instrument in linear mode. Internal mass calibration was performed with peptides from trypsin autoproteolysis. Data were elaborated using DataExplorer 5.1 software (Applied Biosystems).
NanoLC-ESI-LIT-MS/MS analysis was performed using a LTQ XL mass spectrometer (Thermo Finnigan, San Jose, CA) equipped with Proxeon nanospray source connected to an Easy-nanoLC (Proxeon, Denmark). Peptide mixtures were separated on an Easy C18 column (10 × 0.075 mm, 3 μm) (Thermo Finnigan) using a linear gradient from 5% to 40% of acetonitrile in 0.1% formic acid, over 60 min, at a flow rate of 300 nL/min. Spectra were acquired the range m/z 400–2000. Acquisition was controlled by a data-dependent product ion scanning procedure over the three most abundant ions, enabling dynamic exclusion; repeat count and exclusion duration values were 1 and 1 min, respectively. The mass isolation window and collision energy values were set to m/z 3 and 35%, respectively.
To identify phosphopeptides, MS data were elaborated by using the MASCOT software (Matrix Science, UK) running within the Proteome Discoverer package (Thermo Finnigan), which compared tryptic peptide product ion mass spectra against those generated from a custom-designed database sequence including PCLI1 and other contaminants. MASCOT parameters included selection of trypsin with up to two missed cleavage sites, static and dynamic mass modification associated to Cys carbamidomethylation, Met oxidation, and Ser/Thr/Tyr phosphorylation, respectively.
PCLI1 interference by short-hairpin RNAs
Target sequences for the interference of the PCLI1 gene were selected via RNAi Central http://katahdin.cshl.org:9331/RNAi_web/scripts/main2.pl), a bioinformatic tool to retrieve shRNA from a query mRNA sequence. We selected the following three sequences for targeting: 3A: 5′-CGGCAGTTAATTCGCAGTTAAA-3′; 4C: 5′-CCCAGACCATGCTGAAGTCTAA-3′; 5A: 5′-CGCGCGCTAGATGGCAGTTAAT-3′. The chemically synthesized oligonucleotides encoding the shRNA sequences were used as templates for PCR reactions performed with KOD HiFi DNA Polymerase (Novagen) to insert the appropriate restriction sites for cloning. The double-stranded sequences were cloned into the pSM2 vector, in which the expression of the small hairpin RNA is driven by the U6 promoter. The pSM2 vector contains chloramfenicol and kanamycin resistance genes for selection in bacteria, and a puromycin resistance gene to select mammalian cell lines stably expressing the shRNAs. The constructs were expressed in the bacterial strain PIR1 (Invitrogen) and selected by chloramfenicol (25 μg/ml) and kanamycin (25 μg/ml). The constructs were verified by digestion with XhoI/EcoRI and HindIII/XbaI and sequencing (DNA sequencing service, CEINGE, Biotecnologie avanzate, Napoli).
Analysis of cell proliferation and fluorescence-assisted cell sorting (FACS)
Proliferation activity of NIH 3T3 and Neuro2A cell clones was evaluated with the Alamar blue assay. The compound becomes fluorescent when reduced, without affecting cell viability, so the metabolic rate of cells can be proportionally evaluated by measuring fluorescence intensity. Cells were seeded on to 96-well plates at a density of 1000 cells/well in triplicate. After 24 h, Alamar Blue (Biosource International) was added directly into culture media at a final concentration of 10% and the plate was returned to the incubator. Since the absorption spectra of the oxidized (blue) and the reduced (pink) forms of Alamar blue overlap, the absorbance was measured at 2 wavelengths (570 and 600 nm for the reduced and oxidized form, respectively). Wells containing medium and Alamar blue without cells were used as blanks. A subtraction analysis (OD570 − OD600) of the dual wavelength readings was conducted, and the blank value was deducted from all wells. Measurements were carried out with a standard reader at different time-points.
For FACS analysis, NIH3T3 and stable clones were collected during exponential growth and, after serum starvation, at different time points after the treatment with medium containing 20% FBS. Samples were processed according to the following protocol: cells were washed twice in PBS, trypsinized, resuspended in 1 ml of PBS, and fixed with 3 ml of 96% ethanol for storage at −20 °C. Ethanol was removed by centrifugation, and the cell pellets were treated with a mixture containing 20 g/ml propidium iodide, 25 μl of 0.15% NP-40, and 25 μl of RNase A (1 mg/ml in PBS), for 3 h, in the dark. Cells were counted with a FACScanto (BD Biosciences) instrument.
Protein extraction, antibodies, and Western blotting
Cells were lysed on ice in a buffer containing 50 mM Tris-HCl pH 7.5, 150 mM NaCl, 0.4 mM EDTA, 10% glycerol, 0.1% SDS, 1% Triton X-100, 1 mM sodium ortho-vanadate, 50 mM NaF, 1 mM DTT, and a cocktail of protease inhibitors. The lysates were centrifuged 10 min at 16 000 × g, quantified by the Bradford assay and run on SDS-PAGE. Resolved proteins were transferred to PVDF membrane (Millipore, Billerica, MA) using the Trans-Blot Semi-dry System (Bio-Rad Laboratories, Hercules, CA), and the membranes were probed with the following antibodies: anti-Flag peptide M2, mouse monoclonal (Sigma); anti LRP1-antibody, rabbit polyclonal. The latter was raised in rabbits by injecting the GST-LRP1_cyt protein as an antigen, (amino acid residues 4445–4544, accession Q07954), according to standard protocols. Proteins were detected with the chemiluminescence system LiteAblot (Euroclone) by using HRP-conjugated Protein A (GE Healthcare).
The ectopically expressed flag-tagged PCLI1 isoform in NIH3T3 cells, Q7Z2X4-3 (PCLI1_3), was purified by immunoaffinity on anti-flag resin (Sigma-Aldrich, Milan, Italy) according to manufacturer’s instructions.
Real-time PCR
Total RNAs were extracted using Trizol ultra pure reagent (Invitrogen), according to the manufacturer’s instructions, and subsequently incubated with RNase-free DNase (Ambion). Reverse transcription was performed with Vilo SuperScript® VILO™ with pdN6 primers, according to the manufacturer’s instructions. Quantitative real-time PCR was performed on a 7500 Real-Time PCR System (Applied Biosystems) using 10 μl of EXPRESS SYBR® GreenER™ qPCR SuperMix with Premixed ROX (Invitrogen), 10 μM each of forward and reverse primers and 10 μl of diluted cDNA (1:200). The oligonucleotide primers were designed by the Primer Express software (Applied Biosystems); their sequences were the following:
m_fos_FOR, 5′-CAAGCGGAGACAGATCAACTTG-3′; m_fos_REV, 5′-TTTCCTTCTCTTTCAGCAGATTGG-3′; m_PCLI1_FOR, 5′-TCATAGTGGCTGCAAGGTTACC-3′; m_PCLI1_REV, 5′-TCAATGACTGGCTTCTCGGTG-3′; m_βActin_FOR, 5′-CTGGCTCCTAGCACCATGAAG-3′; m_βActin_REV, 5′-CAGGATGGAGCCACCGATC-3′.
For calculation of relative mRNA expression, β-actin transcripts were used as the reference mRNA; data analysis was carried out according to the ΔΔCt method. The cDNA was then amplified for 40 cycles using SYBR Green PCR master mix (Applied Biosystems) and template-specific primers for the target genes in an ABI Prism 7500 system (Applied Biosystems). Relative quantification of gene expression was performed by using the comparative threshold (CT) method. Changes in mRNA expression levels were calculated following normalization to β-actin.
Results and discussion
Proteomic characterization of PCLI1
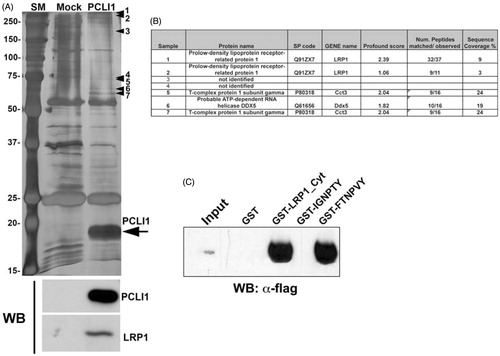
In order to obtain adequate amounts of PCLI1 protein for its characterization, we expressed ectopically a full-length, flag-tagged PCLI1 isoform in NIH3T3 cells, namely Q7Z2X4-3 (PCLI1_3). The arrow in shows the overexpressed, immunopurified protein, compared to nonspecifically bound material from mock-transfected cells. Additional protein bands in the PCLI1 lane (arrowheads 1–7 in ) were interpreted as potential interactors of the protein (listed in the panel B of ). However, they were not confirmed by co-immunoprecipitation followed by Western blot analysis (data not shown), with the exception of LRP1 (lower panel in ). These results did indeed confirm the interaction of PCLI1 with LRP1 in NIH3T3 cellsCitation2. Additional co-precipitation experiments with GST-fused proteins encompassing the whole cytoplasmic domain of LRP1 or its regions containing the isolated, putative NPXY motifs required for interactions with PTB domains demonstrated that PCLI1 binds to the whole cytoplasmic tail of LRP1, as well as to its C-terminal region, containing the FTNPVY sequence ().
Figure 1. Characterization of the overexpressed PCLI1 protein. (A) The silver-stained gel shows the purified material from mock-transfected and PCLI1_3-transfected NIH3T3 cells. The arrow indicates the overexpressed protein; additional protein bands in the PCLI1 lane (arrowheads 1–7) represent potential interactors of the protein. These proteins were excised from the gel for identification of the potential PCLI1 protein ligands, together with the corresponding areas from the adjacent lane to be subtracted from interactor list. At the bottom, Western blot analysis was carried out to validate the presence of PCLI1 and its ligand, LRP1, in the immunopurified material. (B) The Panel shows the identification data, obtained by MALDI-TOF peptide mass fingerprint analysis of the bands marked by arrowheads in the Panel A. (C) Co-precipitation experiments with GST fusion proteins encompassing the whole cytoplasmic domain of LRP1 (GST-LRP1_Cyt), or with the regions containing both NPXY motifs showed that PCLI1 binds to the whole cytodomain and to the C-terminal NPXY motif in LRP1 (FTNPVY), but not to the N-terminal IGNPTY motif.
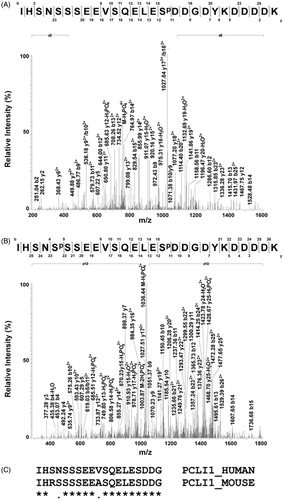
For proteomic characterization of PCLI1, the excised band from SDS-PAGE (indicated by the arrow in ) was indeed digested with trypsin and subjected to MALDI-TOF MS analysis, providing signals that were associated with 87% of the whole protein sequence. Since phosphopeptide peaks might be suppressed by abundant nonphosphorylated components during MS experiments, whole PCL1 digest was enriched for phosphopeptides by using a TiO2 resin; eluted species were then subjected to either MALDI-TOF MS or nanoLC-ESI-LIT-MS/MS analysis. shows the MALDI-TOF mass spectrum of the peptide mixture directly eluted from the TiO2 resin. An intense MH+ signal at m/z 3124.50 and a low MH+ signal at m/z 3204.37 were evident in the recorded trace, which were tentatively assigned to the mono- and di-phosphorylated forms of the peptide 150–176 (numbering based on accession Q7Z2X4-3), on the basis of the measured mass value, PCLI1 sequence, protease selectivity, and the occurrence of amino acids susceptible to phosphorylation. They presented a mass difference of +80 and +160 Da, respectively, with respect to nonphosphorylated species, which also appeared in the spectrum with a MH+ signal at m/z 3044.67. Signal assignment to phosphorylated species was confirmed by MALDI-TOF MS analysis of the mixture following alkaline phosphatase treatment, which uniquely showed the presence of the nonmodified peptide 150–176 (). Eluted phosphopeptides were also subjected to nanoLC-ESI-LIT-MS/MS analysis to confirm their identities and definitively assign their site(s) of modification. shows the tandem mass spectrum recorded for the precursor [M + 4H]4+ ion at m/z 781.97, which was associated with the mono-phosphorylated peptide 150–176. Its fragmentation pattern was indicative of the presence of a phosphate group at Ser165. Similarly, the tandem mass spectrum recorded for the [M + 3H]3+ ion at m/z 1068.91, which was assigned to the di-phosphorylated peptide 150–176, proved the concomitant occurrence of a phosphate group at Ser154 and Ser165 (). As expected, a clear tandem mass spectrum was also recorded for the non-phosphorylated peptide counterpart (data not shown). A sequence alignment of the human and mouse PCL1 protein homologs, focused on the region 150–168 (where phosphorylation was ascertained), revealed a general amino acid conservation (). Differences were limited to three amino acids, among which two occurred in sites susceptible to eventual post-translational modification (Ser152 > Arg and Asn153 > Ser). These findings should tentatively explain the subtle variations in the phosphorylation pattern observed in the region 152–156 and the conservation of the modification site at Ser165, as determined for human (this study), mouseCitation20,Citation21, and rat proteinCitation22.
Figure 2. MALDI-TOF MS analysis of phosphorylated PCLI1 peptides. Cropped portion of the spectrum recorded for the enriched phosphopeptide mixture from the PCLI1 digest before (A) and following alkaline phosphatase treatment (B). Signals corresponding to peptide 150–176 in its doubly, singly, and non-phosphorylated forms are indicated (theor. MH+ values at m/z 3044.98, 3124.96 and 3204.94, respectively).
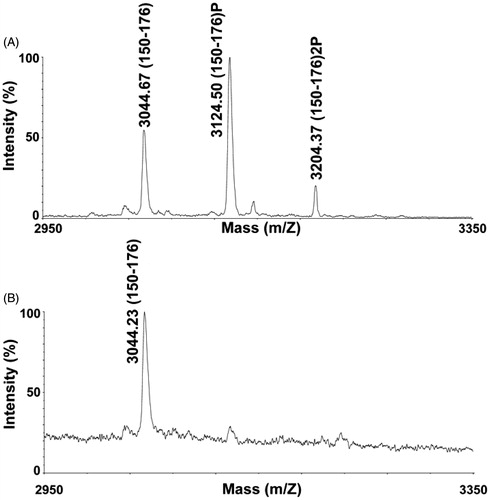
Figure 3. Phosphorylation sites assigned in PCLI1 from NIH3T3 fibroblasts. (A). The fragmentation mass spectrum of the quadruply charged ion at m/z 781.97 (theor. value: 781.55), which was associated with the mono-phosphorylated peptide 150–176 (IHSNSSSEEVSQELESpDDGDYKDDDDK), is shown as ascertained by nanoLC-ESI-LIT-MS/MS analysis. Sp indicates the phosphoserine residue. Fragment b11-b15 and y16-y12 ions (including several yn-98 ones) proved the presence of phosphorylation at Ser165; these fragment ions were shifted by -80 Da as compared with the corresponding ones observed for the non-phosphorylated counterpart (data not shown). (B) The fragmentation mass spectrum of the triply charged ion at m/z 1068.91 (theor. value: 1068.39), which was associated with the di-phosphorylated peptide 150–176 (IHSNSpSSEEVSQELESpDDGDYKDDDDK), is shown as ascertained by nanoLC-ESI-LIT-MS/MS analysis. Fragment b11-b15, y15, y14, and y12 ions (including several yn-98 ones) allowed to assign the phosphate group at Ser165; fragment y22, y23, and b4 ions were suggestive of the occurrence of a phosphate group at Ser154. (C) Sequence alignment of human and mouse PCL1 as limited to the region 150–168, where phosphorylation was ascertained.
These experiments proved PCL1 phosphorylation at Ser154 and Ser165. Amino acids surrounding a protein phosphorylation site substantially contribute to substrate recognition by protein kinases. Analysis of sequence motifs around protein phosphorylated residues did indeed allow to suggest that CK2 is the kinase involved in PCLI1 modification. In fact, CK2 phosphorylates Ser or Thr residues in a context in which acid amino acids are located downstream the phospho site at positions +1 and +2 and +3 (the latter, the most crucial residue)Citation23. In good agreement with CK2 signature, Ser154 presents two Glu residues at +3 and +4 positions, while Ser165 shows Asp residues at +1, +2, and +4 positions. CK2 is a constitutively active kinase, essential for global processes, including cell viability and proliferationCitation23. The identification of phosphorylated peptides containing either single (Ser165) or double (Ser154 and 165) phosphorylation sites suggests a mechanism in which the modification at Ser154 seems to require the previous phosphorylation at Ser165. Namely, no peptides, mono-phosphorylated at Ser154, were detected by mass spectrometry. Further studies will be necessary to confirm the kinetics of PCLI1 phosphorylation (i.e. whether the phosphorylation at Ser165 actually improves the effectiveness of Ser154 to be a suitable substrate), and the functional significance of these findings.
PCLI1 downregulation results in decreased proliferation of mouse cell lines
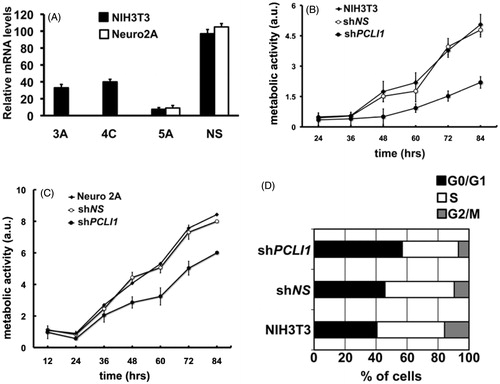
As a putative, novel substrate of CK2 activity, PCLI1 may then sustain fundamental mechanisms in mammalian cells. In a previous paper, we identified a subgroup of PTB domains having the ability to interfere with cell cycle progression in NIH3T3 fibroblastsCitation2. The exogenously expressed PTB domains were indeed able to inhibit fibroblast G1- to S-phase progression in the cell cycle, as revealed by decreased incorporation of 5-bromo-2′-deoxyuridine and increased accumulation of cells in the G1 phase of the cell cycle. We speculated that the exogenous expression of the PTB domains was triggering a dominant-negative effect on cell cycle progression, thus suggesting a role for the corresponding PTB domain-containing proteins as modulators of cell cycle events. The PTB protein–protein interaction module of PCLI1 was one of such PTB domains. PCLI1 was then appearing as a potential modulator of cell proliferationCitation2, as shown also by Wang et al., who detected its cDNA as an expressed tag associated with pre-adipocyte proliferationCitation1. To analyze in a deeper detail the role of PCLI1 in cell proliferation and cell cycle progression, we implemented a loss-of-function approach by targeting mouse PCLI1 mRNAs via RNA interference in NIH3T3 cells. The constructs were individually transfected in NIH3T3 fibroblasts with the aim to generate pools of cellular clones. In order to verify the efficacy of the different shRNAs, we tested PCLI1 transcript levels by Real-Time PCR. One of the three clones targeting PCLI1 showed a stronger effect (pool 5A), providing a decrease of PCLI1 mRNA by about 90%, when compared to NIH3T3 cells expressing a non-silencing construct (); the two additional constructs, 3A and 4C, although functional, provided less efficient targeting of PCLI1 mRNAs (). We first assessed the effects of PCLI1 silencing on the proliferation of the interfered pools of clones by using the Alamar Blue assay, which evaluates the metabolic activity of cells via a fluorescent dosage. As shown in , the pool of clones with the most effective downregulation of PCLI1 transcript (shPCLI1) was characterized by an evident decreased proliferation rate, compared to parental NIH3T3 cells and to NIH3T3 expressing a non-silencing shRNA (shNS). To verify the generality of these findings, we generated PCLI1 shRNA-interfered clones with the most effective shRNA construct (5A) in a second cellular background, namely neuroblastoma cell line Neuro2A; also in this case, the downregulation of PCLI1 was very effective (). In fact, PCLI1 downregulation resulted in decreased proliferation rate (shPCLI1), compared to parental Neuro2A and to Neuro2A cells expressing the non-silencing shRNA (shNS). In order to obtain a more detailed picture of the functions of PCLI1 gene in cell proliferation, we investigated on the effects of its downregulation in cell cycle progression. To this aim, we analyzed the distribution of exponentially growing cell populations of the PCLI1 shRNA-interfering pool 5A (shPCLI1) in the G1, S, and G2/M phases of cell cycle. As shown in , exponential cultures of shPCLI1 NIH3T3 fibroblasts showed an increased accumulation of cells in the G1 phase of the cell cycle, accompanied by a decreased representation of the cells in the S and G2/M phases, compared to control cells expressing non-silencing shRNA (shNS) and to wild-type NIH3T3 fibroblasts.
Figure 4. PCLI1 silencing induces decreased proliferation rate in murine cells. (A) Mouse NIH3T3 (black bars) or Neuro2A (white bars) cellular pools were selected after transfection with PCLI1 shRNA-encoding constructs 3A, 4C, 5A, or with a non-silencing (NS) construct. The panel shows the results of Real-Time PCR analysis of PCLI1 transcripts. (B) The proliferation rate of cellular pools of NIH3T3 fibroblasts expressing the PCLI1 5A shRNA construct was lower, compared to wild-type NIH3T3 fibroblasts or to cellular pools of NIH3T3 expressing the non-silencing shNS construct. Cells, collected at the indicated time-points, were assayed for metabolic activity with the Alamar blue assay (see Experimental Procedures for details). (C) The proliferation rate of cellular pools of Neuro2A cells expressing the PCLI1 5A shRNA construct was lower, compared to wild-type Neuro2A or to cellular pools of Neuro2A expressing the non-silencing shNS construct. Cells, collected at the indicated time-points, were assayed for metabolic activity with the Alamar Blue assay. (D) Exponentially growing cultures of wild-type NIH3T3, shNS, and shPCLI1 cells were subjected to FACS analysis to evaluate their distribution in the G0/G1, S, and G2/M phases of the cell cycle, according to their DNA content. The experiment was performed on three biological replicates, with very similar results; reported data refer to a representative experiment.
In order to verify whether decreased proliferation of PCLI1-interfered cells was actually attributable to the persistence of these cells into G1 phase of cell cycle, we synchronized cellular populations of the PCLI1 shRNA-interfering pool 5A in G0/G1 phase of the cell cycle by serum deprivation. After 24 h, we re-added serum to allow synchronous reentry of the cells in cell cycle. Accumulation of cells in the G1, S, and G2/M phases of cell cycle was analyzed by fluorescence-assisted cell sorting (FACS) in resting (starved) cells and after 10, 12, and 16 h from serum stimulation. The results of this experiment showed that shRNA-interfered PCLI1 cells did actually accumulate in G1 phase, compared to control cells, with a consequently delayed entry into the S-phase of the cell cycle (). In order to verify whether this effect was dependent on the levels of PCLI1, we correlated the extent of its downregulation by shRNA-mediated interference of the different constructs () to the effects on cell cycle progression. We performed the assay on exponentially growing cells and 12 h after serum re-addition to starved, synchronized cells; shows the data of a representative experiment. As reported in the , the exponentially growing cultures of the 3A and 4C cellular pools, in which the PCLI1 transcript levels are downregulated to a lower extent (30 to 40% of residual PCLI1 transcripts, respectively), did not allow to appreciate a difference with parental NIH3T3 and with the cells selected for a non-silencing construct. By contrast, the analysis performed on synchronized cultures, 12 h following serum re-addition, did allow to observe an attenuated accumulation of cells in the G0/G1 phase in cellular pools 3A and 4C (around 40%), compared to 5A pool (around 53%). The values obtained with the 3A and 4C pools were, however, higher than those reported for parental and control NIH3T3, which showed around 20% of cells in the G0/G1 phase. Accordingly, the percent of S-phase cells for the 3A and 4C pools (around 60%) was intermediate between the parental/control cells (80%) and the strongly PCLI1-interfered 5A pool (47%). Thus, in the presence of intermediate PCLI1 expression, it was possible to highlight an accumulation of cells in G0/G1 phase of the cell cycle, in between the results from NIH3T3 cells normally expressing PCLI1 (parental and control cells), and the cells with the most effective decrease in PCLI1 transcript expression. Together with the previous data, these results indeed support the notion that PCLI1 sustains cell proliferation and G1/S transition mechanisms in mammalian cells.
Figure 5. PCLI1 silencing induces accumulation of cells in G1 phase of the cell cycle. Wild-type NIH3T3 fibroblasts and cellular pools of NIH3T3 expressing the non-silencing (shNS) or the PCLI1 (shPCLI1) constructs were synchronized by serum deprivation (starved cells) and allowed to start cell cycle by serum re-addition for 10, 12, or 16 h. The chart reports the distribution of cells in the G0/G1, S, and G2/M phases of cell cycle of a representative experiment, according to their DNA content. The experiment was performed on three biological replicates, with very similar results; reported data refer to a representative experiment.
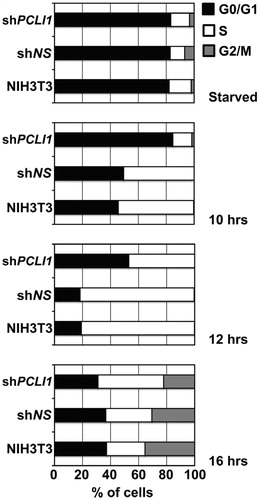
Table 1. Cell cycle distribution of exponentially growing or synchronized (12 h after serum stimulation) parental NIH3T3 cells and cellular pools for non-silencing and PCLI1-silencing constructs.
PCLI1 downregulation results in a decreased expression of early genes of the cell cycle
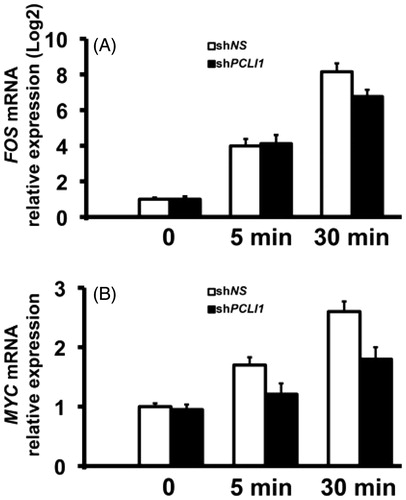
Results reported above suggest that one of the possible functions of the PCLI1 gene is to ensure the normal progression of the G1 events, required for cell cycle progression in NIH3T3 fibroblasts. In fact, PCLI1 downregulation by shRNA-mediated interference resulted in a representation of cells in the G1 phase of cell cycle, dependent upon the efficiency of RNAi-mediated targeting. We then investigated the early events of cell cycle, via analysis of the transcript levels for key, immediate-early (FOS), and early (MYC) genes of the G1 phase. These genes were among the first genes, identified as those, making the primary genomic response to mitogenic stimuli in mouse fibroblastsCitation24. The Fos family of transcription factors, including c-Fos, contributes with Jun family members to the AP-1 proteins, which regulate the expression of genes including regulators of proliferation, differentiation, and survival, as well as genes involved in invasion, metastasis, angiogenesis, and hypoxiaCitation25. MYC signaling is indeed required for G1 entry of cells and for G1/S transition, via activation of E2F1, ornithine decarboxylase, CDK4, CDC25 genes among others, and via activation of cyclinE/CDK2 complexesCitation26. As shown in , the levels of both FOS and MYC transcripts actually rise after 5–30 min from serum stimulation of control NIH3T3 cells. The increases of FOS transcripts in PCLI1-interfered cells were unaffected at 5 min from serum stimulation. However, the levels of both FOS and MYC transcripts were clearly decreased at 30 min (). MYC transcript levels in PCLI1-interfered cells were also downregulated at 5 min from serum stimulation (). Thus, the immediate-early events (5 min) leading to FOS activation are normally present in PCLI1-interfered cells. However, both FOS and MYC transcripts were downregulated at 30 min from serum-induced reentry of the shRNA-interfered fibroblasts in cell cycle. This suggests that the events downstream of FOS activation (30 min from serum stimulation) result affected in PCLI1-interfered fibroblasts. In turn, the observed decreases in the mRNA levels of such key regulators of G1 phase of cell cycle may be responsible for the observed accumulation of PCLI1-interfered cells in the G1 phase of cell cycle.
Figure 6. PCLI1 modulates expression of FOS and MYC transcripts in the early G1 phase of NIH3T3 fibroblasts. shNS or shPCLI1 cells were serum-starved and stimulated for the indicated time-points with serum. The resulting RNA samples were tested in triplicate Real-Time PCR experiments for FOS and MYC transcripts. The corresponding mRNA levels were normalized to β-actin mRNA levels.
Conclusions
The PCLI1 gene encodes a protein with two phosphorylated Ser residues at its C-terminal region. The putative kinase involved is CK2, a constitutive kinase regulating general processes in mammalian cells, including cell viability and proliferation. By implementing loss-of-function studies to dissect PCLI1 function in the model of synchronized NIH3T3 fibroblasts, we highlighted the involvement of PCLI1 in the earliest events of the cell cycle. In particular, PCLI1 functions as a factor promoting progression through G1 phase of the cell cycle; accordingly, the expression of the early genes FOS and MYC is also modulated by PCLI1 downregulation. The development of novel molecules inhibiting PCLI1 function and/or its interaction with LRP1 may find significant applications in the scenario of the treatment of pathologies, including cancer, where deregulated progression through G1 phase of the cell cycle is observed.
Declaration of interest
The authors of this manuscript state that they have neither direct nor indirect financial relation with the commercial identities mentioned in the paper that might lead to a conflict of interest.
This work has been supported by funds from Regione Campania (L.R. n. 5-2007) and Associazione Culturale DiSciMuS RFC (Progetto “Biologia dei Tumori Ipossici”) to N.Z. and PRIN2008_CCPKRP_002 and FIRB2008_RBNE08YFN3_003 to A.S.
References
- Wang B, Zhang M, Ni YH, et al. Identification and characterization of NYGGF4, a novel gene containing a phosphotyrosine-binding (PTB) domain that stimulates 3T3-L1 preadipocytes proliferation. Gene 2006;379:132–40
- Caratu G, Allegra D, Bimonte M, et al. Identification of the ligands of protein interaction domains through a functional approach. Mol Cell Proteomics 2007;6:333–45
- Kajiwara Y, Franciosi S, Takahashi N, et al. Extensive proteomic screening identifies the obesity-related NYGGF4 protein as a novel LRP1-interactor, showing reduced expression in early Alzheimer’s disease. Mol Neurodegener 2010;5:1
- Zhang CM, Chen XH, Wang B, et al. Over-expression of NYGGF4 inhibits glucose transport in 3T3-L1 adipocytes via attenuated phosphorylation of IRS-1 and Akt. Acta Pharmacol Sin 2009;30:120–4
- Wu WL, Gan WH, Tong ML, et al. Over-expression of NYGGF4 (PID1) inhibits glucose transport in skeletal myotubes by blocking the IRS1/PI3K/AKT insulin pathway. Mol Genet Metab 2011;102:374–7
- Bonala S, McFarlane C, Ang J, et al. Pid1 induces insulin resistance in both human and mouse skeletal muscle during obesity. Mol Endocrinol 2013;27:1518–35
- Zhang CM, Zeng XQ, Zhang R, et al. NYGGF4 homologous gene expression in 3T3-L1 adipocytes: regulation by FFA and adipokines. J Bioenerg Biomembr 2010;42:433–9
- Zeng XQ, Zhang CM, Tong ML, et al. Knockdown of NYGGF4 increases glucose transport in C2C12 mice skeletal myocytes by activation IRS-1/PI3K/AKT insulin pathway. J Bioenerg Biomembr 2012;44:351–5
- Zhao YP, Zhang CM, Zhu C, et al. NYGGF4 homologous gene expression in 3T3-L1 adipocytes: regulation by FFA and adipokines. Mol Biol Rep 2010;37:3291–6
- Zhao Y, Zhang C, Chen X, et al. Overexpression of NYGGF4 (PID1) induces mitochondrial impairment in 3T3-L1 adipocytes. Mol Cell Biochem 2010;340:41–8
- Chen X, Huang Z, Chen D, et al. Role of NYGGF4 in insulin resistance. Mol Biol Rep 2012;39:5367–71
- Yu Z, Guo X. NYGGF4 as a new therapeutic target for obesity-associated insulin resistance. Med Hypotheses 2012;78:432–4
- May P, Herz J, Bock HH. Molecular mechanisms of lipoprotein receptor signalling. Cell Mol Life Sci 2005;62:2325–38
- Boucher P, Herz J. Signaling through LRP1: protection from atherosclerosis and beyond. Biochem Pharmacol 2011;81:1–5
- Muratoglu SC, Mikhailenko I, Newton C, et al. Low density lipoprotein receptor-related protein 1 (LRP1) forms a signaling complex with platelet-derived growth factor receptor-beta in endosomes and regulates activation of the MAPK pathway. J Biol Chem 2010;285:14308–17
- Loukinova E, Ranganathan S, Kuznetsov S, et al. Platelet-derived growth factor (PDGF)-induced tyrosine phosphorylation of the low density lipoprotein receptor-related protein (LRP). Evidence for integrated co-receptor function between LRP and the PDGF. J Biol Chem 2002;277:15499–506
- Erdreich-Epstein A, Robison N, Ren X, et al. PID1 (NYGGF4), a new growth-inhibitory gene in embryonal brain tumors and gliomas. Clin Cancer Res 2014;20:827–36
- Shevchenko A, Wilm M, Vorm O, Mann M. Mass spectrometric sequencing of proteins silver-stained polyacrylamide gels. Proc Natl Acad Sci USA 1996;68:850–8
- D’Ambrosio C, Arena S, Salzano AM, et al. A proteomic characterization of water buffalo milk fractions describing PTM of major species and the identification of minor components involved in nutrient delivery and defense against pathogens. Proteomics 2008;8:3657–66
- Villen J, Beausoleil SA, Gerber SA, Gygi SP. Large-scale phosphorylation analysis of mouse liver. Proc Natl Acad Sci USA 2007;104:1488–93
- Trost M, English L, Lemieux S, et al. The phagosomal proteome in interferon-gamma-activated macrophages. Immunity 2009;30:143–54
- Deng WJ, Nie S, Dai J, et al. Proteome, phosphoproteome, and hydroxyproteome of liver mitochondria in diabetic rats at early pathogenic stages. Mol Cell Proteomics 2010;9:100–16
- Meggio F, Pinna LA. One-thousand-and-one substrates of protein kinase CK2? FASEB J 2003;17:349–68
- Lau LF, Nathans D. Expression of a set of growth-related immediate early genes in BALB/c 3T3 cells: coordinate regulation with c-fos or c-myc. Proc Natl Acad Sci USA 1987;84:1182–6
- Milde-Langosch K. The Fos family of transcription factors and their role in tumourigenesis. Eur J Cancer 2005;41:2449–61
- Matsumura I, Tanaka H, Kanakura Y. E2F1 and c-Myc in cell growth and death. Cell Cycle 2003;2:333–8