
Abstract
Goji (Lycium barbarum L.) leaves are emphasized as a functional tea or as dietary supplements. The phenolic compound profile, antioxidant, enzyme inhibitory, antimicrobial, and antimutagenic activities of leaf extracts from two selected cultivars in comparison with wild-growing plants have been evaluated. HPLC-DAD/ESI-ToF-MS analysis revealed the presence of phenolic acids and flavonoids with chlorogenic acid and rutin being the dominant compounds in the cultivated plants, whereas rutin and kaempeferol-3-O-rutinoside for wild growing ones. In particular, cv. Erma contained the highest amount of chlorogenic acid and showed a strong tyrosinase-inhibitory effect. Staphylococcus aureus, Listeria monocytogenes, and Penicillium funiculosum were the most sensitive strains when exposed to extracts from cultivated plants. Antimutagenic activity was evaluated by Ames' test. The tested extracts provided high protection against mutagenicity induced by 2-anthramine (2-AA) to Salmonella typhimurium strains TA 98 and TA 100 (max. inhibition (%) 88% and 74.2%, respectively). Overall, Goji leaves are a rich source of bioactive compounds with functional properties that need further risk/benefit evaluation when used in foods or health-promoting formulations.
Introduction
Functional or bioactive components are biomolecules, mostly comprising phytochemicals that occur in food and possess the ability to modulate one or more metabolic processes or pathways in the human organism resulting in health benefits and promotion of well-beingCitation1,Citation2. Over the past four decades, several thousands of phytochemicals have been identified in plants. Herbs, herbal extracts, and single phytochemicals are broadly used as foods, drugs, or remedies in traditional medicine. Many herbal products have health-promoting effects and, therefore, are marketed as suchCitation3. As a consequence, there has been much emphasize in phytochemicals with different biological properties such as antioxidant, antimicrobial, antiviral, antimutagenic, anticancer activity, or their use in pathologies such as Alzheimer’s and cardiometabolic disorders, in recent yearsCitation4.
Among these phytochemicals, phenolic compounds are widely spread in foods and herbals and have attracted much attention being probably the most investigated molecules of medicinal and nutritional interestCitation5–7. Besides, they exhibit various bioactivities such as antimicrobial, antiviral, antiallergic, anti-inflammatory, and protective effects against cell and cutaneous agingCitation8,Citation9. Their antioxidant properties as well as their beneficial effects against Alzheimer’s disease, diabetes mellitus, and cardiovascular diseases are nowadays highly emphasizedCitation7,Citation10–12. In recent years, the possible toxicity of synthetic antioxidants has been reportedCitation13. Thus, the potential of plant products to serve as natural antioxidants for protecting against various diseases induced by free radicals has been explored. Increased popularity of natural food additives may prompt more food manufacturers to replace synthetic antioxidants with natural ingredients containing natural antioxidative compounds (‘clean labeling’). Therefore, research on natural additives has gained momentum as they are perceived as posing no health risk to the consumersCitation14.
The genus Lycium (Solanaceae) comprises approximately 70 species and is disjunctly distributed in temperate to subtropical regions of South America, North America, southern Africa, Eurasia, and AustraliaCitation15. Lycium barbarum L. is a defoliated shrubbery that grows in China, Tibet, and other parts of Asia and its fruits are 1–2 cm-long, bright orange-red ellipsoid berriesCitation16. The original area of Lycium spp. is not definitively established, but is likely based in the Mediterranean Basin. Meanwhile, the plant is widely distributed in warm regions of the world, in particular, in the Mediterranean area and Southwest and Central Asia. It is also cultivated in North America and Australia as a hedge plantCitation17,Citation18. Goji fruits have been widely used as concentrated extracts, in different beverages, and as ingredients in yogurts for their benefits to anti-aging, kidney, and liver functionsCitation19,Citation20. Modern pharmacological research indicates effects of Goji fruits on aging, neuroprotection, general well-being, fatigue/endurance, metabolism/energy expenditure, glucose control in diabetics, antioxidant properties, immunomodulation, antitumor activity, and cytoprotection. Lycium barbarum is currently sold world-wide also as a dietary supplement or classified as a nutraceutical food for its long ago and safe use in traditional Chinese medicineCitation16,Citation18.
However, the leaves of L. barbarum, called “tianjingcao” (vitality and vigor of the nature) in traditional Chinese medicine, have been rarely studied, despite their use in alleviating mineral deficiency, combating heat distress, quenching thirst, dispelling wind, and enhancing eyesightCitation21. Moreover, L. barbarum leaves have also been widely used as tea, medicinal vegetables, and herbal drugs in China, Southeast Asia, and are nowadays highly emphasized in Europe and North America as a functional tea or in dietary supplements. Besides, L. barbarum tender leaves have been used to cook soup, or consumed stir-fried, and with boiled eggs in many Asian countriesCitation22.
At the same time, one can notice a competing trend to cultivate medicinal plants or other nutraceuticals away from their native origin and closer to countries where they will be processed and used. Thus, in recent years, there has been a growing trend in introducing Goji cultivation to different pedoclimates (Italy, Romania, Bulgaria, etc.), or even developing new cultivarsCitation18,Citation23–25.
Information about L. barbarum leaves’ chemical composition or further bioactivities is not comprehensively and quite limited. However, Goji leaves have been described as a sustainable source of antioxidants and antibacterial compounds, recentlyCitation22,Citation26.
Considering the under-estimated biological potential of L. barbarum leaves, this study aimed at investigating the phenolic profile and antioxidant capacity of leaves from two newly developed Goji cultivars in comparison with spontaneous growing plants. Moreover, a special aim of this study was to assess the cholinesterase, α-amylase, and α-glycosidase inhibitory potential, antimicrobial, and antimutagenic properties of Goji leaves in order to establish a scientific basis for further applications of this plant as a functional food/ingredient. In particular, the evaluation of anti-tyrosinase properties of the extracts could provide novel applications for both food and cosmetic industries. Furthermore, a molecular modeling approach was used to further investigate the enzyme inhibitory effects.
Materials and methods
Plant samples
Leaves of L. barbarum from two cultivars and spontaneously growing plants were collected in the summer of 2014 from three origins: (1) cultivar Erma (Lbe) was collected from an ecological culture in North-Vest Romania, Ciuperceni (47°52’14″ N, 23°0’55″ E), Satu-Mare County; (2) cultivar Biglifeberry (Lbb) was collected from an ecological culture in NV Romania, Ploscoş (46°38’33″ N, 23°50’43″ E), Cluj County; (3) wild growing L. barbarum leaves (Lbn) were collected in NV Romania, Turda (46°33’52″ N, 23°47’49″ E), Cluj County. Voucher specimens were deposited in the Herbarium of the Department of Pharmaceutical Botany, Faculty of Pharmacy, "Iuliu Hatieganu" University of Medicine and Pharmacy, Cluj-Napoca, Romania. The plant material was dried at room temperature (∼21 °C) in a shaded place for 2 weeks.
Extraction procedure
The ground plant sample (2 g) was extracted with the help of ultrasound with 20 mL of methanol/water (70:30, v/v) at room temperature for 1 h. The extract was filtered through paper filter (MN 615, Macherey-Nagel, Düren, Germany). Following syringe filtration (0.45 µm nylon membrane), the extracts were analyzed with LC-DAD/ESI-ToF-MS. For evaluating the biological activity, extracts obtained were evaporated under reduced pressure and further kept in a vacuum desiccator to fully remove traces of solvents. For each bioassay where a specific concentration of the extracts is not mentioned, the raw extract was used. In case of antimicrobial and antimutagenic evaluation the concentration of 1 mg/mL was initially considered before subsequent dilutions. For each analysis, three different samples were used and the assays were performed in triplicate.
Separation, identification, and quantification of phenolic compounds
LC-DAD and quantification of phenolic compounds
The phenolic compounds from the different extracts of L. barbarum leaves were analyzed using a LC-DAD Smartline series system from Knauer GmbH (Berlin, Germany). The low-pressure gradient was performed with a Smartline manager S5050, pump S1000, autosampler S3950, and diode array detector S2600. The system was controlled with ClarityChrom 3.0 software (Knauer GmbH, Berlin, Germany). The separation was carried out on a Nucleodur® 5 µm C18 HTec (250 mm ×3 mm) column equipped with a C18 security guard (4 mm ×3 mm), both from Macherey-Nagel (Düren, Germany), at a temperature of 21 °C, a flow rate of 0.6 mL/min and UV-detection at 280 nm, 325 nm, 350 nm, and 365 nm. A binary gradient system with eluent (A) 0.1% formic acid in water, eluent (B) 0.1% formic acid in acetonitrile and the following gradient was used for the extracts: 10% B isocratic (0–1 min), 10–40% B (1–30 min), 40% B isocratic (30–33 min), 40–10% B (33–34 min), and 10% B isocratic (34–37 min). For quantitative analysis, a calibration curve (R2 ≥ 0.99) for each standard compound available (chlorogenic acid, quercetin-3-O-rutinoside, quercetin-3-O-glucoside, ferulic acid) was drawn up based on the corresponding UV signals. For a phenolic compound identified for which a commercial standard was not available, the quantification was performed using the calibration curve of another compound from the same phenolic group (e.g. neochlorogenic acid expressed as chlorogenic acid). The results were calculated on a basis of mg per g of dry weight vegetal material.
HPLC-ESI-ToF-MS for the identification of phenolic compounds
The structural characterization of the phenolic compounds in the leaves of L. barbarum was carried out on a LC-DAD/ESI-ToF-MS system consisting of an HPLC Agilent 1200 Series with Agilent Mass Hunter B.05.01 software (Agilent, Santa Clara, CA), and an ESI-TOF Agilent 6224 mass spectrometer with software Agilent Mass Hunter B.05.01 (Agilent, Santa Clara, CA), and MestReNova 7 (Mestrelab Research SL, Santiago de Compostela, Spain). The HPLC system consisted of a binary pump, an autosampler, a column compartment, and a diode array detector. The LC-DAD method was similar to the LC-DAD method described above with the exception of a reduced flow rate of 0.5 mL/min. ESI-ToF experiments were recorded in both positive and negative mode and a scan range between 110 and 2000 m/z. The capillary voltage was set to 4 kV and the capillary temperature was at 325 °C. N2 was used as dry gas with a dry flow of 10 L/min and a pressure of 30 psi for the nebulizer.
Total phenolic content (TPC)
The TPC was determined using the Folin–Ciocâlteu method as reported previouslyCitation27,Citation28. For a high throughput of samples, a Synergy HT Multi-Detection Microplate Reader with 96-well plates (BioTek Instruments, Inc., Winooski, VT) was used. A mixture solution consisting of 25 µL sample extract, 125 µL of Folin–Ciocâlteu reagent (10-fold diluted from the stock solution), and 100 µL of sodium carbonate (Na2CO3) solution (7.5% w/v) was homogenized and incubated at room temperature in the dark for 2 h. The absorbance was measured at 760 nm against a solvent blank. Gallic acid was used as a standard, and the content of TPC was expressed as gallic acid equivalents (GAE) in mg/g dry weight (dw) of vegetal material.
Total flavonoid content (TFC)
The TFC of the extracts was determined according to methods described previouslyCitation28,Citation29. An 100 µL aliquot of 2% AlCl3 ethanolic solution was added to 100 µL of the extracts and mixed. After incubating for 1 h at room temperature, the absorbance at 420 nm was measured against a solvent blank. The TFC was expressed as quercetin equivalents (QE) in mg/g dry weight (dw) of vegetal material.
Trolox equivalent antioxidant capacity (TEAC) assay
The TEAC of the different Lycium extracts against the stable synthetic ABTS•+ radical cation was assessed using the method described by Barakat and RohnCitation29 and Rohn et al.Citation30 with some modifications. A trolox calibration curve was plotted as a function of the percentage of ABTS radical cation scavenging activity. The final results were expressed as milligrams of trolox equivalents (TE) per gram of vegetal material (mg TE/g dw).
Electron paramagnetic resonance (EPR) spectroscopy
To compare with the results of the photometric measurements, the radical scavenging activity of different L. barbarum leaves extracts was additionally measured with EPR spectrometry using the stable synthetic radical Fremy’s salt as reported previouslyCitation29,Citation31. Primarily, the Lbb and Lbe extracts were diluted 100-fold and the Lbn 50-fold (v/v), respectively. A mixture of 25 µL of the dilution and a 25 µL of a 1 mM Fremy’s salt solution [potassium nitrosodisulfonate, K2NO(SO3)2] in phosphate buffer (pH 7.4) were filled into a 50 µL capillary. After a reaction time of 30 min, the EPR spectrum of Fremy’s salt radical was recorded and intensity was obtained by integration of the signal. The antioxidant activity of the extracts, expressed as milligrams of Fremy’s salt equivalents per gram dry matter (mg FSE/g dw), was calculated in comparison to a control reaction with the solvent. Spectra were recorded at 21 °C on a Miniscope MS 200 X-band spectrometer (Magnettech GmbH, Berlin, Germany) with the microwave power set to 10 dB and using modulation amplitude of 1500 mG.
Enzyme inhibitory activity
Cholinesterase (ChE) inhibition
ChE inhibitory activity was measured using Ellman’s method, as reported previouslyCitation32,Citation33. Sample solution aliquot (50 µL, 2 mg/mL) was mixed with 125 µL 5,5-dithio-bis(2-nitrobenzoic) acid (DTNB) and acetylcholinesterase (AChE from Electric eel, Type-VI-S, EC 3.1.1.7, Sigma, Saint Louis, MO), or butyrylcholinesterase (BChE from horse serum, EC 3.1.1.8, Sigma, Saint Louis, MO) solution (25 µL) in Tris-HCl buffer (pH 8.0) in a 96-well microplate and incubated for 15 min at 25 °C. The reaction was then initiated with the addition of acetylthiocholine iodide (ATCI) or butyrylthiocholine chloride (BTCl) (25 µL). Similarly, a blank was prepared by adding sample solution to all reaction reagents without enzyme(s) (AChE or BChE) solution. The sample and blank absorbances were recorded at 405 nm after 10 min incubation at 25 °C. The absorbance of the blank was subtracted from that of the sample and the cholinesterase inhibitory activity was expressed as milligrams of galanthamine equivalents (mg GALAE/g extract).
α-Amylase inhibition
α-Amylase inhibitory activity was performed using Caraway–Somogyi iodine/potassium iodide (IKI) methodCitation32,Citation34. Sample solution (25 µL, 2 mg/mL) was mixed with α-amylase solution (porcine pancreas, EC 3.2.1.1, Sigma, Saint Louis, MO) (50 µL) in phosphate buffer (pH 6.9 with 6 mM sodium chloride) in a 96-well microplate and incubated for 10 min at 37 °C. After pre-incubation, the reaction was initiated with the addition of starch solution (50 µL, 0.05%). Similarly, a blank was prepared by adding sample solution to all reaction reagents without enzyme solution. The reaction mixture was incubated 10 min at 37 °C, then stopped by adding HCl (25 µL, 1 M). This is followed by the addition of the iodine–potassium iodide solution (100 µL). The sample and blank absorbances were recorded at 630 nm. The absorbance of the blank was subtracted from that of the sample and the α-amylase inhibitory activity was expressed as millimoles of acarbose equivalents (mmol ACE/g extract).
α-Glucosidase inhibition
α-Glucosidase inhibitory activity was performed as previously described by Zengin et al.Citation32 and ZenginCitation35. Sample solution (50 µL) was mixed with glutathione (50 µL, 2 mg/mL), 50 µL α-glucosidase solution (from Saccharomyces cerevisiae, EC 3.2.1.20, Sigma, Darmstadt, Germany) in phosphate buffer (pH 6.8), and 50 µL of 10 mM PNPG (4-N-trophenyl-α-d-glucopyranoside) (Sigma-Aldrich, Darmstadt, Germany) solution in a 96-well microplate and incubated for 15 min at 37 °C. Similarly, a blank was prepared by adding sample solution to all reaction reagents without enzyme solution. The reaction was stopped with the addition of sodium carbonate (50 µL, 0.2 M). The sample and blank absorbances were recorded at 400 nm. The absorbance of the blank was subtracted from that of the sample and the α-glucosidase inhibitory activity was expressed as millimoles of acarbose equivalents (mmol ACE/g extract).
Tyrosinase inhibition
Tyrosinase inhibitory activity was measured using the modified dopachrome method with L-DOPA as substrate, as previously reportedCitation32 with slight modifications. A sample solution (25 µL, 2 mg/mL) was mixed with tyrosinase solution (40 µL) and phosphate buffer (100 µL, pH 6.8) in a 96-well microplate and incubated for 15 min at 25 °C. The reaction was then initiated with the addition of L-DOPA (40 µL). Similarly, a blank was prepared by adding sample solution to all reaction reagents without enzyme (tyrosinase) solution. The sample and blank absorbances were recorded at 492 nm after incubating 10 min at 25 °C. The absorbance of the blank was subtracted from that of the sample and the tyrosinase inhibitory activity was expressed as equivalents of kojic acid (mg KAE/g extract).
Molecular modeling studies
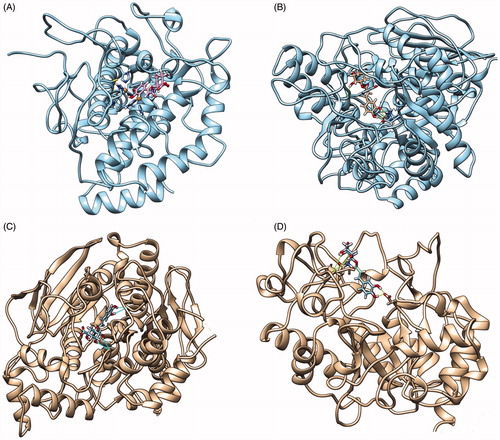
Molecular modeling studies were carried out in order to confirm the role of chlorogenic acid in the inhibition of the tested enzymes, exemplarily. Docking experiments with the ligand chlorogenic acid have been performed with butyrylcholinesterase (pdb code: 4BDS)Citation36, α-amylase (pdb code: 1VAH)Citation37, α-glucosidase (pdb code: 3AXI)Citation38, and tyrosinase (pdb code: 2Y9X)Citation39. The receptors have been prepared by using the Maestro 11.0 (free academic licence), protonated at neutral pH and all the crystals errors were corrected by hand. The docking experiments have been carried out using Gold suite 6 softwareCitation40, using the scoring function chemscore, which is designed to work in the presence of metallo-enzymes as in the case of tyrosinase. The docking grid has been automatically calculated by Gold, centered on the crystallographic ligand, the best docking pose found for each enzyme-chlorogenic acid complex is depicted in .
Figure 1. Best docking pose found between chlorogenic acid and tyrosinase (A), α-glucosidase (B), butyrylcholinesterase (C) and a-amylase (D).
Molecular dynamics of the chlorogenic acid-tyrosinase complex
In order to gain further information about the time-dependent behavior of the chlorogenic acid–tyrosinase complex found in the docking experiments, a molecular dynamics experiment was carried out using the software Amber 14Citation41. The partial charges of the ligand (chlorogenic acid) were determined by using the AM1-BCC method of Antechamber suite. The complex tyrosinase–chlorogenic acid was prepared by leap suite, hydrated in a cubic water box of 20 Å, and the net charge neutralized by adding Na+ ions. Then, the complex was minimized for 3000 steps of steepest descent followed by conjugate gradient until convergence of 0.05 kcal/Å mols. In a second stage, the complex was subjected to molecular dynamic simulations. Then, molecular dynamics trajectory was run. The simulation was analyzed for 10 ns with recording one frame every 0.1 ns.
Antimicrobial activity
Bacteria and culture conditions
For this bioassay, six bacterial strains were used: four Gram-positive bacteria: Staphylococcus aureus (ATCC 49444), Bacillus cereus (ATCC 11778), Listeria monocytogenes (ATCC 19114), and Enterococcus faecalis (ATCC 29212), and three Gram-negative bacteria: Pseudomonas aeruginosa (ATCC 27853), Salmonella typhimurium (ATCC 14028), and Escherichia coli (ATCC 25922), as well as two anaerobic strains: Fusobacterium nucleatum (ATCC 25586) and Peptostreptococcus anaerobius (ATCC 27337). All the tested microorganisms were obtained from Food Biotechnology Laboratory, Life Sciences Institute, University of Agricultural Sciences and Veterinary Medicine Cluj Napoca, Romania. The aerobic strains were cultured on Muller–Hinton agar and cultures were stored at 4 °C and subcultured once a month. Anaerobic bacteria were cultured overnight at 37 °C on thioglycollate broth with resazurin media at 37 °C.
Microdilution method
The modified microdilution technique was used to evaluate the antimicrobial activity of the samples as reported previously by Mocan et al.Citation42,Citation43. Briefly, fresh overnight cell suspensions were adjusted with sterile saline solution to a concentration of approximately 2 × 10⁵ CFU/mL in a final volume of 100 µL per well. The inoculum was stored at 4 °C for further use. Dilutions of the inoculums were cultured on solid Muller–Hinton (MH) agar for bacteria to verify the absence of contamination and to check the validity of the inoculums. Determinations of minimum inhibitory concentrations (MICs) were performed by a serial dilution technique using 96-well plates. Different dilutions of the extracts were carried out with wells containing 100 µL of MH broth and afterwards, 10 µL of inoculum was added to all the wells. The microplates were incubated for 24–48 h at 37 °C. The MIC of the samples was detected following the addition of 20 µL (0.2 mg/mL) of resazurin solution to each well, and the plates were incubated 2 h at 37 °C. A change from blue to pink indicates reduction of resazurin and, therefore, bacterial growth. The MIC was defined as the lowest drug concentration that prevented this color change. The minimum bactericidal concentrations (MBCs) were determined by serial subcultivation of a 2 µL into microtitre plates containing 100 µL of broth per well and further incubation for 48 h at 37 °C. The lowest concentration with no visible growth was defined as MBC, indicating 99.5% killing of the original inoculum. Streptomycin (Sigma P 7794, Santa Clara, CA) (0.05–3 mg/mL) was used as positive control for bacterial growth. Water was used as negative control.
Antifungal activity
For this bioassay, following fungi were used: Aspergillus flavus (ATCC 9643), Aspergillus niger (ATCC 6275), Candida albicans (ATCC 10231), Candida parapsilosis (ATCC 22019), and Penicillium funiculosum (ATCC 56755), all bought from the same source as mentioned above. Cultures were maintained on malt agar at 4 °C and subcultured every month. Spore suspension (1.0 × 10⁵) was obtained by washing agar plates with sterile solution containing (0.85% saline, 0.1% Tween 80 (v/v)), then added to each well to a final volume of 100 µL. Inocula were screened for contamination by culturing on a solid medium. The minimum inhibitory (MIC) and minimum fungicidal (MFC) concentrations assays were performed using the microdilution method by preparing a serial of dilutions in 96-well plates. The extracts were diluted in 0.85% saline (10 mg/mL), then added to microplates containing Broth Malt medium with inoculum and incubated for 72 h at 28 °C on a rotary shaker. The lowest concentrations without visible growth (at the binocular microscope) were defined as minimal inhibitory concentrations (MICs). The fungicidal concentrations (MFCs) were determined by serial sub-cultivation of 2 µL of tested extracts dissolved in medium and inoculated for 72 h, into microtiter plates containing 100 µL of broth per well and further incubation 72 h at 28 °C. The lowest concentration with no visible growth was defined as MFC indicating 99.5% killing of the original inoculum. The fungicide fluconazole (Sigma F 8929, Santa Clara, CA) was used as positive control (1–3500 µg/mL). All the experiments were performed in duplicate and repeated thrice. Water was used as a negative control.
Antimutagenicity
Microbial mutagenicity was assayed by the standard Ames test (standard plate incorporation assay) according to Maron and AmesCitation44 and Ong et al.Citation45. To avoid an erroneous result caused by antimicrobial effect of tested samples towards test strains, a preliminary toxic dose range experiment was performed to determine an appropriate dose range for the Ames test. Samples were prepared with 0.1 mL of 10 h-cultured test strain (approx. 108 cells/mL), 0.1 mL of the test extracts (5 mg/plate), 0.1 mL of phosphate buffer (0.2 M, pH 7.4) and 0.5 mL of S9 mix or phosphate buffer. The serial dilutions were immediately made with phosphate buffer, and then 1 mL of the aliquot was mixed with 12 mL of nutrient agar. After incubation at 37 °C for 48 h, the number of colonies was counted. A toxicity effect was confirmed when the standard plate count of the tested compound was lower than that of the control (with no compound added).
A mixture containing 0.1 mL of the extracts (5 mg/plate), 0.5 mL of S9 mix or phosphate buffer, 0.2 mL of 0.5 mM histidine-biotin and 0.1 mL 10 h-cultured test strain (approximately 108 cells/mL) was added to a tube containing 2 mL of top agar. The tube was then gently vortexed and poured onto the MA plate. The extracts were tested with and without S9 mix, and triplicate plates are poured for each dose of extracts. Reference mutagens, 2-AA (2-anthramine) (5 µg/plate or 2 µg/plate) were prepared by dissolving in DMSO and served as positive control chemicals. After incubation at 37 °C for 48 h, the number of revertants was counted. An extract was considered as a mutagen when there was a two-fold increase in the number of revertants, comparing with the number of spontaneous revertants (negative control). The antimutagenic effect of the tested sample was assessed using the Ames test, except for the addition of reference mutagens, 2-AA in each tested plate. The antimutagenicity of the reference mutagens in the absence of the extract was defined as 0% inhibition, and the antimutagenicity was calculated according to the formula given by Ong et al.Citation46: % Inhibition = [1 − T/M] × 100, where T is the number of revertants per plate in the presence of mutagen and the extract and M is the number of revertants per plate in the positive control (without extract). The tests were performed in duplicate with three sub-samples each, and the data was presented as mean ± standard deviation (SD).
Statistical analysis
The standard deviation was calculated and the averaged values along with the standard deviations (SD) are documented in the respective tables or figures. One-way analysis of variance (ANOVA) was used to detect any significant differences among different means as well as interactions between the variables used in biochemical analyses.
Results and discussion
TPC and TFC
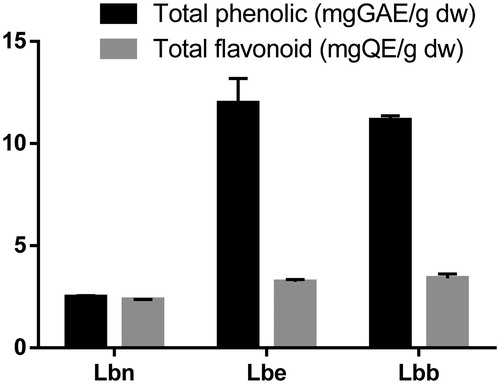
In this study, Goji leaves have been characterized. The total phenolic and flavonoid contents of the three Lycium leaves extracts are presented in . The two cultivars Lbb and Lbe provided similar values in terms of TPC (11.14 mg GAE/g dw and 11.98 mg GAE/g dw, respectively), while wild-growing Lbn had a significant lower amount (2.49 mg GAE/g dw). A similar trend was observed for the TFC (). These results are in agreement with a study by Dong et al.Citation47 who found that total flavonoids in the leaves of cultivated L. barbarum were significantly higher than those in wild L. barbarum, suggesting that cultivated Goji leaves varieties can be promising raw materials for being used in functional foods. Higher yields of TPC and TFC contents were reported by Abdennacer et al.Citation48 in leaves of wild-growing Tunisian Lycium intricatum Boiss. while a similar trend was also described by Simirgiotis et al.Citation49 concerning South American berries and leaves of Luma spp. In this case, the observed differences for total bioactive components in these extracts may be explained with agro-climatic conditions including rainfall, altitude, or soil composition as well as genetic differences. Similar trends were reported by several researchersCitation50,Citation51.
Figure 2. Total phenolic and flavonoid contents of the three extracts from Lycium barbarum leaves (mean ± SD).
Characterization of phenolic compounds
The characterization of the single phenolic compounds in the Lycium leaves extracts was performed by HPLC-DAD-ESI-ToF-MS analysis. Retention times, λmax, mass spectrometric characteristics, identification, and their distribution in the samples are presented in and . Exemplarily, the HPLC phenolic profile of Lbb recorded at 325 nm is illustrated in . UV and mass spectra showed that the phenolic composition of the leaves of L. barbarum is mainly characterized by the presence of several hydroxycinnamic acids and flavonoid glycosides.
Figure 3. LC-DAD chromatogram (at 325 nm) of the phenolic compounds from L. barbarum leaves (cultivar Lbb- "Bigligeberry"). For compounds numbers refer to .
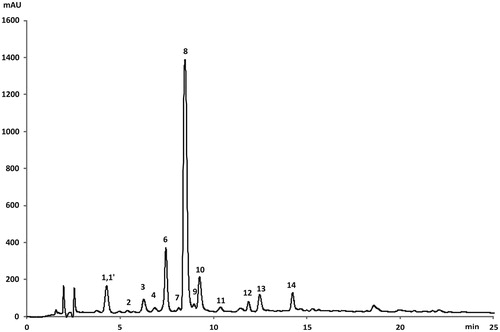
Table 1. Phenolic compounds in Lycium barbarum leaves, retention times (Rt), wavelengths of maximum absorption (λmax), mass spectral data and identification.
Table 2. Phenolic compounds (μg/g dw) and their distribution in Lycium barbarum leaves (mean ± SD).
Hydroxycinnamic acids
From the hydroxycinnamic acids identified, compounds correspond to caffeoylquinic (compounds 3 and 8–11 in ) or ferulic acid derivatives (compound 13 in ). Compound 8 was identified as 5-O-caffeoylquinic acid (5-CQA, chlorogenic acid) by comparison with an authentic standard. Chlorogenic acid have been previously reported in fruits of L. barbarum, L. chinense, and L. rhutenicum as well as in L. intricatum fruits, where it was described as being the main compoundCitation18,Citation48,Citation52,Citation53. Besides, it was also described as dominant in the leaves of wild L. barbarum, L. intricatum, or cultivated L. chinenseCitation26,Citation48,Citation54. Contents of chlorogenic acid in Chinese wild-growing L. barbarum leaves range between 2.09 mg/g dw and 4.28 mg/g dw, as reported by Dong et al.Citation54, whereas the value from the present study of wild-growing L. barbarum leaves is comparatively lower (510.68 µg/g dw). However, with regard to the two cultivars Lbe and Lbb, chlorogenic acid was found as the dominant compound with yields approximately 48 times higher than in the wild-growing plant (24 887 µg/g dw for Lbe and 17 811 µg/g dw for Lbb, respectively). This fact may suggest that besides culture conditions, geography, ecophysiology, harvesting time, and storage, genotype most significantly affects the composition of bioactive compounds. Compound 3 (m/z 353 [M–H]−) was, based on its MS fragmentation pattern, identified as 3-O-caffeoylquinic acid (neochlorogenic acid) yielding a peak at m/z 191 with an abundance of 45.6% and two further ions, one at m/z 179 with an abundance of 23.4% and the other at m/z 135 with the abundance of 15.7%. The same compound presented also a dimeric adduct ([2M–H]− at m/z 707 with an abundance of 16.4%). This fragmentation behavior is considered characteristic for neochlorogenic acid as previously reported by Clifford et al.Citation55,Citation56) Compound 10 (λmax = 326; 296sh) was easily distinguished among the other caffeoylquinic acids because of its signal at m/z 173 [quinic acid–H–OH]− (15.8%), accompanied by another fragment ion at m/z 179 (13.7%), which allowed identifying it as 4-O-caffeoylquinic acid (cryptochlorogenic acid) according to the fragmentation pattern described by Clifford et al.Citation55,Citation56. Compound 11 showed similar fragmentation pattern and fragment abundances as those obtained for 5-O-caffeoylquinic acid (chlorogenic acid), indicating the presence of an isomer. However, according to Barros et al.Citation57, and based on its fragmentation pattern and small amounts, it was tentatively assigned as cis-5-O-caffeoylquinic acid. Results of the present study are in line with previous findings of Abdennacer et al.Citation48 who reported the presence of chlorogenic acid and its isomers in the leaves of Tunisian Lycium intricatum. Compound 9 had a pseudomolecular ion at m/z 499 that led to further fragments at m/z 353 ([caffeoylquinic acid–H]−), and 191 and 179, corresponding to deprotonated quinic acid and deprotonated caffeic acid, respectively, which allowed identifying it as a further 3-O-caffeoylquinic acid derivativeCitation58. Compound 13 (λmax = 325; 296sh and [M–H]− at m/z 367) was identified as 5-O-feruloylquinic acid according to Clifford et al.Citation55, and based on its MS fragmentation, presenting a fragment at m/z 191 (34%) resulting from a loss of a feruloyl moiety, and two additional fragments at m/z 173 and m/z 735, the latter indicating a dimeric adduct of the feruloylquinic acid molecule. These data are consistent with the feruloylquinic acid isomers found previously in leaves of Lycium intricatum by Abdennacer et al.Citation48.
Flavonoid glycosides
In the present study, 11 quercetin and kaempferol glycosides have been tentatively identified in the two orchard cultivars and the wild-growing Lycium leaves. A total of 10 flavonol glycosides were detected in naturally growing Lycium leaves. For cultivars Lbb and Lbe, the flavonoid profile was consisted of only five or two dominant compounds, respectively. Detailed mass spectra with fragmentation patterns, depending on the compound, maximum wavelength of their UV–Vis spectra, retention times, and quantitative data are presented in and . Generally, all mass spectra were characterized by their deprotonated molecular ions [M–H]− or by their protonated molecular ions [M + H]+. However, due to the fact that in these experiments, the compounds presented higher ionization yields in the positive mode, the data obtained in this mode were further used for discussions related to compounds assignment, as previously reported by Dong et al.Citation47. The assignment of different sugar substitutions at the flavonoid aglycons was carried out in accordance with previous studiesCitation48,Citation59,Citation60. Those studies demonstrated that the first fragmentation of the quasi-molecular ion [M–H]−/[M + H]+ is due to the breakdown at the 7-O position leading to a peak ion [M + H-146]+ for pentosides, [M + H-162]+ for monohexosides or [M + H-324]+ for dihexosides, and the remaining sugars at the flavonoid molecule are to be linked to the hydroxyl group at the 3-O position of the flavonol skeleton. Compound 14 was identified as rutin (quercetin-3-O-rutinoside) by comparing with an authentic standard. Rutin was detected in all samples. The highest amount was found in cultivar Lbe (9339 µg/g dw). These results are in agreement with Dong et al.Citation47,Citation54 who reported that levels of rutin in leaves of cultivated Chinese Lycium barbarum are much higher than those in wild-growing plants and are influenced by ecophysiological factors and geographical origin. Compound 1 ([M + H]+ at m/z 789) and compound 2 ([M + H]+ at m/z 773) provided similar fragmentation behavior, each yielding a fragment at m/z 465 (67.9%), and 449 (93.2%), respectively, characterized by the loss of a dihexoside from the 7-O position. Additional fragments were observed at m/z 303 ([aglycone + H]+) and m/z 287 ([aglycone + H]+), respectively, indicating a supplementary loss of a glucose moiety (−162 amu) from the 3-O position. Thus, compound 1 was identified as quercetin-3-O-glucoside-7-O-sophoroside and compound 2 as kaempferol-3-O-glucoside-7-O-sophoroside, respectively. Compound 1’ (λmax = 352; 266sh and [M + H]+ at m/z 1113) co-eluted with compound 1 and was assigned based on its UV–vis maxima and mass spectra as quercetin-3-O-sophorotrioside-7-O-sophoroside. Compounds 5 ([M + H]+ at m/z 773) and 7 ([M + H]+ at m/z 757), identified as quercetin-3-O-rutinoside-7-O-glucoside and kaempferol-3-O-rutinoside-7-O-glucoside provided significant similarities in their fragmentation behavior. Thus, both produced a fragment at m/z 611 indicating the loss of 162 amu from the 7-O position, corresponding to a glucose moiety. Moreover, additional fragments consistent with the loss of a rutinoside moiety (308 amu) were observed at 465 m/z and 449 m/z, respectively. In fact, these two compounds were previously reported by Yao et al.Citation53 in leaves of European wild growing L. halimifolium. The fragmentation behavior of compound 6 was consistent with quercetin-3-O-sophoroside-7-O-rhamnoside, by yielding a fragment at m/z 627 resulting from a loss of a rhamnose moiety (−146 amu) from the 7-O position and two additional fragments at m/z 465 (M-146; M-162) and m/z 303 (M-146; M-324), suggesting in this case a gradual oligosaccharide breakdown from the 3-O position. Sophorosides of quercetin and kaempferol were previously reported by Terauchi et al.Citation61 in the leaves of L. chinense. Compounds 12 ([M + H]+ at m/z 627) and 15 ([M + H]+ at m/z 611) were tentatively identified as quercetin-3,7-O-diglucoside and quercetin-3-O-glucoside-7-O-rhamnoside based on their UV–vis maxima and MS behavior. Both presented a fragment at m/z 465 indicating the loss of a glucose (−162 amu) and rhamnose (−146 amu) moiety, respectively, from the 7-O position, and the protonated aglycone at m/z 303 via an additional loss of a glucose (−162 amu) from the 3-O position. Finally, compounds 16 and 17 presented UV–Vis absorption maxima and MS characteristics coherent with kaempferol-3-O-rutinoside (nicotiflorin) and kaempferol-3-O-glucoside-7-O-rhamnoside. Thus, both compounds showed a fragment at m/z 287 indicating the protonated aglycone via the loss of the sugar substituents. Additionally, a fragment at m/z 449 was observed for compound 17 suggesting the loss of a rhamnose moiety (−146 amu) from the 7-O position. Nicotiflorin has been reported to be present in wild growing L. halimifolium leaves as well in aerial parts of L. arabicumCitation53,Citation62. Finally, compound − ([M–H]− at m/z 323) presented no characteristic fragments in its MS spectra, and thus remained unidentified.
All in all, the present results suggest great differences between cultivated and wild growing L. barbarum leaves with regard to amount and composition of hydrocycinnamic acids and flavonol glycosides. As a peculiarity, on one side, a total number of 10 flavonoids were tentatively assigned in wild-growing L. barbarum in comparison with five in cultivar Lbb and only two in cultivar Lbe. On the other side, it was observed that cultivated plants contain significantly higher amounts of bioactive compounds than the wild growing ones. Nonetheless, concerning hydroxycinnamic acid derivatives, cultivated Goji leaves were richer, although the proportions of the different hydroxycinnamic acid derivatives varied, significantly.
Antioxidant activity assays
The antioxidant activities of the extracts were measured using two assays in the present study: Trolox equivalent antioxidant capacity (TEAC) and EPR (electron paramagnetic resonance) spectroscopy.
Trolox equivalents antioxidant capacity (TEAC) assay
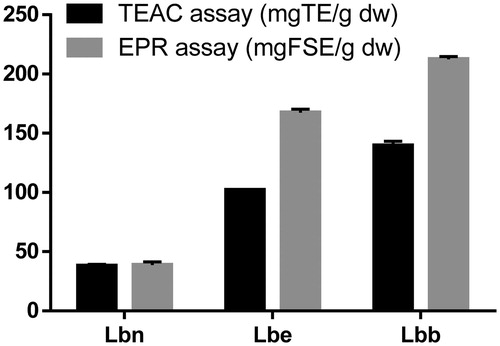
The TEAC assay is based on electron transfer reactions to evaluate radical scavenging activity of hydrophilic and lipophilic compounds or complex samplesCitation9. The antioxidant activity against the stable synthetic ABTS radical cation of the different Lycium leaves extracts is summarized in . Significant differences have been found in the antioxidant activities of the leaves from wild-growing plants and the two cultivars. The highest antioxidant activity was found for cultivar Lbb (140 mg TE/g dw), and the lowest in the sample coming from wild growing plants (38 mg TE/g dw). While the differences between the samples can be correlated with the amounts of the phenolic components, the highest antioxidant activity of cultivar Lbb can be more specifically related to the presence of flavonoid glycosides. Generally, the ability of flavonoids to be effective antioxidants depends on: the presence of hydrogen-/electron-donating substituents able to reduce free radicals, and the ability of the flavonoid to delocalize the unpaired electron leading to the formation of a stable phenoxyl radical. Moreover, it is generally accepted that the excellent antioxidant properties of flavonoids are due to the presence of catechol groups in the B-ringCitation14,Citation63.
Figure 4. Total antioxidant capacity of Lycium barbarum leaves measured with TEAC and EPR spectroscopy. Results were expressed as mg TE/g dw, and as mg FSE/g dw. The error bars are the result of a triple determination.
Previous data concerning the antioxidant activity of Lycium spp. were obtained by Abdennacer et al.Citation48 on Tunisian L. intricatum when using the DPPH, the TEAC, and the FRAP assay. These authors indicated that leaves of the investigated species possess a higher antioxidant activity than the fruits. Additionally, Donno et al.Citation18 investigated the antioxidant capacity of Goji berries cultivars grown in Italy. Nevertheless, it is not possible to compare the present results with those from the literature, because of the different assays, ways of expression, and/or type of sample (preparation).
Electron paramagnetic resonance spectroscopy (EPR)
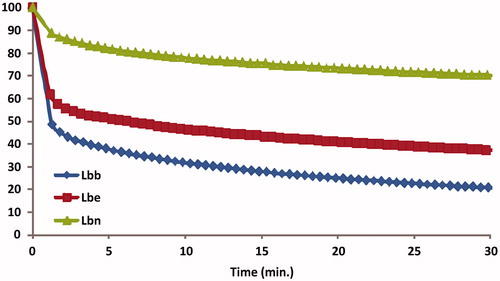
To support the results from the TEAC and the Folin-Ciocâlteu assays, all Lycium extracts were additionally analyzed using EPR with Fremy’s salt as a stable radical. EPR is a very common method to assess the antioxidant activity of different samples. The main advantage of this assay is the matrix-independent measurement of the reaction between potential antioxidants and radicals in an electro-magnetic field instead of the absorbance of lightCitation29,Citation64,Citation65. The degraded amount of Fremy’s salt after 30 min incubation time was 212 mg FSE/g dw for Lbb, 167 mg FSE/g dw for Lbe cultivar and just 39 mg FSE/g dw for the leaves coming from wild growing plant (). Additionally, the Lbb extract led to an 80% degradation of the Fremy’s salt, Lbe extract to 63%, while Lbn extract only 30%, as seen in . As already shown for the TEAC and the TPC, EPR results revealed a similar trend with regard to the antioxidant activity of the Lycium leaves extracts. The EPR is a common, well-characterized, established methodology for detecting radicals and their kinetics. Unfortunately, it is not so frequently used in combination with other assays to detect the overall antioxidant activity. Therefore, in this case, a comparison with the results of other researchers with regard to Lycium samples is lacking.
Figure 5. Degradation kinetics of the free radical Fremy’s salt by Lycium leaves.
Inhibitory activities against selected carbohydrate hydrolases, cholinesterases, and tyrosinase
Enzyme inhibitory assays have become a very prominent tool to assess the potential health benefits of herbals, dietary supplements, and nutraceuticals for the development of functional foodsCitation66,Citation67. Moreover, most usual assays involve key enzymes relevant in metabolic disorders such as diabetes mellitus (α-amylase, α-glucosidase)Citation68,Citation69, hypertension (angiotensin-converting enzyme), and Alzheimer’s disease (cholinesterases)Citation70,Citation71.
α-Amylase and α-glucosidase
The inhibition of α-amylase and α-glucosidase delays the digestion and absorption of carbohydrates and subsequently suppress postprandial hyperglycemiaCitation72. The α-amylase and α-glucosidase inhibitory activities of Lycium leaves extracts are listed in . The three extracts provided higher inhibitory activity on α-glucosidase than on α-amylase. In fact, the highest inhibitory potential on both enzymes was exhibited by Lbb with values of 5.38 (for α-glucosidase) and 0.26 (for α-amylase) mmol ACAE/g extract, leaves extracts from wild growing plants provided similar results for α-amylase and two times lower for α-glucosidase (2.25 mmol ACAE/g extract). As a matter of fact, the inhibitory activity of the Lbb and Lbe extracts on α-glucosidase might be related to their high contents in phenolic compounds, which has been demonstrated to possess ability to bind to active protein pocket of the proteinCitation73. Previous reports indicated that phenolic compounds have lower α-amylase inhibitory activity and a stronger inhibition activity against yeast α-glucosidaseCitation66. Moreover, chlorogenic acid and rutin, the two dominant compounds in Lbb and Lbe, were previously described as potent α-glucosidase inhibitors by Wang et al.Citation72 and Zhang et al.Citation74.
Table 3. The enzyme inhibitory effects of Lycium leaves.
Cholinesterases
To date, cholinesterase inhibitors are still the best available option for the treatment of patients suffering from Alzheimer’s disease, although currently used cholinesterase inhibitors, such as tacrine (9-amino-1,2,3,4-tetrahydroacridine), produce certain side effects such as gastrointestinal disturbances and cell toxicityCitation75. Enzyme inhibitors providing antioxidant properties are promising in the case of neurodegenerative diseases, due to their protective role against radical speciesCitation76. However, the extracts used in the present study did no show any activity against acetylcholinesterase, while Lbb and Lbe had a weak and Lbn a moderate inhibitory effect on butyrylcholinesterase. In fact, when comparing the results from the present study with other researchers’ results it seems that not always edible plants rich in phenolic compounds possess potent inhibitory effects on cholinesteraseCitation76,Citation77.
Tyrosinase
Tyrosinases are copper-containing polyphenol-oxidases that play an essential role in melanogenesis. They convert l-tyrosine to l-DOPA and oxidize l-DOPA to form dopachrome, which induces the production of melanin pigmentsCitation78. The present study found that all tested extracts inhibited the oxidation of l-DOPA catalyzed by mushroom tyrosinase. Lbe extract was the most active (16.81 mg KAE/g), followed by Lbb extract (12.84 mg KAE/g) and Lbn, which showed a very low activity (< 1 mg KAE/g). In fact, a positive correlation between total phenolic content and tyrosinase inhibition activity was shown in several studiesCitation76,Citation79. Moreover, chlorogenic acid, the dominant compound in Lbe and Lbb, was previously reported by Karioti et al.Citation80 as a potent tyrosine inhibitorCitation81.
However, an actual literature survey illustrated that enzyme inhibitory activities of L. barbarum leaves were not previously been reported.
Molecular modeling studies and dynamics
In the nutraceutical field, computational techniques have been successfully used for the prediction of ligand-target binding affinity and to better understand the molecular basis of the biological responses. In silico studies also provide additional insight into the possible mechanism of action and binding mode of active compounds against metabolic key enzymesCitation82.
The analysis of the interactions of butyrylcholinestarase revealed that chlorogenic acid penetrates the enzymatic pocket with the catechol function. This pose is stabilized by four hydrogen bonds and several other hydrophobic interactions. A similar path has been found for the interaction of chlorogenic acid with amylase and glucosidase, revealing an interesting ability to interact both with the catechol portion and with the glycoside moiety (). As already reported herein, a strong correlation between the inhibition of tyrosinase and the concentration of chlorogenic acid in the plant extracts has been found. In fact, the binding pose of chlorogenic acid in the enzymatic pocket of tyrosinase appears to be very effective, and the catechol ring is able to bind to at least to one copper atom with a coordination bond and interacts with several other amino acids present in the binding pocket by forming hydrogen bonds and aromatic π−π stacks ().
Figure 6. Binding interactions of the best pose of chlorogenic acid in complex with: α-glucosidase (A), butyrylcholinesterase (B), and α-amylase (C) (cut-off 4 Å).
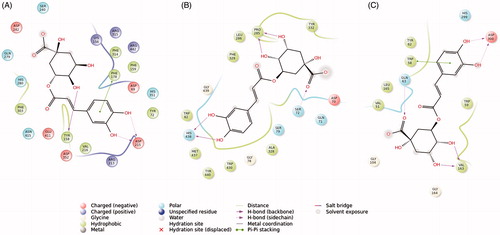
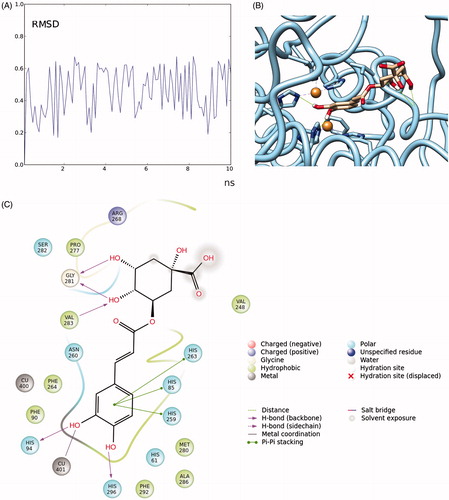
Figure 7. RMSD (in Angstrom) time-dependent plot of chlorogenic acid fluctuation docked to tyrosinase (A); close-up of the complex chlorogenic acid-tyrosinase (hydrogen bonds are reported as green lines) (B); details of the interactions formed by chlorogenic acid with the residues present in the binding pocket (cut-off = 4 Å from the ligand) (C).
For further investigating the stability of this pose, the binding mode of chlorogenic acid to tyrosinase was further evaluated by a molecular dynamics study. A molecular docking simulation (10 ns) was carried using the Amber biomolecular simulation programs.
The ligand partial charges were determined by Antechamber suite (AM1-BCC method). The system ligand-complex was prepared by tleap suite. General Amber force field (GAFF) parameters were assigned to the ligands and ff14SB to the proteins. The complexes were hydrated in a cubic water box of 20 Å, and the net charge of the system was neutralized by adding Na+ or Cl− ions to the complex. Then the complex was minimized for 10 000 steps of steepest descent followed by conjugate gradient. Then the molecular dynamic trajectory was run by using the CUDA version of pmemd (pmemd.cuda) implemented in Amber 14, and the simulations were analyzed for 10 ns, by recording one frame every 0.1 nsCitation83. The MD trajectories were analyzed by using UCSF ChimeraCitation84, the root mean square deviation (RMSD) fluctuation of chlorogenic acid (expressed in Angstroms) was plotted versus time (expressed in ns) (). The RMSD found during the simulation was in the range of ±0.4 Å, and the fluctuation was homogeneous in the time, thereby confirming that the pose found by the docking experiments between chlorogenic acid and tyrosinanse is stable, also the coordination bond of the Cu atom is maintained for the time of the simulation. Thus, one can hypothesize that chlorogenic acid is capable to enter in the enzymatic pocket of tyrosinase and chelate a Cu atom with the cathecol moiety of the molecule, while the other parts of the molecule contribute to stabilize the binding interactions.
The molecular modeling and dynamic experiments are in full agreement with the experimental data, in which chorogenic acid is a strong inhibitor of tyrosinase, as effectively binding to the enzymatic pocket of tyrosinase based on several hydrogen bonds and a direct coordination to the central Cu atom of the enzyme.
Antibacterial and antifungal activity
Testing the antibacterial and antifungal activities of plants extracts offers a scientific basis for their applications in food industry as natural preservativesCitation85,Citation86. The antimicrobial and the antifungal activity of the Lycium extracts were tested against a panel of nine bacteria (seven aerobic and two anaerobic strains) and five fungi, selected on the basis of their relevance for public health. Up to date, very little is reported concerning the bacterial inhibitory properties of leaves from the genus LyciumCitation26,Citation87,Citation88, while information referring to its antifungal properties is not available. Listeria monocytogenes and Staphylococcus aureus were the most sensitive strains towards Lbe and Lbb extracts with similar values of MIC (0.0019 mg/mL) and MBC (0.0038 mg/mL), respectively (). These results are in line with previous findings of Terauchi et al.Citation87 who reported that both Gram-positive and Gram-negative bacteria were sensitive towards tea brewed from leaves of Lycium chinense. The antibacterial activity of chlorogenic acid, the main phenolic compound in Lbb and Lbe, has already been demonstrated in various studies. According to Lou et al.Citation89, chlorogenic acid induced lethal effect on both Gram-positive and Gram-negative bacteria by provoking irreversible permeability changes in the cell membrane, causing the cells to lose the ability to maintain membrane potential. As a result, the antimicrobial activity of Lycium leaves could be attributed at least in part to chlorogenic acid. Nevertheless, other constituents should be taken into consideration for the total activity, e.g. the high amounts of rutin or further flavonoid glycosidesCitation90.
Table 4. Antimicrobial activity of the three Lycium leaves extracts.
However, the most resistant strains were Enterococcus faecalis and F. nucleatum with MICs = 0.12 mg/mL and MBCs = 0.25 mg/mL, as shown in . Concerning the antifungal activity, Candida parapsilopsis provided the highest sensitivity to the Lbn extract with MIC = 0.02 mg/mL and MFC = 0.03 mg/mL. Moreover, Candida albicans and Penicillium funiculosum were similarly susceptible to the inhibitory (MICs = 0.031 mg/mL) and fungicidal effects (MFCs = 0.062 mg/mL) of Lbn extract. Nonetheless, the most resistant fungal strains were Aspergillus flavus and Aspergillus niger towards Lbb extract with MICs = 0.12 mg/mL and MFCs = 0.25 mg/mL, respectively.
Antimutagenicity testing
Antimutagens from natural dietary sources that can counteract the promutagenic and carcinogenic effects of mutagens present increased significanceCitation91. Moreover, current research suggests that the use of antimutagens in daily diets can be an effective method for preventing cancer and genetic diseasesCitation92. The Ames test is a generally accepted short-term bacterial assay for identifying substances that can produce genetic damage that leads to mutations. The test uses Salmonella strains with preexisting mutations that leave the bacteria unable to synthesize the required amino acid, histidine, and, therefore, unable to grow and form colonies in its absence. New mutations at the site of these pre-existing mutations, or nearby in the genes, can restore the gene’s function and allow the cells to synthesize histidine. These newly mutated cells can grow in the absence of histidine and form coloniesCitation45.
In this study, the mutagenicity of Lycium leaves extracts against S. typhimurium TA 98 and TA 100, both with and without metabolic activation was tested by comparing the numbers of induced revertants and spontaneously revertants. According to , TA98 and TA100 strains did not increase in the number of revertant colonies compared with the negative control when the bacteria was treated with Lycium extracts at 5000 µg/plate concentration both with and without metabolic activation enzymes (S9), indicating the absence of any mutagenic activity.
Table 5. Antimutagenic properties of Lycium leaves extracts on Salmonella typhimurium TA 98 and TA 100.
As reported in , tested extracts displayed protective effects against 2-AA induced mutagenicity. According to Negi et al.Citation93, a value smaller than 25% inhibition of the mutagen activity indicates a weak or non-antimutagenic effect, a moderate effect when the value is between 25% and 40% and strong antimutagenic potential when the value is greater than 40%. In the present study, all extracts showed strong inhibitory effects against the direct-acting mutagen 2-AA in both test-strains with values ranging between 83.2% for Lbe and 88% for Lbn (strain TA 98); 72% for Lbe and 74.2% for Lbb (strain TA100), respectively. As the extracts plus bacterial strains treated plate did not produce any change in the background growth of bacteria with respect to the plate used to detect the spontaneous revertant, the antimutagenic activity of extract cannot be correlated to its toxicity to bacterial strains.
The antimutagenic activity of the extracts is again related to their constituents, in particular to the major phenolic compounds chlorogenic acid and flavonoid glycosides. In fact, chlorogenic acid and flavonoids have been already suggested as potent antigenotoxic agentsCitation94,Citation95. Therefore, taking into consideration the concentration of these compounds in the extracts, it can be suggested that they could be an essential part of the antimutagenic activity of Lycium leaves.
Conclusions
In the present study, the bioactive composition, antioxidant, enzyme-inhibitory, antimicrobial, and antimutagenic properties of two selected Goji cultivars in comparison with leaves from wild-growing plants were evaluated. The present study showed significant variations in the chemical composition between leaves of cultivated and wild-growing Goji plants. The results showed that leaves from cultivated plants contain higher amounts of chlorogenic acids and flavonoid glycosides than wild-growing plants, but the latter had a more diversified phenolic profile. In particular, cultivar Erma, containing the highest amount of chlorogenic acid, showed a strong tyrosinase-inhibitory effect. Furthermore, the interaction between chlorogenic acid and this enzyme was evaluated by molecular docking studies. The antimicrobial status of the studied extracts presented potent activity against the Gram-positive bacteria L. monocytogenes and S. aureus for cultivated leaves extracts, and a moderate inhibition for anaerobic strains. Nevertheless, wild-growing leaves presented potent activity against C. parapsilosis, and cv. Erma on P. funiculosum. The exhibited antimutagenic activity of the extracts might be ascribed to their constituents, in particular to the major phenolic compounds chlorogenic acid and flavonoid glycosides. To the best of our knowledge, this is the first comparison describing thoroughly the phytochemical composition and further health-promoting effects of leaves from selected L. barbarum cultivars and wild-growing plants. The results indicate that cultivated L. barbarum leaves have the potential to be marketed as ingredients for functional beverages and to be used as a valuable source of bioactive compounds in further foods or health-promoting formulations.
Acknowledgements
The authors are also grateful to Mr. Emeric Kolbaszer (Gojiland Romania) for providing the plant material from cultivar Erma and to Dr. Mircea Moca for providing the plant material from cultivar Biglifeberry.
Disclosure statement
Andrei Mocan was financed by a fellowship supported by the German Federal Environmental Foundation (DBU). He is currently financed by a project under the frame of European Social Fund, Human Resources Development Operational Program 2007–2013, project no. POSDRU/159/1.5/S/136893.
References
- Abuajah CI, Ogbonna AC, Osuji CM. Functional components and medicinal properties of food: a review. J Food Sci Technol 2014;52:2522–9.
- Mašković PZ, Diamanto LD, Vujic JM, et al. Onosma aucheriana: a source of biologically active molecules for novel food ingredients and pharmaceuticals. J Funct Foods 2015;19:479–86.
- Lapenna S, Gemen R, Wollgast J, et al. Assessing herbal products with health claims. Crit Rev Food Sci Nutr 2015;55:1918–28.
- Atanasov AG, Waltenberger B, Pferschy-Wenzig E-M, et al. Discovery and resupply of pharmacologically active plant-derived natural products: a review. Biotechnol Adv (Elsevier BV) 2015;33:1582–614.
- Oroian M, Escriche I. Antioxidants: characterization, natural sources, extraction and analysis. Food Res Int Elsevier B.V 2015;74:10–36.
- Shahidi F, Zhong Y. Measurement of antioxidant activity. J Funct Foods 2015;18:757–81.
- Alshikh N, de Camargo AC, Shahidi F. Phenolics of selected lentil cultivars: antioxidant activities and inhibition of low-density lipoprotein and DNA damage. J Funct Foods (Elsevier Ltd) 2015;18:1022–38.
- Pereira DM, Valentão P, Pereira JA, Andrade PB. Phenolics: from chemistry to biology. Molecules 2009;14:2202–11.
- de Camargo AC, Regitano-d’Arce MAB, Gallo CR, Shahidi F. Gamma-irradiation induced changes in microbiological status, phenolic profile and antioxidant activity of peanut skin. J Funct Foods (Elsevier Ltd) 2015;12:129–43.
- Hamaguchi T, Ono K, Murase A, Yamada M. Phenolic compounds prevent Alzheimer’s pathology through different effects on the amyloid-beta aggregation pathway. Am J Pathol Am Soc Invest Pathol 2009;175:2557–65.
- Xiao J. Natural polyphenols and diabetes: understanding their mechanism of action. Curr Med Chem 2014;21:1–2.
- Xiao J, Högger P. Dietary polyphenols and type 2 diabetes: current insights and future perspectives. Curr Med Chem 2015;22:23–38.
- Safer AM. Hepatotoxicity induced by the anti-oxidant food additive, butylated hydroxytoluene (BHT), in rats: an electron microscopical study. Histol Histopathol 1999;14:391–406.
- Shahidi F, Ambigaipalan P. Phenolics and polyphenolics in foods, beverages and spices: antioxidant activity and health effects – a review. J Funct Foods 2015;18:820–97.
- Fukuda T, Yokoyama J, Ohashi H. Phylogeny and biogeography of the genus Lycium (Solanaceae): inferences from chloroplast DNA sequences. Mol Phylogenet Evol 2001;19:246–58.
- Amagase H, Farnsworth NR. A review of botanical characteristics, phytochemistry, clinical relevance in efficacy and safety of Lycium barbarum fruit (Goji). Food Res Int (Elsevier Ltd) 2011;44:1702–17.
- Potterat O. Goji (Lycium barbarum and L. chinense): phytochemistry, pharmacology and safety in the perspective of traditional uses and recent popularity. Planta Med 2010;76:7–19.
- Donno D, Beccaro GL, Mellano MG, et al. Goji berry fruit (Lycium spp.): antioxidant compound fingerprint and bioactivity evaluation. J Funct Foods (Elsevier Ltd) 2015;18:1070–85.
- Rotar AM, Vodnar DC, Bunghez F, et al. Effect of Goji Berries and honey on lactic acid bacteria viability and shelf life stability of yoghurt. Not Bot Horti Agrobo 2015;43:196–203.
- Yang RF, Zhao C, Chen X, et al. Chemical properties and bioactivities of Goji (Lycium barbarum) polysaccharides extracted by different methods. J Funct Foods (Elsevier Ltd) 2015;17:903–9.
- Chen C, Shao Y, Li Y, Chen T. Trace elements in Lycium barbarum L. Leaves by inductively coupled plasma mass spectrometry after microwave assisted digestion and multivariate analysis. Spectrosc Lett 2015;48:775–80.
- Gong G, Fan J, Sun Y, et al. Isolation, structural characterization, and antioxidativity of polysaccharide LBLP5-A from Lycium barbarum leaves. Process Biochem (Elsevier Ltd) 2016;51:314–24.
- Mencinicopschi IC, Bălan V, Manole CG. Lycium barbarum L. – a new species with adaptability potential in bucharest’s area. Sci Pap Ser a Agron 2012;LV:361–4.
- Mencinicopschi IC, Bălan V. Growth and development characteristics of plant individuals from two Lycium barbarum L. varieties. Sci Pap Ser A: Agron 2013;LVI:490–7.
- Dzugalov H, Lichev V, Yordanov A, et al. First results of testing Goji berry (Lycium barbarum L.) in Plovdiv region, Bulgaria. Sci Pap Ser B: Hortic 2015;LIX:47–50.
- Mocan A, Vlase L, Vodnar DC, et al. Polyphenolic content, antioxidant and antimicrobial activities of Lycium barbarum L. and Lycium chinense Mill. Leaves. Molecules 2014;19:10056–73.
- Dulf FV, Vodnar DC, Dulf E-H, Toşa IM. Total phenolic contents, antioxidant activities, and lipid fractions from Berry Pomaces obtained by solid-state fermentation of two Sambucus species with Aspergillus niger. J Agric Food Chem 2015;63:3489–500.
- Simirgiotis MJ. Antioxidant capacity and HPLC-DAD-MS profiling of chilean peumo (Cryptocarya alba) fruits and comparison with german peumo (Crataegus monogyna) from Southern Chile. Molecules 2013;18:2061–80.
- Barakat H, Rohn S. Effect of different cooking methods on bioactive compounds in vegetarian, broccoli-based bars. J Funct Foods (Elsevier Ltd) 2014;11:407–16.
- Rohn S, Rawel HM, Kroll J. Antioxidant activity of protein-bound quercetin. J Agric Food Chem 2004;52:4725–9.
- Moussa-Ayoub TE, El-Hady EAA, Omran HT, et al. Influence of cultivar and origin on the flavonol profile of fruits and cladodes from cactus Opuntia ficus-indica. Food Res Int 2014;64:864–72.
- Zengin G, Sarikurkcu C, Aktumsek A, et al. A comprehensive study on phytochemical characterization of Haplophyllum myrtifolium Boiss. endemic to Turkey and its inhibitory potential against key enzymes involved in Alzheimer, skin diseases and type II diabetes. Ind Crops Prod (Elsevier BV) 2014;53:244–51.
- Zengin G, Uysal A, Gunes E, Aktumsek A. Survey of phytochemical composition and biological effects of three extracts from a wild plant (Cotoneaster nummularia Fisch. et Mey.): a potential source for functional food ingredients and drug formulations. PLoS One 2014;9:e113527.
- Lazarova I, Zengin G, Bender O, et al. A comparative study of Bulgarian and Turkish Asphodeline lutea root extracts: HPLC-UV profiles, enzyme inhibitory potentials and anti-proliferative activities against MCF-7 and MCF-10A cell lines. J Funct Foods (Elsevier Ltd) 2015;15:254–63.
- Zengin G. A study on in vitro enzyme inhibitory properties of Asphodeline anatolica: new sources of natural inhibitors for public health problems. Ind Crops Prod 2016;83:39–43. (March):
- Nachon F, Carletti E, Ronco C, et al. Crystal structures of human cholinesterases in complex with huprine W and tacrine: elements of specificity for anti-Alzheimer’s drugs targeting acetyl-and butyryl-cholinesterase. Biochem J 2013;453:393–9.
- Zhuo H, Payan F, Qian M. Crystal structure of the pig pancreatic α-amylase complexed with ρ-nitrophenyl-α-d-maltoside-flexibility in the active site. Protein J 2004;23:379–87.
- Yamamoto K, Miyake H, Kusunoki M, Osaki S. Steric hindrance by 2 amino acid residues determines the substrate specificity of isomaltase from Saccharomyces cerevisiae. J Biosci Bioeng: Soc Biotechnol Jpn 2011;112:545–50.
- Ismaya WT, Rozeboom J, Weijn A, et al. Crystal structure of Agaricus bisporus mushroom Tyrosinase: identity of the tetramer subunits and interaction with tropolone. Biochemistry 2011;50:5477–86.
- Verdonk ML, Cole JC, Hartshorn MJ, et al. Improved protein–ligand docking using GOLD. Proteins Struct Funct Genet 2003;52:609–23.
- Case DA, Berryman JT, Betz RM, et al. AMBER 2015. San Francisco: University of California; 2015.
- Mocan A, Vodnar D, Vlase L, et al. Phytochemical characterization of Veronica officinalis L., V. teucrium L. and V. orchidea Crantz from Romania and their antioxidant and antimicrobial properties. Int J Mol Sci 2015;16:21109–27.
- Mocan A, Vlase L, Arsene AL, et al. HPLC/MS analysis of caffeic and chlorogenic acids from three Romanian veronica species and their antioxidant and antimicrobial properties. Farmacia 2015;63:890–6.
- Maron DM, Ames BN. Revised methods for the Salmonella mutagenicity test. Mutat Res Mutagen Relat Subj 1983;113:173–215.
- Mortelmans K, Zeiger E. The Ames Salmonella/microsome mutagenicity assay. Mutat Res – Fundam Mol Mech Mutagen 2000;455:29–60.
- Ong TM, Whong WZ, Stewart J, Brockman HE. Chlorophyllin: a potent antimutagen against environmental and dietary complex mixtures. Mutat Res Lett 1986;173:111–15.
- Dong JZ, Lu DY, Wang Y. Analysis of flavonoids from leaves of cultivated Lycium barbarum L. Plant Foods Hum Nutr 2009;64:199–204.
- Abdennacer B, Karim M, Yassine M, et al. Determination of phytochemicals and antioxidant activity of methanol extracts obtained from the fruit and leaves of Tunisian Lycium intricatum Boiss. Food Chem (Elsevier Ltd) 2015;174:577–84.
- Simirgiotis MJ, Bórquez J, Schmeda-Hirschmann G. Antioxidant capacity, polyphenolic content and tandem HPLC-DAD-ESI/MS profiling of phenolic compounds from the South American berries Luma apiculata and L. chequén. Food Chem (Elsevier Ltd) 2013;139:289–99.
- Bajalan I, Mohammadi M, Alaei M, Pirbalouti AG. Total phenolic and flavonoid contents and antioxidant activity of extracts from different populations of lavandin. Ind Crops Prod (Elsevier BV) 2016;87:255–60.
- Bilgin M, Şahin S. Effects of geographical origin and extraction methods on total phenolic yield of olive tree (Olea europaea) leaves. J Taiwan Inst Chem Eng 2013;44:8–12.
- Kosar M, Altintas A, Kirimer N, Baser KHC. Determination of the free radical scavenging activity of Lycium extracts. Chem Nat Compd 2003;39:531–5.
- Yao X, Peng Y, Xu L-J, et al. Phytochemical and biological studies of Lycium medicinal plants. Chem Biodivers 2011;8:976–1010.
- Dong JZ, Gao WS, Lu DY, Wang Y. Simultaneous extraction and analysis of four polyphenols from leaves of Lycium barbarum L. J Food Biochem 2011;35:914–31.
- Clifford M, Johnston K, Knigh S, Kuhnert N. Hierarchical scheme for LC-MSn identification of chlorogenic acids. J Agric Food Chem 2003;51:2900–11.
- Clifford MN, Knight S, Kuhnert N. Discriminating between the six isomers of dicaffeoylquinic acid by LC-MS(n). J Agric Food Chem 2005;53:3821–32.
- Barros L, Dueñas M, Carvalho AM, et al. Characterization of phenolic compounds in flowers of wild medicinal plants from Northeastern Portugal. Food Chem Toxicol (Elsevier Ltd) 2012;50:1576–82.
- Rodrigues S, Calhelha RC, Barreira JCM, et al. Crataegus monogyna buds and fruits phenolic extracts: growth inhibitory activity on human tumor cell lines and chemical characterization by HPLC-DAD-ESI/MS. Food Res Int (Elsevier Ltd) 2012;49:516–23.
- Vallejo F, Tomás-Barberán FA, Ferreres F. Characterization of flavonols in broccoli (Brassica oleracea L. var. italica) by liquid chromatography-UV diode-array detection-electrospray ionization mass spectrometry. J Chromatogr A 2004;1054:181–93.
- Neugart S, Rohn S, Schreiner M. Identification of complex, naturally occurring flavonoid glycosides in Vicia faba and Pisum sativum leaves by HPLC-DAD-ESI-MSn and the genotypic effect on their flavonoid profile. Food Res Int (Elsevier Ltd) 2015;76:114–21.
- Terauchi M, Kanamori H, Nobuso M, et al. Detection and determination of antioxidative components in Lycium chinense. Nat Med 1997;51:387–91.
- Cherouana S, Touil A, Rhouati S. Two flavonoid glycosides from Lycium arabicum. Chem Nat Compd 2013;49:930–1.
- Shahidi F, Naczk M. Phenolics in food and nutraceuticals. In: Shahidi F, Naczk M, eds. Vol. 1. New York: CRC Press Taylor & Francis Group; 2004.
- John JA, Shahidi F. Phenolic compounds and antioxidant activity of Brazil nut (Bertholletia excelsa). J Funct Foods (Elsevier Ltd) 2010;2:196–209.
- Rohn S, Kroh LW. Electron spin resonance-a spectroscopic method for determining the antioxidative activity. Mol Nutr Food Res 2005;49:898–907.
- Apostolidis E, Li L, Lee C, Seeram NP. In vitro evaluation of phenolic-enriched maple sirup extracts for inhibition of carbohydrate hydrolyzing enzymes relevant to type 2 diabetes management. J Funct Foods (Elsevier Ltd) 2011;3:100–6.
- Chen L, Kang Y-H. In vitro inhibitory effect of oriental melon (Cucumis melo L. var. makuwa Makino) seed on key enzyme linked to type 2 diabetes. J Funct Foods 2013;5:981–6.
- Bahadori MB, Valizadeh H, Asghari B, et al. Chemical composition and antimicrobial, cytotoxicity, antioxidant and enzyme inhibitory activities of Salvia spinosa L. J Funct Foods (Elsevier Ltd) 2015;18:727–36.
- Fu C, Yang X, Lai S, et al. Structure, antioxidant and α-amylase inhibitory activities of longan pericarp proanthocyanidins. J Funct Foods (Elsevier Ltd) 2015;14:23–32.
- Seo WD, Kim JY, Ryu HW, et al. Identification and characterization of coumarins from the roots of Angelica dahurica and their inhibitory effects against cholinesterase. J Funct Foods (Elsevier Ltd) 2013;5:1421–31.
- Yoon NY, Lee SH, Yong-Li, Kim SK. Phlorotannins from Ishige okamurae and their acetyl-and butyrylcholinesterase inhibitory effects. J Funct Foods (Elsevier Ltd) 2009;1:331–5
- Wang T, Li X, Zhou B, et al. Anti-diabetic activity in type 2 diabetic mice and α-glucosidase inhibitory, antioxidant and anti-inflammatory potential of chemically profiled pear peel and pulp extracts (Pyrus spp.). J Funct Foods (Elsevier Ltd) 2015;13:276–88.
- Shobana S, Sreerama YN, Malleshi NG. Composition and enzyme inhibitory properties of finger millet (Eleusine coracana L.) seed coat phenolics: mode of inhibition of a-glucosidase and pancreatic amylase. Food Chem (Elsevier Ltd) 2009;115:1268–73.
- Zhang Z, Luo A, Zhong K, et al. α-Glucosidase inhibitory activity by the flower buds of Lonicera japonica Thunb. J Funct Foods (Elsevier Ltd) 2013;5:1253–9.
- Zengin G, Locatelli M, Ceylan R, Aktumsek A. Anthraquinone profile, antioxidant and enzyme inhibitory effect of root extracts of eight Asphodeline taxa from Turkey: can Asphodeline roots be considered as a new source of natural compounds? J Enzyme Inhib Med Chem 2016;31:754–9.
- Sarikurkcu C, Tepe B. Biological activity and phytochemistry of firethorn (Pyracantha coccinea M.J. Roemer). J Funct Foods (Elsevier Ltd) 2015;19:669–75.
- Borowiec K, Szwajgier D, Targoński Z, et al. Cholinesterase inhibitors isolated from bilberry fruit. J Funct Foods 2014;11:313–21.
- Zengin G, Uysal S, Ceylan R, Aktumsek A. Phenolic constituent, antioxidative and tyrosinase inhibitory activity of Ornithogalum narbonense L. from Turkey: a phytochemical study. Ind Crops Prod 2015;70:1–6.
- Uysal S, Aktumsek A. A phytochemical study on Potentilla anatolica: an endemic Turkish plant. Ind Crops Prod (Elsevier BV) 2015;76:1001–7.
- Karioti A, Protopappa A, Megoulas N, Skaltsa H. Identification of tyrosinase inhibitors from Marrubium velutinum and Marrubium cylleneum. Bioorg Med Chem 2007;15:2708–14.
- Iwai K, Kishimoto N, Kakino Y, et al. In vitro antioxidative effects and tyrosinase inhibitory activities of seven hydroxycinnamoyl derivatives in green coffee beans. J Agric Food Chem 2004;52:4893–8.
- Gidaro MC, Astorino C, Petzer A, et al. Kaempferol as selective human MAO-A inhibitor: analytical detection in Calabrian red wines, biological and molecular modeling studies. J Agric Food Chem 2016;64:1394–400.
- Pettersen EF, Goddard TD, Huang CC, et al. UCSF Chimera-a visualization system for exploratory research and analysis. J Comput Chem (Wiley Online Library) 2004;25:1605–12.
- Mocan A, Zengin G, Crişan G, Mollica A. Enzymatic assays and molecular modeling studies of Schisandra chinensis lignans and phenolics from fruit and leaf extracts. J Enzyme Inhib Med Chem 2016. [Epub ahead of print]. doi: https://doi.org/http://dx.doi.org/10.1080/14756366.2016.1222585.
- Caleja C, Barros L, Antonio AL, et al. Development of a functional dairy food: exploring bioactive and preservation effects of chamomile (Matricaria recutita L.). J Funct Foods (Elsevier Ltd) 2015;16:114–24.
- Caleja C, Barros L, Antonio AL, et al. Foeniculum vulgare Mill. As natural conservation enhancer and health promoter by incorporation in cottage cheese. J Funct Foods 2015;12:428–38.
- Terauchi M, Kanamori H, Nobuso M, et al. Antimicrobial components in leaves of Lycium chinense Mill. J Food Hyg Soc Japan 1998;39:399–405.
- Ali-Shtayeh MS, Yaghmour RMR, Faidi YR, et al. Antimicrobial activity of 20 plants used in folkloric medicine in the Palestinian area. J Ethnopharmacol 1998;60:265–71.
- Lou Z, Wang H, Zhu S, et al. Antibacterial activity and mechanism of action of chlorogenic acid. J Food Sci 2011;76:M398–403.
- Arima H, Ashida H, Danno G. Rutin-enhanced antibacterial activities of flavonoids against Bacillus cereus and Salmonella enteritidis. Biosci Biotechnol Biochem 2002;66:1009–14.
- Kumar S, Gautam S, Sharma A. Identification of antimutagenic properties of anthocyanins and other polyphenols from Rose (Rosa centifolia) petals and tea. J Food Sci 2013;78:948–54.
- Zhao X, Wang Q, Li G, et al. In vitro antioxidant, anti-mutagenic, anti-cancer and anti-angiogenic effects of Chinese Bowl tea. J Funct Foods (Elsevier Ltd) 2014;7:590–8.
- Negi PS, Jayaprakasha GK, Jena BS. Antioxidant and antimutagenic activities of pomegranate peel extracts. Food Chem 2003;80:393–7.
- Abraham SK, Schupp N, Schmid U, Stopper H. Antigenotoxic effects of the phytoestrogen pelargonidin chloride and the polyphenol chlorogenic acid. Mol Nutr Food Res 2007;51:880–7.
- Anderson D, Dobrzyńska MM, Başaran N, et al. Flavonoids modulate Comet assay responses to food mutagens in human lymphocytes and sperm. Mutat Res – Fundam Mol Mech Mutagen 1998;402:269–77.