
Abstract
A novel proton transfer compound (SMHABT)+(HDPC)− (1) obtained from 2-amino-6-sulfamoylbenzothiazole (SMABT) and 2,6-pyridinedicarboxylic acid (H2DPC) and its Fe(III), Co(II), Ni(II) complexes (2–4), and Fe(II) complex of SMABT (5) have been prepared and characterized by spectroscopic techniques. Additionally, single crystal X-ray diffraction techniques were applied to complexes (2–4). All complexes (2–4) have distorted octahedral conformations and the structure of 5 might be proposed as octahedral according to spectral and analytical results. All compounds, including acetazolamide (AAZ) as the control compound, were also evaluated for their in vitro inhibition effects on human hCA I and hCA II for their hydratase and esterase activities. The synthesized compounds have remarkable inhibitory activities on hCA I and hCA II. Especially, the inhibition potentials of the salt and the metal complexes (1–5) are comparable with AAZ. Inhibition data have been analyzed by using a one-way analysis of variance for multiple comparisons (p < .0001).
Introduction
The sulfonamide and benzothiazole derivatives constitute an important class of drugs, with several types of pharmacological agents possessing, among others, antibacterial, anticonvulsant, antiinflammatory, antitubercular, therapeutic, protease, and carbonic anhydrase inhibitory effects [Citation1,Citation2]. Carbonic anhydrase (CA, EC 4.2.1.1) is a metalloenzyme containing Zn2+ ion in its active site to catalyze the simple but physiologically important reversible reaction of carbon dioxide to bicarbonate ion and proton [Citation3–6]. This reaction also provides the equilibrium of some ions, such as sodium ion, calcium ion, and chloride ion [Citation7,Citation8]. Therefore, carbonic anhydrases take part in many physiological processes [Citation9–11]. These isozymes are found in many organisms throughout the phylogenetic tree [Citation12]. Sixteen of these isozymes are expressed in humans, and 13 of them are catalytically active [Citation13,Citation14]. Among the human CAs, hCA I, and hCA II are cytosolic, and hCA II is located in human eye, erythrocytes, gastrointestinal tract, and kidney [Citation15]. Bicarbonate ion, which is produced by carbonic anhydrases, has an important role in the formation of aqueous humor. This fluid is produced in the eye’s posterior chamber and is transferred into anterior chamber through the space between lens and iris. Later, aqueous humor moves through trabecular meshwork and Schlemm’s canal. Thus, the cycle is completed, and the intraocular pressure is kept in balance. But some structural defects, such as blockage in trabecular meshwork and Schlemm’s canal, or the smoother of the iris, prevent the flow of aqueous humor resulting from incompletion of the cycle and accumulating of the liquid in the posterior chamber, and causing intraocular pressure (IOP) elevation [Citation16]. Glaucoma is a group of diseases characterized by the gradual loss of visual field due to an elevation in intraocular pressure (IOP) [Citation15,Citation17,Citation18] CA inhibitors (CAIs) decrease IOP by reducing the rate of bicarbonate formation and thus the secretion of the aqueous humor from ciliary body [Citation18,Citation19]. Some systemic and topical CAIs used clinically have effective inhibition effects on the enzyme, but they have also many side effects, such as weight loss, fatigue, blurred vision, depression, metallic taste, and burning of the eye [Citation15,Citation18,Citation20,Citation21]. This situation clearly demonstrates the need for the development of new carbonic anhydrase inhibitors. In the last years, 2-aminobenzothiazole derivatives and their proton transfer salts and metal complexes have been studied as carbonic anhydrase inhibitors by our group [Citation22–25].
In this study, 2-amino-6-sulfamoylbenzothiazole (SMABT) according to literature [Citation26] and proton transfer compound (SMHABT)+(HDPC)− (1) and its Fe(III), Co(II), and Ni(II) complexes (2–4) and Fe(II) complex of SMABT (5) have been prepared and characterized by elemental, spectral (1H-NMR, 13C-NMR, IR and UV-Vis), and thermal analyses, as well as using magnetic measurement and molar conductivity techniques. Single crystal X-ray diffraction techniques were applied to complexes 2–4. In order to compare the inhibition data of newly synthesized compounds, 1–4, the simple metal complexes of H2DPC [Citation27] and Fe(II) complexes of SMABT (5) have been prepared. Furthermore, we have investigated the potential use of these compounds as new inhibitors of hCA isoenzymes in the treatment of glaucoma.
Experimental section
General methods and materials
All chemicals used were analytical reagents and were commercially purchased from Aldrich. Elemental analyses for C, H, N, and S were performed on Elementar Vario III EL (Hanau, Germany) and Fe, Co, and Ni were detected with Perkin Elmer Optima 4300 DV ICP-OES (Perkin Elmer Inc., Wellesley, MA). 1H and 13C-NMR spectra were recorded with Bruker DPX FT NMR (500 MHz) spectrometer (Karlsruhe, Germany) (SiMe4 as internal standard and 85% H3PO4 as an external standard). FT-IR spectra were recorded in the 4000–400 cm−1 region with Bruker Optics, Vertex 70 FT-IR spectrometer using ATR techniques (Ettlingen, Germany). Thermal analyses were performed on Pelkin Elmer SII Exstar 6000 TG/DTA 6300 model (SII Nanotechnology, Japan) using platinum crucible with 10-mg sample. Measurements were taken in the static air within a 30–900 °C temperature range. The UV–Vis spectra were obtained for DMSO solution of the compounds (10−3 M) with a SHIMADZU UV-2550 spectrometer (Shimadzu Co, Kyoto, Japan) in the range of 200–900 nm. Magnetic susceptibility measurements at room temperature were performed using a Sherwood Scientific Magway MSB MK1 model magnetic balance (Sherwood Scientific Ltd, Cambridge, UK) by the Gouy method using Hg[Co(SCN)4] as calibrant. The molar conductance of the compounds were determined in water/ethanol (1:1) and in DMSO (10−3 M) at room temperature using a WTW Cond 315i/SET Model conductivity meter (Weilheim, Germany).
Synthesis of 1 and metal complexes (2–5)
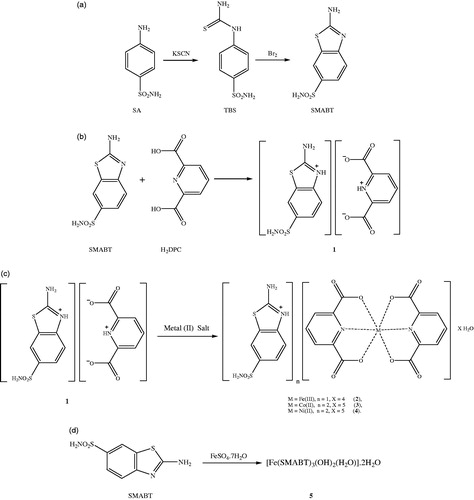
SMABT as the starting compound was synthesized from sulfanilamide (SA) and 4-thioureidobenzenesulfonamide (TBS) according to literature [Citation27]. 1H NMR and 13C NMR of the compound are given in Supplementary Table S1 and other spectroscopic data can be found in Supplementary Tables S2 and S4 and Supplementary Figures S1 and S2.
A solution of SMABT (1.145 g, 5 mmol) in 25 mL ethanol was added to the solution of H2DPC (0.836 g, 5 mmol) in 25 mL ethanol. The mixture was refluxed for 3 h and then was cooled to room temperature. The reaction mixture was kept at room temperature for 3 h to give white solid of 1 (1.783 g, 90% yield).
A solution of 1 mmol metal(II) salt [0.278 g FeSO4.7H2O or 0.249 g Co(CH3COO)2.4H2O or 0.248 g Ni(CH3COO)2.4H2O] in water (10 mL) was added dropwise to the solution of 1 (0.519 g, 1 mmol) for 2–4 or was added dropwise to the solution of SMABT (0.229 g, 1 mmol) for 5 in water/ethanol (1:1) (20 mL) with stirring at room temperature for two hours to complete the reaction. On filtration the reaction mixture, the solution was kept at room temperature for 2 weeks to give yellow crystalline solid for 2 (0.275 g, %80 yield) or brown crystalline solid for 3 (0.399 g, %85 yield) or green crystalline solid for 4 (0.329 g, %70 yield) or orange amorphous solid for 5 (0.285 g, 62% yield) (). The single crystals of complexes 2–4 suitable for X-ray diffraction were separated and washed with EtOH/water (1:1).
Figure 1. Syntheses of all compounds (a for SMABT and b for 1 and c for 2–4 and d for 5).
Anal. Calcd. for 1 (C14H12N4O6S2): C, 42.42%; H, 3.05%; N, 14.13%; S, 16.18%. Found: C, 42.45%; H, 3.00%; N, 14.15%; S, 16.15%; for 2 (C21H22N5O14S2Fe): C, 36.64%; H, 3.22%; N, 10.17%; S, 9.32%; Fe, 8.11%. Found: C, 36.65%; H, 3.20%; N, 10.20%; S, 9.30%; Fe, 8.10%; for 3 (C28H32N8O17S2Co): C, 35.78%; H, 3.43%; N, 11.92%; S, 13.65%; Co, 6.27%. Found: C, 35.75%; H, 3.40%; N, 11.95%; S, 13.67%; Co, 6.25%.; for 4 (C28H32N8O17S2Ni): C, 35.79%; H, 3.43%; N, 11.93%; S, 13.65%; Ni, 6.25%. Found: C, 35.80%; H, 3.40%; N, 11.90%; S, 13.62%; Ni, 6.20%; for 5 (C21H29N9O11S6Fe): C, 30.32%; H, 3.51%; N, 15.16%; S, 23.13%; Fe, 9.71%. Found: C, 30.30%; H, 3.56%; N, 15.20%; S, 23.10%; Fe, 9.65%.
X-ray data collection and structure refinement
The crystal and instrumental parameters used in the unit-cell determination, and data collection are summarized in for the compounds 2–4. Crystallographic data of 2–4 were recorded on a Bruker Kappa APEX II CCD area-detector X-ray diffractometer employing plane graphite monochromatized with MoKα radiation (λ = 0.71073 Å), using ω-2θ scan mode. The empirical absorption corrections were applied by multi-scan via Bruker, SADABS software [Citation28]. The structures were solved by the direct methods and subsequently completed by difference Fourier recycling. All non-hydrogen atoms were refined anisotropically using the full-matrix least-squares techniques on F2. The SHELXS-97 and SHELXL-97 [Citation29] programs were used for all the calculations. The H atoms were placed in idealized positions and constrained to ride on their parent atoms with distances in the range of N−H = 0.77(3)–1.03(8) Å, C−H = 0.93 Å and with Uiso(H) = 1.2Ueq(C,N). Hydrogen atoms of water molecules were located from difference Fourier maps and refined with isotropic thermal parameters with a distance of O−H = 0.72(7)–1.10(11) Å and with Uiso(H) = 1.2Ueq(O). The drawings of molecules were accomplished with the help of ORTEP-3 for Windows [Citation30].
Table 1. Crystal data and structure refinement details for compounds 2–4.
Purification of carbonic anhydrase I and II isoenzymes from human erythrocytes
Erythrocytes were purified from human blood. The blood samples were centrifuged at 1500 rpm for 20 min, and plasma was removed. Later, red cells were washed with isotonic solution (0.9% NaCl), and the erythrocytes were hemolyzed with 1.5 volumes of ice-cold water. Cell membranes were removed by centrifugation at 4 °C, 20000 rpm for 30 min. The pH of hemolysate was adjusted to 8.7 with solid TRIS (tris(hydroxymethyl)aminomethane). The hemolysate was applied to affinity column (Sepharose®4B-L-tyrosine-p-aminobenzene sulfonamide) pre-equilibrated with 25.0 mM TRIS-HCl/0.1 M Na2SO4 (pH 8.7). After extensive washing with a solution of 25.0 mM TRIS-HCl/22.0 mM Na2SO4 (pH 8.7), the hCA I and hCA II isoenzymes were eluted with the solution of 1.0 M NaCl/25.0 mM Na2HPO4 (pH 6.3) and 0.1 M NaCH3COO/0.5 M NaClO4 (pH 5.6), respectively [Citation31]. For quantitative protein determination, the Bradford method was used with bovine serum albumin as standard [Citation32]. Also, the purity control of the isoenzymes was performed with SDS-PAGE after the purification [Citation33].
Determination of hydratase and esterase activities of hCA I and hCA II
The CO2 hydratase activity of the enzyme was determined at 0 °C in a veronal buffer (pH 8.15) with the pH-stat method as the indicator and saturated carbon dioxide solution as the substrate in a final volume of 4.2 mL. The time (in seconds) taken for the solution to change from pH 8.15 to pH 6.50 was measured. The enzyme unit (EU) is the enzyme amount that reduces the non-enzymatic reaction time by 50%. The activity of an enzyme unit was calculated by using the equation ((t0−tc)/tc), where t0 and tc are times for pH change of the non-enzymatic and enzymatic reactions, respectively [Citation34].
Esterase activity was examined by following the change in the absorbance at 348 nm of 4-nitrophenylacetate to 4-nitrophenolate ion over a period of 3 min at 25 °C using a spectrophotometer (SHIMADZU UV 1700 PharmaSpec) according to the method described in the literature [Citation35]. The enzymatic reaction, in a total volume of 3.0 mL, contained 1.4 mL of 0.05 M TRIS–SO4 buffer (pH 7.4), 1.0 mL of 3.0 mM 4-nitrophenylacetate, 0.5 mL H2O, and 0.1 mL enzyme solution. A reference measurement was obtained by preparing the same cuvette without enzyme solution.
Determination of IC50 and Ki values of the compounds
To determine the IC50 values (the concentration of inhibitor producing a 50% inhibition of CA activity) of the simple ligands, proton transfer salt, metal complexes, and acetazolamide (AAZ), hydratase, and esterase activities of CA isoenzymes were examined in the presence of various inhibitor concentrations. Regression analysis graphs were drawn by plotting the percent enzyme activity versus inhibitor concentration and IC50 values were calculated [Citation17].
To determine the Ki values as well as the inhibition type, three different inhibitor concentrations giving 30%, 50%, and 70% inhibition were selected. For each of these inhibitor concentrations, enzyme activity was measured in the presence of various substrate concentrations (0.3 mM, 0.4 mM, 0.5 mM, 0.6 mM, and 0.7 mM), and the data were linearized with Lineweaver–Burk plot for Vmax and the Ki determination. Enzyme activity was also measured in the presence of the same substrate concentrations but in the absence of any inhibitor to determine the Vmax (Supplementary Figure S3) [Citation17].
Statistical analysis
All the presented data were confirmed by at least three independent experiments and are expressed as the mean ± SD. Data were analyzed by using a one-way analysis of variance for multiple comparisons (SPSS 13.0, SPSS Inc., Chicago, IL). p < .0001 was considered to be statistically significant.
Results and discussion
Crystal structures of 2–4
The molecular structures of 2–4, with the atom labeling of symmetric units, are shown in . The details of the crystal structure solutions are summarized in , and the selected bond lengths and angles are listed in .
Figure 2. An ORTEP drawing of asymmetric unit of 2 with the atom-numbering scheme. Displacement ellipsoids are drawn at the 40% probability level.
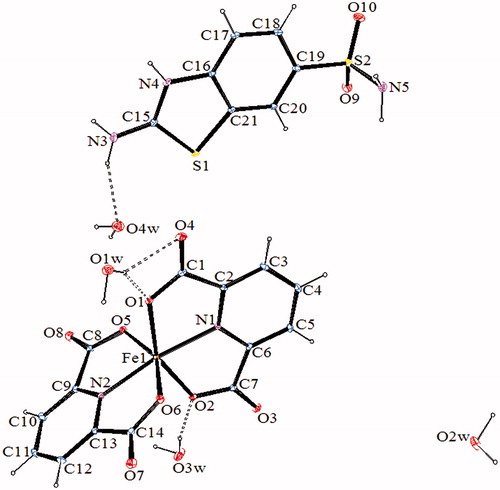
Figure 3. An ORTEP drawing of asymmetric unit of 3 with the atom-numbering scheme. Displacement ellipsoids are drawn at the 40% probability level.
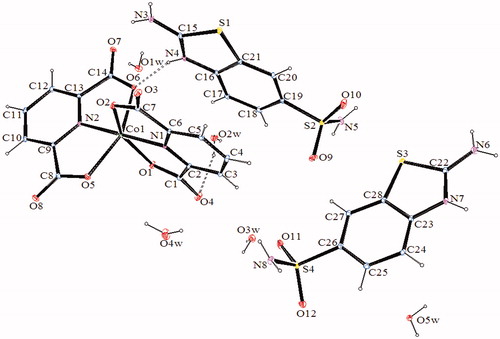
Figure 4. An ORTEP drawing of asymmetric unit of 4 with the atom-numbering scheme. Displacement ellipsoids are drawn at the 40% probability level.
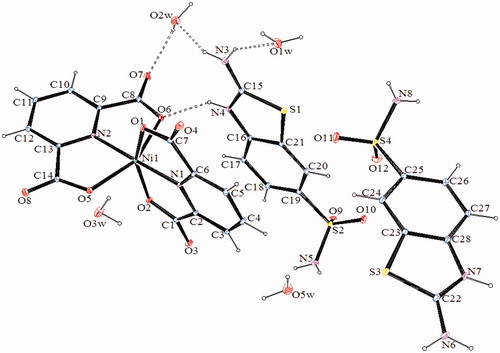
Table 2. Selected bond distances [Å] and angles [°] of compounds 2–4.
Table 3. Hydrogen bonds for compounds 2–4 (Å, °).
The complex 2, (SMHABT)[Fe(DPC)2].4H2O, crystallizes in the monoclinic P21/c space group. The structure of 2 consists of one SMHABT+ cation, one [Fe(DPC)2]– anion, and four uncoordinated water molecules. All the other complexes, (SMHABT)2[M(DPC)2].5H2O [M = Co(II) for 3 and Ni(II) for 4], crystallize in the triclinic P1 space group. The structures of 3 and 4 consist of one [M(DPC)2]2− anion and two counter SMHABT+ cations and five uncoordinated water molecules.
In complexes 2–4, the metal ion coordinates to four oxygen atoms and two nitrogen atoms of two 2,6-pyridinedicarboxylate ions resulted with a distorted octahedral conformation. Both carboxylate oxygen atoms from DPC2− occupy the trans-apical positions of the metal, and define low trans-angle value around metal ion for all complexes within the range of 150.062(18)°–155.16(6)° for O1-M-O2 or O5-M-O6 which reveal a rather rigid structure of such tri-dentate ligands [M = Fe(III) for 2, Co(II) for 3 and Ni(II) for 4] (). In structures of 2–4, the N1-M-N2 trans-angles are closer to 180° [168.6(2)°, 178.57(6), and 178.67(12)°, respectively]. The dihedral angles for all complexes defined by the mean planes of two DPC2− ligands are 105.02(18)° for 2, 103.47(6)° for 3, and 101.98(11)° for 4, showing that they fall almost perpendicular. The M-N and M-O bond distances lie within expected range of 1.970(3)–2.086(5) Å and 2.004(5)–2.1992(15) Å, respectively (). In all essential details, the geometries of the molecules regarding bond lengths and angles of the compounds are in good agreement with the values observed in similar Fe(III) [Citation22,Citation23,Citation25], Co(II) [Citation22,Citation23], and Ni(II) [Citation22,Citation24,Citation25] complexes.
1H and 13C NMR studies of 1
The 1H-NMR and 13C-NMR spectra of the compound 1 were obtained in d6-DMSO with and without D2O at room temperature using TMS as internal Standard (Supplementary Figures S4 and S5). The 1H signals were assigned on the basis of chemical shifts, multiplicities, intensities of the signals, and coupling constants. lists complete 1H-NMR and 13C-NMR spectra of the compound 1.
Table 4. 1H-NMR and 13C-NMR chemical shifts (ppm) with coupling constants and assignments for compound 1.
In 1H NMR spectrum of 1 (Supplementary Figure S4a, ), the H4, H5, and H7 protons of the ring of (SMHABT)+ are doublet, doublet–doublet, and doublet, respectively, with 1H intensity and they are observed at 7.44 ppm (H4, 3JH4-H5 = 8.46 Hz), 7.67 ppm (H5, 3JH5-H4 = 8.46 Hz, 4JH5-H7 = 1.96 Hz), and 8.12 ppm (H7, 4JH7-H5 = 1.87 Hz). H16 proton of the (HDPC)- ring is doublet and another doublet with 1H intensity and observed at 8.18 ppm (3JH16-H15 or H15’ = 7.70 Hz and 3JH16-H15’ or H15 = 7.69 Hz). Although the H16 seems to be symmetrical and is expected to give triplet, the tautomeric of H13 between O18 and O18’, H16 might be unsymmetrical and might give doublet with H15 and another doublet with H15’ [Citation36]. H15 and H15’ protons are observed at 8.25 ppm as doublet–doublet with 2H intensity (3JH15-H16 =7.67 Hz, 4JH15-H15’ = 1.14 Hz or 3JH15’-H16 = 7.67 Hz, 4JH15’-H15 = 1.14 Hz) [Citation36]. The hydrogen atoms (H3 and H13) in compound 1 were not observed in the 1H NMR spectrum. The H11 and H12 protons of NH2 are singlet with 2H intensity, and they are observed at 7.88 ppm and 7.20 ppm, respectively. These protons (H3, H11, H12 and H13) were not observed in the 1H NMR spectrum obtained in d6-DMSO with D2O due to deuterium exchange (Supplementary Figure S4b).
13C-NMR spectrum of 1 exhibits 13 resonances (, Supplementary Figure S5). Seven peaks of this spectrum [148 ppm (C2), 119 ppm (C4), 132 ppm (C5), 156 ppm (C6), 124 ppm (C7), 137 ppm (C8), and 140 ppm (C9)] could be assigned to the carbons of (SMHABT)+ moiety of compound 1. Four peaks at 167 ppm (C14), 128 ppm (C15), 118 ppm (C16), and 170 ppm (C17) could be assigned to the carbons of (HDPC)− ring moiety.
The room temperature NMR spectra for compound 1 indicate clearly the formation of the proton transfer compound with 1:1 ratio of SMABT and H2DPC (Supplementary Figures S4 and S5).
FT-IR measurements
The infrared spectral data of the starting compounds (SMABT and H2DPC) and compounds 1–5 are given in Supplementary Table S2. In the high frequency region, weak bands 3067–3098 cm−1 are attributed to the stretching vibrations of aromatic C-H for all compounds. There are also broad absorption bands at 3502–3529 cm−1, which are attributed to the ν(OH) vibrations of water molecules for compounds 2–5. The relatively weak and broad bands at 2508–2737 cm−1 are attributed to the ν(N+-H) vibration for 1–4 [37]. The absorption bands at 3423, 3324, 3293, and 3237 cm−1 of NH2 group of SMABT are slightly shifted from those found for 1 (3433, 3424, 3385, and 3229 cm−1), for 2 (3398, 3355, 3337, and 3326 cm−1), for 3 (3369, 3341, 3327, and 3297 cm−1), for 4 (3425, 3360, 3337, and 3235 cm−1), and for 5 (3422, 3319, 3297, and 3235 cm−1) due to the weak intermolecular interactions. The carboxylate groups for compounds H2DPC and 1–4 exhibit strong carbonyl bands in the region of 1705–1456 cm−1. These bands are reflected by IR spectrum of the asymmetric (νas) and symmetric (νs) stretching vibrations at 1701 and 1456 cm−1 for H2DPC, 1705 and 1465 cm−1 for 1, 1661 and 1474 cm−1 for 2, 1654 and 1475 cm−1 for 3, and 1632 and 1467 cm−1 for 4. The differences (Δυ) between the asymmetric and symmetric stretches of the carboxylate groups of 2–4 are 187, 179, and 165, respectively, which suggest monodentate binding of the carboxylate group to the metal ion in all complexes [Citation38]. The strong absorption bands in the region of 1637–1445 cm−1 are attributed to the ν(C=N) and ν(C=C) vibrations for all compounds. The vibrations of the ν(S=O) are also observed in the 1430–1097 cm−1 region for compounds SMABT and 1–5. The C–O vibrations data for all compounds except SMABT are between 1375 and 1048 cm−1 as expected. The ring wagging vibrations of the pyridine groups are also observed in the 801–706 cm−1 region for compounds H2DPC and 1–5. The weak bands at 459–436 cm−1 and 591–575 cm−1 are from the M–N and M–O vibrations of the compounds 2–5.
Thermal analyses of all complexes
Supplementary Figures S6–S9 show the TG-DTG and DTA curves of compounds 2–5, and the thermal analyses results are given in Supplementary Table S3.
For the compounds 2–5, the first stage, an endothermic peak corresponds to the loss of water molecules, namely four moles for 2, five moles for 3, five moles for 4, and two moles for 5. The exothermic second stage is consistent to the loss of following units, that is, C5H5NO2S for 2, C14H16N6O4S4 for 3, C6H8N2O4S2 for 4, and C21H21N7O6S6 for 5. The following units are also decomposed exothermically in the third stage: C16H8N4O8S for 2, C15H6N2O8 for 3, C22H14N6O8S2 for 4, and N2H2O2 for 5. The final decomposition products are FeO for 2, CoO for 3, NiO for 4, and FeO for 5, and they are identified by IR spectroscopy (Supplementary Table S3).
UV/vis spectrum, magnetic susceptibility, and molar conductivity
The electronic spectra of compounds 1–5 and the free ligands SMABT and H2DPC were recorded in DMSO solution with 1 × 10⁻³ mol L−1 concentrations at room temperature (Supplementary Table S4 and Figure S10). The characteristic π–π* transitions in the spectrum of 1 are of 305 nm and 290 nm, 310 nm and 303 nm for 2, 288 nm and 271 nm for 3, 286 nm and 268 nm for 4, and 305 nm and 290 nm for 5, with the same profiles as the free ligands SMABT (305 nm and 290 nm) and H2DPC (303 nm). The bands for the d–d transitions in DMSO are observed at 796 nm for 3, 776 nm for 4, and 585 for 5. The d–d transition for complex 2 containing Fe(III) ion with d5 has not been observed.
The room temperature magnetic moment of the metal complexes is of 5.94 BM for 2, 3.82 BM for 3, 2.78 BM for 4, and 4.85 BM for 5 per metal ion, indicating the presence of five (Fe3+, d5), three (Co2+, d7), two (Ni2+, d8), and four (Fe2+, d6) unpaired electrons.
The molar conductivity data in DMSO are of 76.5 Ω−1 cm2 mol−1 for 2, 49.5 Ω−1 cm2 mol−1 for 3, 50.8 Ω−1 cm2 mol−1 for 4, and 3.2 Ω−1 cm2 mol−1 for 5, indicating that the complex 2 is ionic with a 1:1 ratio; the complexes 3 and 4 are ionic with a 2:1 ratio, and 5 is nonionic complex [Citation39].
In vitro inhibition studies
In the present study, the inhibition effects on the hydratase and esterase activities of hCA I and hCA II isozymes of the proton transfer salt (1), its metal complexes (2–4), the starting compounds (SA, TBS, SMABT, H2DPC), Fe(II) complex of SMABT (5), the metal complexes of H2DPC, and the control compound AAZ have been investigated. H2DPC and its metal complexes have not inhibited the hydratase and esterase activities of hCA I and hCA II isoforms.
Hydratase activities of the isozymes have been inhibited by all synthesized compounds. The proton transfer salt and metal complexes have more potent inhibition effects than the starting compounds. However, 1–5 are slightly weaker inhibitors than AAZ. Only 4 has almost the same inhibition effect with AAZ (). The inhibition effect of SMABT is weaker than the proton transfer salt (1). Metal complexes of 1 are more powerful inhibitors than 1 for the hydratase activities of hCA I and hCA II. The structures of 2–4 are similar but their inhibition effects are different. Compound 4 is a more potent inhibitor than 2, 3, and 5 are. These differences in the inhibitory effects could be derived from different metal ions in the complexes for 2 and 3. However, it can be considered that the difference of the inhibitory effect of 5 is due to the differences in molecular structure. When the inhibition profiles of the synthesized compounds on the hydratase activity of isozymes are considered, hCA II has been inhibited almost twice stronger than hCA I. Inhibition levels of the compounds for the hydratase activities of hCA I and hCA II are in the order of AAZ ≈ 4 > 3 > 5 > 2 > 1 > SMABT > TBS > SA.
Table 5. The inhibition data and Ki values of hCA I and hCA II isozymes for hydratase and esterase activity.
The esterase activities of the isozymes are similar to the inhibition of the hydratase activities. But a significant difference can be recognized immediately in the inhibition profiles of esterase activities of hCA I and hCA II as it follows: all of the newly synthesized compounds (1–5) are more powerful inhibitors than AAZ is. Only in terms of the inhibition of the esterase activity of hCA I, compound 2 has nearly same inhibition potential as AAZ. Also, the esterase activities of hCA I and hCA II were inhibited stronger than the hydratase activities of the isozymes. Another difference when compared to the inhibition profile of hydratase activity is that 2 has acted as weaker esterase inhibitor than the proton transfer salt (1). The inhibition effects of 1 are twice higher than SMABT. The inhibitory effects of the metal complexes (2–5) were in the range of 0.066 ± 0.004 µM–0.409 ± 0.021 µM for hCA I, and 0.041 ± 0.003 µM–0.189 ± 0.005 µM for hCA II. Compound 3 has the most effective inhibitor effect on the esterase activities of the isozymes. The inhibition potentials of 4 and 5 are close to each other. Similar to hydratase activity inhibition results, it is shown that hCA II has been inhibited twice stronger than hCA I, except for complex 3 which is 1.5fold. Inhibition levels of the compounds are in the order of 3 > 4 > 5 > 1 > 2 > AAZ > TBS > SMABT > SA for hCA I, and of 3 > 4 > 5 > 1 > 2 > TBS > AAZ > SMABT > SA for hCA II, respectively.
Ki values of the compounds have been determined by using esterase activity measurements (). Ki values clearly show that the compounds have remarkable inhibition effects on hCA I and hCA II isozymes for esterase activities. Especially 3–5 have effective inhibition constants with nearly nanomolar level. The inhibition potentials of these compounds (3–5) are 10 times, 4 times, and 6 times higher than AAZ, respectively. These results are quite remarkable in terms of further studies.
In our previous studies, we investigated the inhibition potentials of the proton transfer salts and the metal complexes derived from 2-aminobenzothiazole [Citation23], 2-amino-6-methylbenzothiazole [Citation22], 2-amino-6-methoxybenzothiazole [Citation24], and 2-amino-6-chlorobenzothiazole [Citation25]. These compounds have also shown remarkable inhibitory effects despite the fact that they do not contain sulfonamide moiety. In this study, the inhibitory effects of the compounds are further improved by using 2-amino-6-sulfamoylbenzothiazole. To summarize, carbonic anhydrase (hCA I and hCA II) inhibition profiles of non-sulfamoyl benzothiazole and sulfamoyl benzothiazole derivatives are imparted to the literature.
Conclusions
In the present work, five newly compounds (1–5) were prepared for the first time. The complexes crystallize in the monoclinic P21/c space group for 2 and the triclinic P1 space group for 3 and 4. In complexes 2–4, the metal ion coordinates to four oxygen atoms and two nitrogen atoms of two 2,6-pyridinedicarboxylate ions resulted with a distorted octahedral conformation. Intermolecular N-H···O and O-H···O hydrogen bonds and π–π stacking interactions seem to be effective in the stabilization of the crystal structure. Elemental analyses and all measurements show good agreement with the structures. The structure of 5 might be proposed as octahedral according to results of elemental, spectral, magnetic measurement, molar conductivity, and thermal analyses.
These five novel compounds possess significant inhibition effect on hCA I and on hCA II for hydratase and esterase activities with nearly nanomolar level. These results suggest that further inhibition studies are worthwhile in order to obtain correlation in such compounds and derivatives of such compounds should be subject to further inhibition in vivo tests. The order of the inhibition effects increasing through starting compounds and proton transfer salt and the complexes of these compounds might be due to the structural changes leading to an impressive difference of activity.
Disclosure statement
The authors declare no conflict of interest. The authors are solely responsible for the content and results presented in this paper.
IENZ_1267058_Supplementary_Material.pdf
Download PDF (334.7 KB)Additional information
Funding
References
- Achaiah G, Goud NS, Kumar KP, Mayuri P. Review on 2-substituted benzothiazoles: diversity of synthetic methods and biological activities. Int J Pharm Sci Res 2016;7:1375–82.
- Yadav PS, Senthilkumar GP. Benzothiazole: different methods of synthesis and diverse biological activities. Int J Pharma Sci Drug Res 2011;3:01–7.
- Alterio V, Di Fiore A, Ambrosio KD, et al. Multiple binding modes of inhibitors to carbonic anhydrases: how to design specific drugs targeting 15 different isoforms?. Chem Rev 2012;112:4421–68.
- Scozzafava A, Kalın P, Supuran CT, et al. The impact of hydroquinone on acetylcholine esterase and certain human carbonic anhydrase isoenzymes (hCA I, II, IX, and XII). J Enzym Inhib Med Chem 2015;30:941–6.
- Supuran CT. Structure and function of carbonic anhydrases. Biochem J 2016;473:2023–32.
- Demirdağ R, Yerlikaya E, Şentürk M, et al. Heavy metal ion inhibition studies of human, sheep and fish α-carbonic anhydrases. J Enzyme Inhib Med Chem 2013;28:278–82.
- Henry RP, Swenson ER. The distribution and physiological significance of carbonic anhydrase in vertebrate gas exchange organs. Respir Physiol 2000;121:1–12.
- Lee SW, Park SB, Jeong SK, et al. On carbon dioxide storage based on biomineralization strategies. Micron 2010;41:273–82.
- Fisher SZ, Aggarwal M, Kovalevsky AY, et al. Neutron diffraction of acetazolamide-bound human carbonic anhydrase II reveals atomic details of drug binding. J Am Chem Soc 2012;134:14726–9.
- Hassan MI, Shajee B, Waheed A, et al. Structure, function and applications of carbonic anhydrase isozymes. Bioorg Med Chem 2013;21:1570–82.
- Le Roy N, Jackson DJ, Marie B, et al. The evolution of metazoan α-carbonic anhydrases and their roles in calcium carbonate biomineralization. Front Zool 2014;11:75–90.
- Supuran CT. Carbonic anhydrase inhibitors. Bioorg Med Chem Lett 2010;20:3467–74.
- Balseven H, İşgör MM, Mert S, et al. Facile synthesis and characterization of novel pyrazole-sulfonamides and their inhibition effects on human carbonic anhydrase isoenzymes. Bioorg Med Chem 2013;21:21–7.
- Supuran CT. How many carbonic anhydrase inhibition mechanisms exist? J Enzyme Inhib Med Chem 2016;31:345–60.
- Supuran CT. Carbonic anhydrases: novel therapeutic applications for inhibitors and activators. Nat Rev Drug Discov 2008;7:168–81.
- Netland PA. Glaucoma medical therapy principles and management. China: Oxford; 2008:9–36.
- Yenikaya C, Sarı M, Bülbül M, et al. Synthesis, characterization and antiglaucoma activity of a novel proton transfer compound and a mixed-ligand Zn(II) complex. Bioorg Med Chem 2010;18:930–8.
- Masini E, Carta F, Scozzafava A, Supuran CT. Antiglaucoma carbonic anhydrase inhibitors: a patent review. Expert Opin Ther Pat 2013;23:705–16.
- Fabrizi F, Mincione F, Somma T, et al. A new approach to antiglaucoma drugs: carbonic anhydrase inhibitors with or without NO donating moieties. Mechanism of action and preliminary pharmacology. J Enzym Inhib Med Chem 2012;27:138–47.
- Başar E, Tunca E, Bülbül M, Kaya M. Synthesis of novel sulfonamides under mild conditions with effective inhibitory activity against the carbonic anhydrase isoforms I and II. J Enzym Inhib Med Chem 2016;31:1356–61.
- Aditama R, Mujahidin D, Syah YM, Hertadi R. Docking and molecular dynamics simulation of carbonic anhydrase II inhibitors from phenolic and flavonoid group. Procedia Chem 2015;16:357–64.
- İlkimen H, Yenikaya C, Sarı M, et al. Synthesis and characterization of a proton transfer salt between dipicolinic acid and 2-amino-6-methylbenzothiazole and its complexes, and their inhibition studies on carbonic anhydrase isoenzyme. Polyhedron 2013;61:56–64.
- İlkimen H, Yenikaya C, Sarı M, et al. Synthesis and characterization of a proton transfer salt between 2,6-pyridinedicarboxylic acid and 2-aminobenzothiazole, and its complexes and their inhibition studies on carbonic anhydrase isoenzymes. J Enzym Inhib Med Chem 2014;29:353–61.
- İlkimen H, Yenikaya C, Sarı M, et al. Synthesis and characterization of some metal complexes of a proton transfer salt, and their inhibition studies on carbonic anhydrase isoenzymes and the evaluation of the results by statistical analysis. J Enzyme Inhib Med Chem 2014;29:695–701.
- İlkimen H, Yenikaya C, Sarı M, et al. Synthesis, characterization and biological activities of metal(II) dipicolinate complexes derived from pyridine-2,6-dicarboxylic acid and 2-(piperazin-1-yl)ethanol. J Enzyme Inhib Med Chem 2015;30:195–203.
- Kaufmann HP, Buckmann JH. Über die rhodanierung des sulfanilamids und einige benzthiazolyl-sulfonamide. Arch Pharm 1941;279:194–209.
- Anderegg G, Bottari E. Pyridinderivate als komplexbildner VII. Über die koordinationstendenz von substituierten dipicolinat-ionen. Helvetica Chimica Acta 1965;48:887–92.
- Bruker, SADABS, Bruker AXS Inc. Madison; 2005.
- Sheldrick GM, SHELXS97 AND SHEXL97. Program for crystal structure solution and refinement. Germany: University of Gottingen; 1997.
- Farrugia LJ. ORTEP-3 for Windows – a version of ORTEP-III with a graphical user interface (GUI). J Appl Cryst 1997;30:565.
- Rickli EE, Ghazanfar SA, Gibbson BH, Edsall JT. Carbonic anhydrases from human erythrocytes. Preparation and properties of two enzymes. J Biol Chem 1964;239:1065–1068.
- Bradford MM. A rapid and sensitive method for the quantitation of microgram quantities of protein utilizing the principle of protein-dye binding. Anal Biochem 1976;72:248–254.
- Laemmli UK. Cleavage of structural proteins during the assembly of the head of Bacteriophage T4. Nature 1970;227:680–685.
- Wilbur KM, Anderson NG. Electrometric and colorimetric determination of carbonic anhydrase. J Biol Chem 1948;176:147–154.
- Verpoorte JA, Mehta S, Edsall JT. Esterase activities of human carbonic anhydrases B and C. J Biol Chem 1967;242:4221–4229.
- Yenikaya C, İlkimen H, Demirel MM, et al. Preparation of two maleic acid sulfonamide salts and their Cu(II) complexes and antiglaucoma activity studies. J Brazilian Chem Soc 2016;27:1706–14.
- Cook D. Vibrational spectra of pyridinium salts. Canadian J Chem 1961;39:2009–2024.
- Nakamoto K. Infrared and raman spectra of inorganic and coordination compounds. 5th ed. New York: Interscience-Wiley; 1997:59.
- Geary WJ. The use of conductivity measurements in organic solvents for the characterisation of coordination compounds. Coord Chem Rev 1971;7:81–121.