
Abstract
Fraxamoside, a macrocyclic secoiridoid glucoside featuring a hydroxytyrosol group, was recently identified as a xanthine oxidase inhibitor (XOI) comparable in potency in vitro to the standard antigout drug allopurinol. However, this activity and its considerably higher value than its derivatives oleuropein, oleoside 11-methyl ester, and hydroxytyrosol are not explained by structure–activity relationships (SARs) of known XOIs. To exclude allosteric mechanisms, we first determined the inhibition kinetic of fraxamoside. The resulting competitive mechanism prompted a computational SAR characterization, combining molecular docking and dynamics, which fully explained the behavior of fraxamoside and its derivatives, attributed the higher activity of the former to conformational properties of its macrocycle, and showed a substantial contribution of the glycosidic moiety to binding, in striking contrast with glycoside derivatives of most other XOIs. Overall, fraxamoside emerged as a lead compound for a new class of XOIs potentially characterized by reduced interference with purine metabolism.
Introduction
Xanthine oxidoreductase (XOR) is a 290 kDa dimeric molybdenum-containing enzyme involved in the catabolism of purines in humans. Each subunit contains one molybdopterin cofactor, two distinct [2Fe–2S] centers, and one FAD cofactor and catalyzes the oxidation of hypoxanthine to xanthine and xanthine to uric acid at the molybdopterin center, with concomitant reduction of NAD+ to NADH at the FAD center. XOR may act as dehydrogenase (XDH) and oxidase (XO): the XDH utilizes NAD+ or O2 as final electron acceptor, whereas XO uses exclusively O2 as electron acceptor, generating O2•− and H2O2 during its mechanism of reactionCitation1.
Since XO generates significant amounts of ROS, it represents an important source of free radicals, potentially determining oxidative damage to living tissuesCitation2. Furthermore, XO is deeply involved into the development of hyperuricemia, a risk factor for gout, cardiovascular diseases, hypertension, and metabolic syndromeCitation3. Therefore, inhibition of XO is highly desirable both in treating hyperuricemia or gout by reducing circulating levels of uric acid and in contrasting oxidative stress. Presently, allopurinol is the most widely used XO inhibitorCitation4. It is effective in both lowering urate levels in the body and retarding the metabolism of chemotherapeutic agents such as 6-mercaptopurine, but, on the other hand, serious side effects, including skin rashes, allergic reactions, increased blood pressure, and increased risk of cataract extraction, have been observed in some clinical patientsCitation5–7. In the last decade, the search and design of new classes of non-purine XO inhibitors have produced many classes of natural or synthetic compounds endowed with widely variable inhibition mechanisms and strengthsCitation8–10. In particular, starting from 2008 to 2009, a new selectiveCitation11 non-purine inhibitor, febuxostat, has been marketed. Although it exhibits a considerably higher activity in vitro and in vivo than allopurinol, lacks most adverse effects of purine derivatives, results more effective than fixed-dose allopurinol in lowering serum uric acid concentrationCitation12, compared cost–benefit analyses still support the use of allopurinol as first-line drug in gout, febuxostat being recommended as an option for the management of chronic hyperuricemia in gout only for people who are intolerant of allopurinol or for whom allopurinol is contraindicatedCitation13. Consequently, the development of alternative XO inhibitors remains desirable.
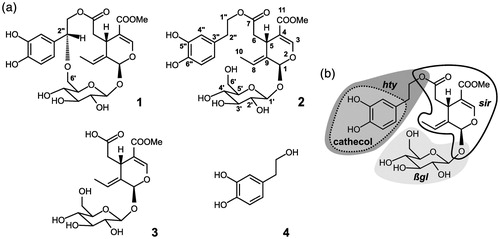
Recently, several plant phenolic compounds were reported to inhibit XO activityCitation14–16. Among them fraxamoside (Compound 1) () exhibited a significant inhibitory activity on XOCitation17. Fraxamoside is a macrocyclic secoiridoid glucoside isolated from Fraxinus americanaCitation18 and Olea europaea L. leaves decoctionCitation17, also containing, among many others, the compounds: oleuropein (Compound 2)Citation19,Citation20, oleoside 11-methyl ester (Compound 3), and hydroxytyrosol (Compound 4) ()Citation17. These four molecules are strictly related to each other, since Compound 2 derives from the condensation of Compounds 3 and 4, and Compound 1 is the product of cyclization of Compound 2. Thus, these compounds feature different combinations or topologies of three moieties, illustrated in for Compound 2: a hydroxytyrosol group (hty), present in Compounds 1, 2, and 4, both a secoiridoid moiety (sir) and a β-D-glucose unit (βgl), contained in Compounds 1–3. Compounds 1 and 2 share the same combination and connectivity of groups, except for the extra ethereal bond in 1 between the alcoholic function at C6’ of βgl and the C2” atom of hty, with consequent formation in this compound of a 14-membered ring.
Figure 1. XO ligand structures, atom, and fragment naming. (a) The structures of fraxamoside (Compound 1), oleuropein (Compound 2), oleoside 11-methyl ester (Compound 3), and hydroxytyrosol (Compound 4) are shown along with the atom naming scheme (reported for 2). (b) Representation of the different fragments discussed in the paper, highlighted for 2 by a dark gray area (hty) with a medium gray enclosure surrounded by a dotted line (cathecol), a light gray area (βgl), and a thick black contour line (sir).
Interestingly, Compounds 1–3 (especially 1) represent a significant departure from traditional scaffolds active on XO, that, independently on their natural or synthetic origin and on their purine-like or non-purine nature, are almost invariably characterized by largely planar structures.
Methods
Reagents
Xanthine was purchased from Fluka; Xanthine oxidase from bovine milk (0.2 U/mg), DMSO, allopurinol, FeCl2, and XO from Sigma-Aldrich (St. Louis, MO). Ethanol was purchased from Merck (Darmstadt, Germany). Fraxamoside, extracted from Olea europea L. leaf decoction, was kindly supplied by Prof. M. Iorizzi.
XO activity assay
XO catalyzes uric acid formation through oxidation of xanthine (or hypoxanthine) and therefore its activity can be monitored by following the increase of uric acid formation by the absorbance at 295 nm (Cary50 UV-Vis Spectrophotometer equipped with a Peltier thermoelectric controller, Varian Medical Systems, Inc.)Citation21,Citation22.
The assay was carried out in a 500 μL final volume reaction mixture, containing 50 mM phosphate buffer, pH 7.8, 0.1 mM EDTA, 50 μM xanthine as substrate, 3.2 U/L XO, and different amounts of each compound as potential XO inhibitor. The assay was started by adding 10 μL of the enzyme stock solution to the reaction mixture and followed by reading the absorbance up to 2 min at 20 °C, thus calculating the corresponding rate in the linear range of the reaction. For each sample, the extent of the inhibitory effect (i) was calculated as i = (V0 – Vi)/V0 where V0 and Vi are respectively the rate measured in the absence or presence at least six different amounts of the compounds used [I], whose range of concentration was properly chosen.
The IC50 (concentration value corresponding to 50% inhibition of XO activity) was figured out from the slope of the double reciprocal plot between i and [I], according to the equation: 1/i = 1 + IC50/[I].
To evaluate the maintenance of enzyme activity during the experiment, the XO specific activity was checked before each set of inhibition tests. No significant decrease of XO specific activity was observed throughout the time required by enzymatic inhibition experiments.
In order to analyze the inhibitory effects on kinetics parameters of XO and, hence, to evaluate Ki for tested molecules, XO inhibition was evaluated using the method described above, with appropriate modification. The assay was carried out in a 500-μL final volume buffer A, constituted by 50 mM phosphate buffer, pH 7.8, 0.1 mM EDTA, supplemented with increasing concentration of xanthine as substrate in the absence or in the presence of variable amounts of the selected inhibitor. The assay was initiated by adding 10 μL of 160 U/L XO solution to the reaction mixture, without or with inhibitors, and it was followed in kinetics by reading the absorbance up to 2 min at 20 °C, thus calculating the rate of acid uric formation in the linear range of the reaction. The kinetic parameters of the XO reaction were derived from Lineweaver–Burk plots obtained measuring the rate of uric acid formation at different xanthine concentration (ranging between 0.4 and10 μM). Inhibition studies were carried out by measuring the kinetic parameters in the presence of different inhibitors. The Ki of fraxamoside and allopurinol was measured by the abscissa intercept of the secondary plots of apparent Km (K'm) versus [I], according to the following equation: K'm = [I] Km/Ki + Km.
Statistical analysis
The kinetic parameters of XO were determined by Lineweaver–Burk plot using a standard curve-fitting program. At each single concentration of substrate, the activity was evaluated in triplicate. The correlation coefficient R2 between the concentration of the samples and the relative effect was always greater than 0.900. Correlation and regression analyses and statistical analysis were made with Student’s t-test, using the software KaleidaGraph (Reading, PA). p values lower than 0.05 were considered to be significant.
Conformational analysis of Compound 1 and parameterization of Compounds 1–3 for amber force field
Starting ligand geometries were built with Ghemical 2.99.2Citation23, in a standard extended geometry for oleuropein and Compound 3, in an arbitrary strainless macrocycle ring conformation for fraxamoside, and they underwent energy minimization (EM) at molecular mechanics level first, using Tripos 5.2 force field parametrizationCitation24, and then at AM1 semi-empirical level. To explore the conformational space accessible to Compound 1 macrocycle, which is kept rigid in subsequent docking calculations, a molecular dynamics (MD)-based simulated annealing approach (SA) was adopted, by applying cycles of MD with the following general temperature profile: 10 ps of heating from 1 K to Tmax, 50 ps of simulation at Tmax, and 10 ps of cooling from Tmax to 1 K, with a starting value of 500 K of Tmax. A final EM provided the new sampled conformer. Tmax was varied between 500 and 1500 K according to the following protocol: it was kept constant until three SA cycles produced no new structure within 10 kcal mol−1 from the best current conformer, in which case it was increased by 200 K. If good structures were located at this higher temperature, Tmax was decreased by 200 K, and the procedure was reiterated. After reaching an upper limit of 1500 K, the SA was terminated if no new good structure was obtained after nine more SA cycles. The default Ghemical MD values were used for all other MD parameters involved in the SA procedure.
The fraxamoside structures selected from SA underwent geometry optimization with the ORCA 3.0.2 programCitation25 at the DFT level, using B3LYP functionalsCitation26,Citation27. Def2-TZVPP basis setCitation28,Citation29, Def2-TZVPP/J auxiliary basis set, DFT-D3 empirical dispersion correction with Becke–Johnson dampingCitation30,Citation31, COSMO water solvent modelCitation32, and the RIJCOSX approximation to speed-up the calculation of two-electron integralsCitation33. Simultaneous convergence tolerances of 5.0·× 10−6 Eh for the energy change between subsequent steps, 3.0·× 10−4 Eh bohr−1 for the maximum gradient, 1.0·× 10−4 Eh bohr−1 for the RMS gradient, 4.0·× 10−3 bohr for the maximum atomic displacement, and 2.0·× 10−3 bohr for the RMS atomic displacement between subsequent steps, were applied.
The AM1-EM structures of the SA conformation of fraxamoside with the sir cycle in equatorial position on the macrocycle, of oleuropein, and Compound 3, were fully optimized using GAMESS programCitation34 at the Hartree-Fock level with STO-3G basis set, followed by a single-point HF energy evaluation at the 6–31G* level to derive the partial atomic charges for the ligands by the RESP procedureCitation35.
Docking
Docking studies were performed with AutoDock 4.2Citation36. The crystallographic structures of XO (PDB: 3NVY) and ligands were processed with AutoDock Tools (ADT) package version 1.5.6rc1Citation36 to merge nonpolar hydrogens, calculate Gasteiger charges, and select rotatable side-chain bonds. Grids for docking evaluation with a spacing of 0.375 Å and 40·40·60 points, centered in the ligand binding pocket, were generated using the program AutoGrid 4.2 included in Autodock 4.2 distribution. In total, 100 molecular docking runs for each “docking calculation” were performed adopting a Lamarckian Genetic Algorithm (LGA) and the following associated parameters: 100 individuals in a population with a maximum of 15 million energy evaluations and a maximum of 37 000 generations, followed by 300 iterations of Solis and Wets local search. Flexibility was used for all rotatable bonds of docked ligands and selected residue sidechain dihedrals in protein binding site, namely Leu648, Glu802, Leu873, Ser876, Phe1009, Val1011, and Leu1014. For each docking run, the representative binding poses with most favorable binding energy from the most populated clusters were selected for the subsequent MD simulations of ligand–XO complexes.
Molecular dynamics, energy analysis, and binding free energy evaluation
The selected complexes for each ligand were completed by addition of all hydrogen atoms and underwent EM and then MD simulations with Amber12 pmemd.cuda moduleCitation37,Citation38, using ff12SB version of AMBER force fieldCitation39 for the protein and gaff parametersCitation40 for the ligands. Parameters from Kikuchi et al.Citation41 were used for the dioxothiomolybdenum(VI) ion.
To perform MD simulation in solvent, complexes were confined in TIP3P water periodic boxes exhibiting a minimum distance between solute and box surfaces of 10 Å, using the tleap module of AmberTools13Citation42. Each system was then neutralized by addition of counterions (Na+) and underwent 1000 steps of EM with solute atoms harmonically restrained to their starting positions using a force constant of 10 kcal mol−1 Å−1. The resulting structures were submitted to 90 ps restrained MD (5 kcal mol−1 Å−1) at constant volume, gradually heating the system to 300 K, followed by 60 ps restrained MD (5 kcal mol−1 Å−1) at constant temperature (300 K) and pressure (1 atm) to adjust system density. Production MD simulations were carried out at constant temperature (300 K) and pressure (1 atm) for 10 ns with a time-step of 2 fs. Bonds involving hydrogens were constrained using the SHAKE algorithmCitation43.
Nonbonded energy contribution analysis has been performed with the cpptraj module of AmberTools13Citation42 on the fully-solvated MD trajectories, following the minimum image convention and applying a 12 Å cutoff on both van der Waals and electrostatic interactions. For these latter a simple shifting function has been applied, to smoothly reduce the electrostatic interaction to zero at rcut, thus avoiding step-like truncation effects at the cutoff distance:
Eelec = k qiqj/rij (1 – r2ij/r2cut)2, where qi, qj, rij are the charges of atoms i and j and the distance between them, respectively, and k includes the dielectric constant (=1 in vacuo), the constant terms and all the unit conversion factors required by the units used for q, r, and E.
Gibbs binding free energies (ΔGb) have been calculated from MD trajectories with the sietraj programCitation44,Citation45. They are reported as mean values ± SEM.
Results
Redetermination of IC50 in pure water for Compounds 1–4 and allopurinol
IC50 values on Compounds 1–4 were previously determined in 5% (v/v) methanol-water solution to allow comparisons with compounds scarcely soluble in pure waterCitation17. However, since methanol inhibits XO, it can affect the experimental characterization of XO inhibition by other ligandsCitation46,Citation47. Thus, we determined the IC50 values for Compounds 1–4 and allopurinol reported in in the total absence of methanol (see “Methods”).
Table 1. Inhibitory effect of selected compounds on XO.
Kinetic characterization of XO inhibition by fraxamoside
The unusual structural features of fraxamoside as a XO inhibitor and activity patterns of its related Compounds 2–4 discussed in the introduction prompted us to experimentally determine XO inhibition kinetics and Ki for fraxamoside and, as a reference, allopurinol and to compare the results with available data on Compounds 2 and 4Citation17. Kinetic analysis demonstrated that XO activity was competitively inhibited by fraxamoside. In fact, as reported in , at increasing concentrations of inhibitor the value of Vmax remained unchanged, whereas K'm for xanthine progressively increased in the presence of concentrations of fraxamoside of 0.19, 0.83, and 1.90 μM (inset to ). These data allowed to figure out a Ki for fraxamoside of 0.9 ± 0.25 μM (), a value comparable to that measured for allopurinol under the same experimental conditions (1.9 ± 1.0 μM; ). Allopurinol exhibited a competitive inhibition mode, like oleuropein, the most abundant component in Olea europea extract, widely studied for its significant antioxidant activity, as well as for many other nutraceutical propertiesCitation48. Ki value of fraxamoside is at least 50 times lower than that of oleuropein and comparable to that of allopurinol ().
Figure 2. XO Inhibition. (a) Inhibition of XO by fraxamoside. About 0.03 U of XO was incubated in a 500 μL buffer A supplemented with xanthine ranging from 0 to 10 μM final concentration, in the absence (black line) or in the presence of fraxamoside concentrations of 0.19 (red line), 0.83 (blue line), 1.9 μM (green line), following kinetically the formation of uric acid. The reaction rate v was expressed as ΔE/sec, where ΔE is the difference of absorbance measured at 295 nm. Inset Figure a: the data from the Lineweaver–Burk plots were treated according to the equation described in “Methods”. (b) Inhibition of XO by allopurinol. The same as in A except that allopurinol was tested as inhibitor at 0.62 (red line), 1.6 (blue line), and 2.8 μM (green line) final concentrations. Inset Figure b: the data from the Lineweaver–Burk plots were treated according to the equation described in “Methods”.
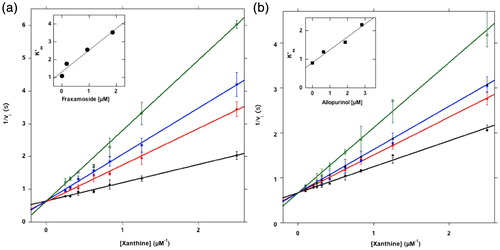
Overall, these results show a competitive mechanism for the binding of fraxamoside, thus delimiting the region to be explored with computational techniques to the active site of the enzyme. They also parallel the relative scale of potency of the different ligands observable on IC50 values () under the same experimental conditions adopted for Ki determination.
Molecular docking and molecular dynamics simulations
General features
A combined approach of molecular docking and MD simulations was undertaken to investigate the binding modes of Compounds 1–3 into the active site of XO, in order to rationalize the experimental trends observed in XO inhibition.
In all our calculation, we only employed the so-called MoCo domain (∼800 residues) of XOR, hereinafter referred to as XO, which is the site of the oxidative hydroxylation of purines. The investigated molecules significantly differ in shape and size from quercetin, the ligand crystallized in complex with the selected XO structure used as target. Thus, the sidechains of some critical residues, both at the entrance of, and inside the binding site, namely Leu648, Glu802, Leu873, Ser876, Phe1009, Val1011, and Leu1014, were kept flexible in all the docking runs. The stability of all the distinct poses within the best 20 complexes by energy from each docking run was assessed by MD.
In principle, the fraxamoside macrocycle can assume two major conformations, with the ethereal linkage between the C1 of βgl and the C1 of the sir cycle in either axial or equatorial position. SA calculations selected one main conformer for each macrocycle conformation. These two structures were optimized at DFT(B3LYP)/Def2-TZVPP level in implicit water. Since the equatorial form is by far (19.7 kcal mol−1) more stable than the axial conformer, only the former was considered in docking calculations.
XO-fraxamoside (Compound 1) complex
The analysis of docking results led to the selection of four XO-fraxamosideCitation1 complex models for the subsequent MD simulation step. The four poses differ in the portion of molecule that docks into the XO active site region: (i) hty, (ii) βgl, (iii) both of them, (iv) none of them. MD trajectory analysis showed that complex I was fairly unstable, as shown by a positional RMSD time plot of ligand heavy atoms after protein backbone atom best fit (), due to the loss of the starting π-stacking between hty and Phe914, and perpendicular π–π interaction with Phe1009.
Figure 3. Ligand RMSD plots for MD simulations of selected docking models of XO complexes with Compounds 1–3. The positional RMS deviations for ligand atoms during the 10 ns MD refinement runs, calculated after best fit of the protein backbone atoms, are shown for the 1 (a), 2 (b), and 3 (c) XO-complex models selected after docking.
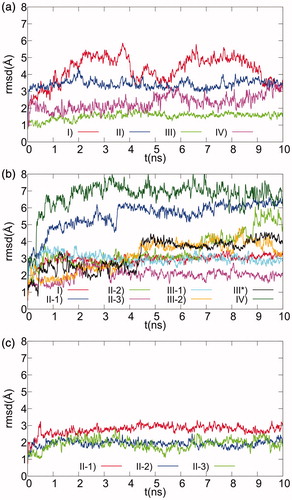
During MD simulation of complex II, fraxamosideCitation1 binding mode underwent an initial transition, associated to a sudden increase to about 3 Å of the RMSD value shown in , determined by a ligand rotation with loss of the initial H-bonds between sir carbonylic O11 and Lys771 and between βgl O6’ and Thr1010, whereas the H-bonds of βgl O2’/3’ with Glu802 and hty O5”/6” with Glu879 persist during the whole simulation.
Complex III was quite stable during MD (), and preserved all its starting interactions: the hty pendant is sandwiched between Phe914 and Phe1009, forming π stacking with the former and a π–π perpendicular interaction with the latter, while O6” engages a H-bond with the oxygen atom of the dioxothiomolybdenum(VI) ion. βgl O3’/4’ are H-bonded to Glu802, and the sir ethylidene group forms hydrophobic interactions with Leu648 (), all other protein–ligand interactions being shown in .
Figure 4. Representative structure of the ligand binding site of the final model of the XO complex with fraxamoside (Compound 1). The site of the representative frame from the last 5 ns of MD for the XO-fraxamoside complex III model is shown adopting a partially transparent tan ribbon representation for protein backbone, and sticks for ligand, prosthetic groups, and protein sidechains of residues involved in contacts with either ligands or dioxothiomolybdenum(VI) ions. Atoms are colored with the following scheme: O = red, N = blue, H = white, S = yellow, P = orange, Mo = light-blue, cyan = C atoms from residues involved in conserved interactions with all structurally characterized XO ligands, solid tan = C atoms from residues exhibiting specific interactions with fraxamoside and magenta = C atoms in fraxamoside. Ligand-protein H-bonds are depicted with a green spring.
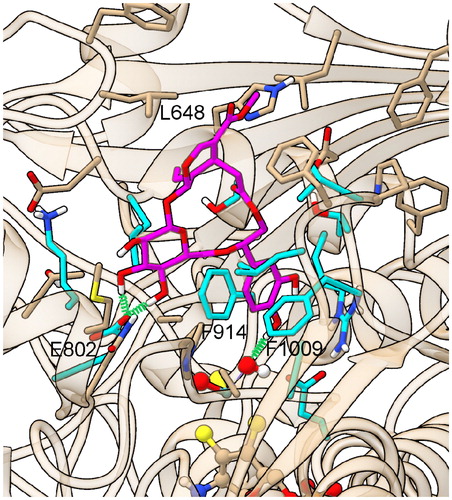
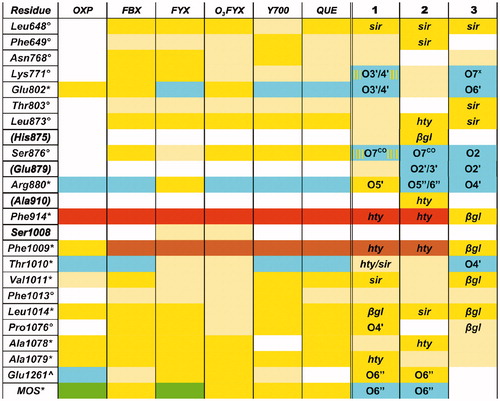
Figure 5. XO-ligand contacts in PDB structures and in models of complexes with Compounds 1–3. The first column reports XO residues contacting ligand in PDB structures of XO complexes and in XO-Compound 1/2/3 models. Asterisk (*), degree (°), and caret (^) symbols mark those residues exhibiting interactions with all, all minus oxypurinol, and all minus quercetin PDB ligands, respectively, while parentheses enclose residues exhibiting close contacts with Compound 1 and/or 2 and/or 3 alone. Other columns shows protein-ligand contacts in PDB structures of XO complexes and in MD trajectories of XO-Compound 1/2/3 models, with the following color scheme green = covalent bond; cyan = H-bond; yellow = vdW contacts within 4 Å; light-yellow = vdW contacts between 4 Å and 5 Å; orange = involved into π-stacking, brown = perpendicular π–π interaction. Yellow stripes on a cyan field indicate fluctuating H-bond interactions observed in >1/3 of the MD frames. The following abbreviations are used for ligands and nonstandard residues: MOS = dioxothiomolybdenum(VI) ion, OXP = oxypurinol, FBX = febuxostat, FYX = FYX-051, O3FYX = trihydroxy-FYX-051, Y700 = Y-700, QUE = quercetin. Ligand atoms/groups responsible for close interaction in Compound 1/2/3 complexes (for names and numbering see ) are listed in the corresponding cells. “x” and “CO” superscripts indicate both O and only the carbonylic O atom in COO groups, respectively. Multiple atoms/groups are separated by a slash (/) symbol.
Instead complex IV resulted unstable, drifting toward dissociation () during the simulation. According to calculated ΔGb values, complex III is more stable than II by 1.5 kcal mol−1 (−9.33 ± 0.02 kcal mol−1 versus −7.76 ± 0.02 kcal mol−1, respectively), thus for XO-fraxamoside only model III will be discussed hereafter.
The relative contributions of the groups in which fraxamoside can be ideally fragmented to the ligand nonbonded interaction energy with XO and the solvent, calculated with the shifting function for the electrostatic part described in “Methods”, show that hty is responsible for 29.0% (29.0% with XO, 0% with solvent) of the total fraxamoside–environment interaction, while sir only contributes 15.8% (10.7% XO, 5.1% solvent) and the βgl is the most strongly interacting group in this binding mode, accounting for 55.2% (50.8% XO, 4.4% solvent) of the total.
XO-oleuropein (Compound 2) complex
The classification adopted for the poses of fraxamoside can be also applied to the selected docking models for XO-oleuropein (Compound 2) complex. However, this latter exhibits additional poses corresponding to minor variants of the II and III orientations, arising from the availability in oleuropein of the primary (O6’) hydroxyl group of βgl. In fact, complex II has three variants, with O6’ alternatively pointing toward either the dioxothiomolybdenum(VI) ion (II-1), or Glu802 (II-2) or Thr1010 (III-3). However, only complex II-3 was stable throughout the MD simulation (), stabilized by the H-bonds between βgl O2’/3’ and Glu802, βgl O6’ and Thr1010, hty O5” and Glu879, and hty O6” and Thr1010 carbonyl backbone ().
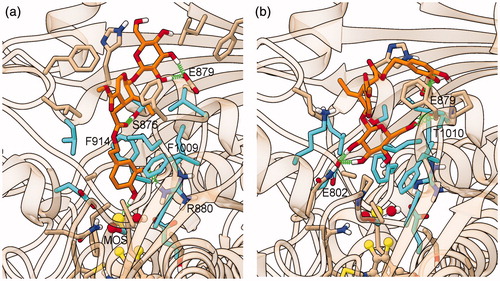
Figure 6. Representative structures of the ligand binding site of the final models of the XO complexes with oleuropein (Compound 2). The sites of the representative frames from the last 5 ns of MD for the XO-oleuropein complexes I (a) and II-3 (b) are shown with the same representation and colors used in , except for C atoms of oleuropein, in orange.
Complex III, corresponding to the most stable XO-fraxamoside pose, has two variants, characterized by different orientations of βgl O6’, facing either hty C2” (III-1), thus mimicking fraxamoside ring closure, or Lys771 sidechain (III-2). Additionally, to ensure the most complete comparison with the favorite binding mode of fraxamoside, we also built and simulated by MD a XO-oleuropein complex model (III*) directly derived from the III model of the XO-fraxamoside complex by ring opening followed by local EM of the resulting structure of oleuropein. All III complexes deeply rearranged during MD simulations, losing the initial stacking interaction between hty and Phe914. The final position of oleuropein in all III complexes was shifted toward the rim of the cleft: in III-1 βgl retained the initial H-bond interactions with Glu802, but hty formed intramolecular H-bonds with βgl rather than the protein, in III-2 βgl drifted toward the external rim replacing its initial H-bonds to Glu802 with H-bonds to Lys771 and Asp872, this latter being outside the cleft, and complex III* rearranged toward a structure essentially overlapping that observed in II-3 MD simulation.
Complex IV, featuring neither βgl, nor hty inside the pocket, was fairly unstable during the simulation period, the ligand drifting toward the external rim of the catalytic pocket as shown by ligand RMSD plots in . Complex I, with hty inside and βgl at the pocket entrance, remained stable after an initial rearrangement (). Oleuropein formed six H-bonds with the protein: two double interaction between hty O5”/O6” and Arg880, βgl O2’/3’ and Glu879, and two single H-bonds, between hty O6” and, alternatively, one of the O or the S atom of the dioxothiomolybdenum(VI), sir carbonylic O11, and Ser876. Moreover, oleuropein is involved in π stacking and perpendicular π–π interactions of its hty group with Phe914 and Phe1009, respectively, and in the van der Waals interactions shown in . Since calculated ΔGb predicts this latter more stable than II-3 by 0.7 kcal mol−1 (−8.80 ± 0.02 kcal mol−1 versus −8.06 ± 0.02 kcal mol−1, respectively) only model I will be discussed hereafter for XO-oleuropein.
The analysis of the relative contributions of the different fragments of oleuropein to the ligand nonbonded interaction energy with the environment provided the following contributions for complex I: 37.8% (35.3% with XO, 2.5% with solvent) for hty, 18.5% (16.9% with XO, 1.6% with solvent) for sir, 43.7% (37.9% with XO, 5.8% with solvent) for βgl.
XO-oleoside 11-methyl ester (Compound 3) complex
The selected XO-oleoside 11-methyl ester (Compound 3) complexes from docking runs exhibited the same three orientations of the glycosidic ring inside the pocket found in XO-oleuropein, with the primary (6’) hydroxyl group of βgl alternatively pointing toward the dioxothiomolybdenum(VI) ion (II-1), Glu802 (II-2), or Thr1010 (II-3).
Complex II-1 rearranged during MD, losing the initial H-bond with dioxothiomolybdenum(VI) ion and forming a pattern of H-bonds with βgl similar to that observed for complex II-2 (shown in ), whereas the sir carboxylate group is now involved in an intramolecular H-bond.
Complex II-2 was quite stable along MD trajectory (): βgl formed a network of H-bonds involving O6’ with Glu802, and O4’ with Arg 880/Thr1010 and the sir carboxylate group (O7 atoms) was H-bonded/salt bridged to Lys771 (). The network of intermolecular H-bonds/salt bridge and the other protein–ligand interaction identified in the MD trajectories of this complex are shown in .
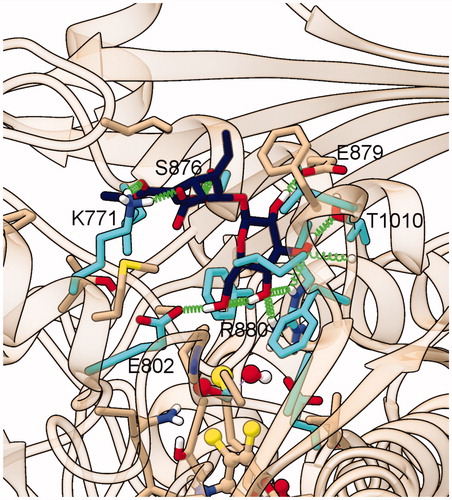
Figure 7. Representative structure of the ligand binding site of the final model of the XO complex with oleoside 11-methyl ester (Compound 3). The site of the representative frame from the last 5 ns of MD for the XO-Compound 3 complex II-2 is shown with the same representation and colors used in , except for C atoms of Compound 3, in dark blue.
Complex II-3, even if stably resident within the site throughout the whole MD simulation, featured a reduced number of stabilizing H-bond interactions, since it lose the initial H-bonds/salt bridge between sir carboxylate of Compound 3 and Lys771.
Discussion
Comparison with other known XO ligands
Experimentally solved complex structures of XO involve ligands (quercetin, PDB: 3NVY; Febuxostat, PDB: 1N5X; trihydroxy-FYX-051, PDB: 3AM9, oxypurinol, PDB: 4BDJ; Y-700, PDB: 1VDV; FYX-051, PDB 1V97) exhibiting widely different binding modes, suggested mechanisms for XO inhibition and potency. In spite of this, a compared analysis of their short-range contacts with XO shows a conserved subset of interactions shared by all the solved ligands (marked with an asterisk (*) in the first column of ). When our models of XO complexes with Compounds 1–3 are added to this comparison, it can be easily observed that the subset is substantially preserved (stick representation with cyan C atoms in ), with the only exception of Compound 3, which does not form direct interactions with the dioxothiomolybdenum(VI) ion. Another noticeable result is that the three ligands also form most of the contacts included in the wider subsets containing interactions detected in all but either oxypurinol or quercetin PDB ligands (marked with a degree (°) and a caret (∧) symbol, respectively, in the first column of ). In particular, fraxamoside forms all the contacts from these two subsets. While number and exact nature of each interaction in the subset may vary between different ligands, the involved protein residues appear to play a fundamental role in the stabilization of the experimental XO–ligand complexes. In this view, this analysis provides a validation of the proposed models for the complexes of XO with Compounds 1–3 as competent structures for XO inhibition. Furthermore, the three ligands may also give rise to additional interactions, not observed, or corresponding to very loose contacts, in experimental complexes (residues in parenthesis in the first column of , stick representation with tan C atoms in ). Drug design/lead optimization based on a combination of exploitation of these new potential interaction sites with the possible strengthening of those interactions which in Compounds 1–3 are weaker than in strong XO ligands could represent an effective strategy to improve ligand potency, while retaining their unique structure–activity relationships.
Structure–activity relationships among the investigated inhibitors
The complex models also answer the more specific questions arisen in the “Introduction” about the inhibitory properties of Compounds 1–3 on XO. First, they justify the XO inhibition activity exhibited by the most potent compound of the series, fraxamoside, in spite of its size, bulkiness, and the overall structural properties rather unusual for a XO ligand. Second, they explain the non-additivity observed in the XO inhibitory activity within the compound 1–4 series (), and, in particular, the origin of the higher activity exhibited by fraxamoside versus oleuropein. Third, they explain the stabilizing effect of the sugar unit on the complexes, differently from what observed for other natural products containing phenols groups, whose glycosides are usually less active than the corresponding aglycones.
As for the first point, fraxamoside can accommodate both the βgl and the hty cathecol rings deeply inside the XO binding pocket, by engaging a network of stabilizing interactions with both dioxothiomolybdenum(VI) ion, and those XO residues identified in the crystal structures of other XO-inhibitor complexes as critical for ligand binding, such as Glu802, Phe914, and Phe1009, thus reaching a binding mode that is both tight and effective in precluding the access of XO substrates to the active site.
As for the second point, this docking mode appears exclusive to fraxamoside, since it critically depends on the conformational properties of the fraxamoside macrocycle. In fact, oleuropein, in spite of its considerably larger flexibility, appears unable to simultaneously dock in a stable fashion its βgl and hty catechol rings deep inside XO active site. Even those starting poses of oleuropein exhibiting a ligand conformation and relative orientation to XO site very similar to those occurring in XO-fraxamoside III model rapidly lose the interaction of either of the two rings with residues critical for binding to XO during the MD simulations, thus resulting in different binding modes between fraxamoside and oleuropein. In principle, it would be expected that the higher flexibility of oleuropein on the one hand may allow a better optimization of ligand–protein interactions, in turn leading to complexes enthalpically favored over those accessible to the conformationally restricted fraxamoside, but on the other hand would determine a higher entropic cost due to the higher loss of ligand conformational freedom upon binding. However, even by employing a method to estimate the binding free energy that totally neglects this latter entropic contribution (see “Methods”), the XO-fraxamoside complex is still favored by about 0.5 kcal mol−1 over XO-oleuropein. In this view, oleuropein, rather than “led toward a more favorable binding mode by its flexibility”, appears to be “prevented from assuming exactly the same optimal conformation observed in best XO-fraxamoside models by the sterical bump between βgl C6’ and O6’ and hty C2” atoms”, which are instead covalently bonded in fraxamoside. The combination of different predicted binding modes and energy contributions between these two ligands suggests that the optimal conformation for binding lies in the quite narrow region of conformational subspace only accessible to the cyclic molecule and not to its linear counterpart, rather than either in their common subspace, which would provide similar binding modes with an exclusively entropic advantage for the cyclic compound over its open form, or in the much wider subspace only accessible to the linear molecule, which would result in different binding modes, but associated to a stronger predicted ΔGb (at least when neglecting conformational entropy changes) for the linear compound. The unbalance between energetic gain and “entropic cost” deriving from oleuropein flexibility is also confirmed by an extension of the comparison to Compound 3, a “fragment” of oleuropein devoid of hty, from which oleuropein emerges as the worst inhibitor in the series. Compound 3, although lacking the aromatic moiety, critical for π–π stacking with key aromatic residues in the catalytic site, is able to compensate this gap with, on one hand, a lower reduction of conformational freedom upon binding, and on the other hand, the occurrence of an ionic interaction with Lys771, which helps to stably anchor the molecule in the active site.
As for the third point, the analysis of all the XO-ligand models obtained in the present paper suggests an active stabilizing contribution of βgl to binding, in sharp contrast with glycoside derivatives of other polyphenols active on XO, usually detrimental to the activity of the corresponding aglyconeCitation49–51. For instance, a comparison between the XO inhibitory effect of quercetin and its 3-O-glucoside derivativeCitation17 (IC50 = 1.9 and 54.6 μM, respectively) clearly demonstrates a detrimental effect of glycosilation for its inhibitory activity. A comparative analysis between the X-ray structure of quercetin-XO and a model of quercetin 3-O-glucoside-XO complex suggests that this effect may derive from the limited flexibility of the flavonoid system, which produces a change in the exact binding mode of the flavonoid group to host the glucose unit in the XO site (data not shown), thus impairing the network of favorable interactions of the aglycone without a sufficient compensation from the new interactions involving the glycosidic unit. Instead, in our models of all the XO–ligands complexes, βgl substantially contributes to optimal XO binding, thus compensating the relatively small contribution of hty to the overall binding observed in fraxamoside and oleuropein complexes. The relative weight of the overall contribution of hty (29.0%) versus βgl (55.2%) in the best predicted XO binding mode for fraxamoside (model III) is consistent with both experimental data (poor activity of Compound 4 and comparable activity of Compounds 2 and 3)Citation17, and other computational results obtained in our MD simulations, such as the aforementioned observed instability of the XO-fraxamoside binding mode I, and labilization of the interaction between hty and XO active site in all the models of XO-oleuropein belonging to the III family. Even in complex I of oleuropein, which exhibits the largest contribution of hty to the total interaction energy of the ligand with its environment (37.8%), the largest term is still provided by βgl (43.7%). While in fraxamoside and oleuropein, the sugar group contributes by both forming direct interaction with the middle-external region of XO active site and improving and protecting the interactions formed in the inner part of the XO active site by XO and hty, Compound 3, which lacks this latter group, is mainly stabilized by direct interactions of βgl with the middle-internal region of XO active site, where it also forms van der Waals contacts with the important aromatic residues Phe914 and Phe1009. Thus, at present, a large stabilizing contribution from a sugar unit represents, although with different mechanism between Compounds 1/2 and 3, a peculiarity of the ligands characterized in the present study, which could be exploited to design new derivatives of these molecules endowed with improved ligand pharmacokinetic or tolerability properties.
The relative contribution of sir to the interaction of the ligands with XO, although limited in comparison with hty and βgl (10.7% and 16.9% for fraxamoside and oleuropein, respectively) is important to ensure the proper orientation of hty or βgl and provides one of the hydrophobic anchoring groups of the three complexes. After cyclization in fraxamoside, it assumes a conformation capable of simultaneously optimizing hty and βgl interactions with XO.
Conclusions
Fraxamoside (Compound 1) represents a promising lead compound for a new family of XO inhibitors, characterized by peculiar structural features, and particularly, by the exploitation of different binding groups instead of the combination of aromatic/conjugated rings typical of other XO inhibitors. In particular, this study underlines the importance of the conformational properties of the fraxamoside macrocycle. In fact, this ring, quite rigid despite its size, both allows an optimal orientation inside the XO active site of all the “subligands” in which fraxamoside can be ideally split, and, thanks to its rigidity, minimizes the entropic cost associated to conformational freezing upon binding.
Furthermore, the comparison of the modeled static and dynamic properties between the XO complexes of Compounds 1–3 has allowed a rationalization of their relative scale of activity. The availability of a small but “well-targeted” natural library of related compounds in the Olea europaea L. leaf decoction represented a precious contribution to characterize the SAR of the most active compound in the series.
Another relevant implication of the SARs derived for Compounds 1–4 is their strong non-additivity, which suggests a great care in the systematic application of simple additive models in the derivation of SARs or in molecular design.
Overall, the last two observations pointed out the importance of the combination of richness and “smooth variability” of most natural sources, exhibiting a substantially higher complexity and diversity of scaffolds than synthetic libraries featuring several orders of magnitude more compounds, but usually based on additive criteria in their design.
However, the quality of a virtual screening approach depends more critically on computational protocols for binding mode screening, optimization, and analysis when applied to a relatively small and widely structurally variable natural product library than to a more smoothly variable synthetic (especially combinatorial) library, since the latter usually benefits of both a fairly larger statistical base, and of cancelations of errors on energy/scoring terms often occurring within a similar series of compounds. Thus, more reliable validations of the proposed binding modes for the former are required, also allowing for extensive rearrangements of the models deriving from docking, possibly at a cost in terms of required computational times, largely compensated by the lower number of compounds to be screened. Our docking + MD-based protocol proved effective in discriminating between stable and unstable binding modes and allowed from moderate to substantial rearrangements of the starting models and a careful comparison of potentially similar binding modes between different ligands.
The ensemble of structure–activity relationships derived from the overall computational and biochemical data is expected to significantly contribute to the identification and design of highly selective ligands toward XO, with small or no affinity for other targets involved in the metabolism of purines and their derivatives. In this view, a relevant feature is represented by the possibility of obtaining fraxamoside and its analogs, as well as building blocks, from a relatively inexpensive source, the leaves of Olea europaea L., i.e. a by-product of the olive cultivation.
Acknowledgements
The authors offer special thanks to Prof. Takeshi Nishino, Department of Applied Biological Chemistry, University of Tokio, Japan, for kindly providing the force field parameters of the dioxothiomolybdenum(VI) ion.
Disclosure statement
The authors report no conflicts of interest. The authors alone are responsible for the content and writing of this article.
Funding
This work is supported by “POR Campania FESR 2007–2013 – Network of biotechnologies in Campania”, project “FARMABIONET – Integrated network for the application of biotechnologies to pharmacologically active molecules”.
References
- Kelley EE, Khoo NKH, Hundley NJ, et al. Hydrogen peroxide is the major oxidant product of xanthine oxidase. Free Radic Biol Med 2010;48:493–8.
- Rajendran P, Nandakumar N, Rengarajan T, et al. Antioxidants and human diseases. Clin Chim Acta 2014;436:332–47.
- Becker MA, Jolly M. Hyperuricemia and associated diseases. Rheum Dis Clin North Am 2006;32:275–93.
- Elion G. The purine path to chemotherapy. Science 1989;244:41–7.
- Agarwal V, Hans N, Messerli FH. Effect of allopurinol on blood pressure: a systematic review and meta-analysis. J Clin Hypertens (Greenwich) 2013;15:435–42.
- Garbe E. Exposure to allopurinol and the risk of cataract extraction in elderly patients. Arch Ophthalmol 1998;116:1652.
- Thong BY-H. Stevens-Johnson syndrome/toxic epidermal necrolysis: an Asia-Pacific perspective. Asia Pac Allergy 2013;3:215–23.
- Kumar R, Darpan Sharma S, Singh R. Xanthine oxidase inhibitors: a patent survey. Expert Opin Ther Pat 2011;21:1071–108.
- Chauhan M, Kumar R. A comprehensive review on bioactive fused heterocycles as purine-utilizing enzymes inhibitors. Med Chem Res 2015;24:2259–82.
- Chen C, Lü J-M, Yao Q. Hyperuricemia-related diseases and xanthine oxidoreductase (XOR) inhibitors: an overview. Med Sci Monit 2016;22:2501–12.
- Takano Y, Hase-Aoki K, Horiuchi H, et al. Selectivity of febuxostat, a novel non-purine inhibitor of xanthine oxidase/xanthine dehydrogenase. Life Sci 2005;76:1835–47.
- Ernst ME, Fravel MA. Febuxostat: a selective xanthine-oxidase/xanthine-dehydrogenase inhibitor for the management of hyperuricemia in adults with gout. Clin Ther 2009;31:2503–18.
- Love BL, Barrons R, Veverka A, Snider KM. Urate-lowering therapy for gout: focus on febuxostat. Pharmacotherapy 2010;30:594–608.
- Sahgal G, Ramanathan S, Sasidharan S, et al. In vitro antioxidant and xanthine oxidase inhibitory activities of methanolic Swietenia mahagoni seed extracts. Molecules 2009;14:4476–85.
- Konno H, Kanai Y, Katagiri M, et al. Melinjo (Gnetum gnemon L.) seed extract decreases serum uric acid levels in nonobese Japanese males: a randomized controlled study. Evidence-Based Complement Altern Med 2013;2013:1–9.
- Sweeney AP, Wyllie SG, Shalliker RA, Markham JL. Xanthine oxidase inhibitory activity of selected Australian native plants. J Ethnopharmacol 2001;75:273–7.
- de Marino S, Festa C, Zollo F, et al. Antioxidant activity and chemical components as potential anticancer agents in the olive leaf (Olea europaea L. cv Leccino.) decoction. Anticancer Agents Med Chem 2014;14:1376–85.
- Takenaka Y, Tanahashi T, Shintaku M, et al. Secoiridoid glucosides from Fraxinus americana. Phytochemistry 2000;55:275–84.
- Panizzi L, Scarpati ML, Oriente G. The constitution of oleuropein, a bitter glucoside of the olive with hypotensive action. II. Gazz Chim Ital 1960;90:1449–85.
- Inouye H, Yoshida T, Tobita S, et al. Absolute struktur des oleuropeins und einiger verwandter glucoside. Tetrahedron Lett 1970;11:2459–64.
- Bergmeyer H, Gawehn K, Grassl M. Enzymes as biochemical reagents. In: Bergmeyer HU, ed. Methods of enzymatic analysis. 2nd ed. New York (NY): Academic Press Inc.; 1974:521–2.
- de Marino S, Festa C, Zollo F, et al. Antioxidant activity of phenolic and phenylethanoid glycosides from Teucrium polium L. Food Chem 2012;133:21–8.
- Hassinen T, Peräkylä M. New energy terms for reduced protein models implemented in an Off-Lattice force field. J Comput Chem 2001;22:1229–42.
- Clark M, Cramer RD, Van Opdenbosch N. Validation of the general purpose tripos 5.2 force field. J Comput Chem 1989;10:982–1012.
- Neese F. The ORCA program system. Wiley Interdiscip Rev Comput Mol Sci 2012;2:73–8.
- Becke AD. Density-functional thermochemistry. III. The role of exact exchange. J Chem Phys 1993;98:5648.
- Stephens PJ, Devlin FJ, Chabalowski CF, Frisch MJ. Ab initio calculation of vibrational absorption and circular dichroism spectra using density functional force fields. J Phys Chem 1994;98:11623–7.
- Schäfer A, Horn H, Ahlrichs R. Fully optimized contracted Gaussian basis sets for atoms Li to Kr. J Chem Phys 1992;97:2571.
- Weigend F, Ahlrichs R. Balanced basis sets of split valence, triple zeta valence and quadruple zeta valence quality for H to Rn: design and assessment of accuracy. Phys Chem Chem Phys 2005;7:3297–305.
- Grimme S. Density functional theory with London dispersion corrections. Wiley Interdiscip Rev Comput Mol Sci 2011;1:211–28.
- Grimme S, Antony J, Ehrlich S, Krieg H. A consistent and accurate ab initio parametrization of density functional dispersion correction (DFT-D) for the 94 elements H-Pu. J Chem Phys 2010;132:154104
- Sinnecker S, Rajendran A, Klamt A, et al. Calculation of solvent shifts on electronic g-tensors with the conductor-like screening model (COSMO) and its self-consistent generalization to real solvents (direct COSMO-RS). J Phys Chem A 2006;110:2235–45.
- Neese F, Wennmohs F, Hansen A, Becker U. Efficient, approximate and parallel Hartree–Fock and hybrid DFT calculations. A “chain-of-spheres” algorithm for the Hartree–Fock exchange. Chem Phys 2009;356:98–109.
- Schmidt MW, Baldridge KK, Boatz JA, et al. General atomic and molecular electronic structure system. J Comput Chem 1993;14:1347–63.
- Fox T, Kollman PA. Application of the RESP methodology in the parametrization of organic solvents. J Phys Chem B 1998;102:8070–9.
- Morris GM, Huey R, Lindstrom W, et al. AutoDock4 and AutoDockTools4: automated docking with selective receptor flexibility. J Comput Chem 2009;30:2785–91.
- Götz AW, Williamson MJ, Xu D, et al. Routine microsecond molecular dynamics simulations with AMBER on GPUs. 1. Generalized born. J Chem Theory Comput 2012;8:1542–55.
- Salomon-Ferrer R, Götz AW, Poole D, et al. Routine microsecond molecular dynamics simulations with AMBER on GPUs. 2. Explicit solvent particle mesh Ewald. J Chem Theory Comput 2013;9:3878–88.
- Case DA, Darden TA, Cheatham III, TE, et al. AMBER 12, University of California, San Francisco [Internet] 2012. Available from: http://ambermd.org/doc12/Amber12.pdf.
- Wang J, Wolf RM, Caldwell JW, et al. Development and testing of a general amber force field. J Comput Chem 2004;25:1157–74.
- Kikuchi H, Fujisaki H, Furuta T, et al. Different inhibitory potency of febuxostat towards mammalian and bacterial xanthine oxidoreductases: insight from molecular dynamics. Sci Rep 2012;2:331.
- Case DA, Darden TA, Cheatham III TE, et al. AMBER 13, University of California, San Francisco [Internet] 2012. Available from: http://ambermd.org/doc12/AmberTools13.pdf.
- Ryckaert J-P, Ciccotti G, Berendsen HJ. Numerical integration of the Cartesian equations of motion of a system with constraints: molecular dynamics of n-alkanes. J Comput Phys 1977;23:327–41.
- Naïm M, Bhat S, Rankin KN, et al. Solvated interaction energy (SIE) for scoring protein-ligand binding affinities. 1. Exploring the parameter space. J Chem Inf Model 2007;47:122–33.
- Cui Q, Sulea T, Schrag JD, et al. Molecular dynamics-solvated interaction energy studies of protein-protein interactions: the MP1-p14 scaffolding complex. J Mol Biol 2008;379:787–802.
- Coughlan MP, Rajagopalan KV, Handler P. The role of molybdenum in xanthine oxidase and related enzymes. Reactivity with cyanide, arsenite, and methanol. J Biol Chem 1969;244:2658–63.
- Pick FM, McGartoll MA, Bray RC. Reaction of formaldehyde and of methanol with xanthine oxidase. Eur J Biochem 1971;18:65–72.
- Bulotta S, Celano M, Lepore SM, et al. Beneficial effects of the olive oil phenolic components oleuropein and hydroxytyrosol: focus on protection against cardiovascular and metabolic diseases. J Transl Med 2014;12:219.
- Nguyen MTT, Awale S, Tezuka Y, et al. Xanthine oxidase inhibitors from the flowers of Chrysanthemum sinense. Planta Med 2006;72:46–51.
- Lin CM, Chen CS, Chen CT, et al. Molecular modeling of flavonoids that inhibits xanthine oxidase. Biochem Biophys Res Commun 2002;294:167–72.
- Day AJ, Bao Y, Morgan MR, Williamson G. Conjugation position of quercetin glucuronides and effect on biological activity. Free Radic Biol Med 2000;29:1234–43.
- Flemmig J, Kuchta K, Arnhold J, Rauwald HW. Olea europaea leaf (Ph.Eur.) extract as well as several of its isolated phenolics inhibit the gout-related enzyme xanthine oxidase. Phytomedicine 2011;18:561–6.