
Abstract
Fibrotic diseases have become a major cause of death in the developed world. AdipoR1 agonists are potent inhibitors of fibrotic responses. Here, we focused on the in silico identification of novel AdipoR1 peptide agonists. A homology model was constructed to predict the 3D structure of AdipoR1. By docking to known active peptides, the putative active site of the model was further explored. A virtual screening study was then carried out with a set of manually designed peptides using molecular docking. Peptides with high docking scores were then evaluated for their anti-fibrotic properties. The data indicated that the novel peptide Pep70 significantly inhibited the proliferation of hepatic stellate cells (HSC) and NIH-3T3 cells (18.33% and 27.80%) and resulted in favouring cell-cycle arrest through increasing the accumulation of cells in the G0/G1 phase by 17.08% and 15.86%, thereby reducing the cell population in the G2/M phase by 11.25% and 15.95%, respectively. Additionally, Pep70 exhibited the most marked suppression on the expression of α-smooth muscle actin (α-SMA), collagen type I alpha1 (COL1A1) and TGF-β1. Therefore, the peptide Pep70 was ultimately identified as an inhibitor of fibrotic responses and as a potential AdipoR1 agonist.
Introduction
Fibrosis is defined by overgrowth, hardening, and/or scarring of various tissues due to the excessive accumulation of extracellular matrix (ECM) components such as collagen and fibronectinCitation1,Citation2. Different fibrotic diseases have different aetiologies, but they all share a common pathogenic process: excessive activation of TGF-β that initiates and sustains fibroblast activation and myofibroblast differentiationCitation3. Thus, blocking the TGF-β signal transduction pathway has been explored for the treatment of fibrotic diseasesCitation4. Recent studies demonstrate that activated adiponectin receptor can block the TGF-β pathway via AMPK, which can inhibit the secretion of extracellular matrix protein collagen type I (COL1A1) and prevent the induction of the myofibroblast phenotype marker α-SMACitation5,Citation6. Adiponectin, a 244-amino acid protein secreted predominantly by white adipose tissueCitation7, activates the AMPK pathway through interacting with AdipoR1, which is a subtype of adiponectin receptor, to offer protection against hepatic fibrogenesisCitation8. Due to its larger peptide fragments, the clinical applications of complete adiponectin protein are restricted. Therefore, the development of simpler and smaller molecules associated with adiponectin that could function as adiponectin receptor agonist became a focus of some researchers. Laszlo Otvos JrCitation9 found six adiponectin-based peptide compounds acting as AdipoR1 agonists through screening a panel of 66 overlapping peptides, each 10 amino acids long, covering the entire globular domain of the human adiponectin protein. One of these peptides, named ADP355, mimics key biological functions of adiponectin in vitro as well as in vivo. Marco MieleCitation10 found a nine-residue osmotin peptide that can interact with AdipoR1 via studying the structural and functional similarities between osmotin and human adiponectin.
In this study, we created a homology model of AdipoR1 in silico with a seven-transmembrane domain, of which the N-terminus is internal and the C-terminus is external, in contrast to the topology of all reported G protein-coupled receptors (GPCRs)Citation11. The putative active site of the model was further explored by docking with the known active peptidesCitation9,Citation10. A virtual screening study was carried out with a set of manually designed peptides using molecular docking. Furthermore, peptides with high docking scores were evaluated for their anti-fibrotic bioactivity levels, and one new peptide with promising anti-fibrotic effects was subjected to a binding mode analysis.
Materials and methods
Materials
Pep56, Pep69, Pep70, Pep71 and ADP355 (purity ≥98%) was synthesised using standard Fmoc solid-phase synthesis protocols (Shanghai Top-peptide Biotechnology Co., Ltd, Shanghai, China); CCK-8 assay kit (Dojindo Molecular Technologies Inc., Rockville, MD); Rat TGF-β1 protein (Beijing Creanove Biotechnolpgy Co., Ltd, Beijing, China); α-SMA Rb pAB, COL1A1 Rb pAB and TGF-β1 Rb pAB (Wanleibio, Shenyang, China); rabbit β-actin antibody (CST, Danvers, MA); BCA protein assay kit (Beyotime Biotechnology, Shanghai, China); Trizol reagent (Invitrogen, Carlsbad, CA); HiFiScript 1st Strand cDNA Synthesis Kit and UltraSYBR Mixture (ComWin Biotech Co., Ltd, Jiangsu, China).
Methods
Modelling of AdipoR1
The amino acid sequence of AdipoR1 (NP_057083.2) was retrieved from the NCBI database. The template structure (PDB ID: 1GU8) was obtained from the PDB based on the report of Tanabe et al.Citation10. The Build Homology Models module in DS was applied for homology modelling. The number of models was set to 10, and the optimisation level was changed to high. Refinement loops were set to true, and the other parameters remained as their defaults. The best model among the model structures generated was chosen on the basis of the PDF total energy and DOPE score, the two basic functions in DS for model evaluation. The chosen model was subjected to energy minimisation and molecular dynamics simulation. Given that AdipoR1 belongs to the transmembrane protein family, a membrane was added using the Create and Edit Membrane module in DS before energy minimisation. Generalized Born with Implicit Membrane (GBIM) was selected as the implicit solvent model. The system was refined using the CHARMm forcefield with the Smart Minimiser protocol (Steepest Descent method followed by Conjugate Gradient method). The Standard Dynamics Cascade module was applied for molecular dynamics simulation. Other parameters remained at their defaults except for the use of GBIM as the implicit solvent model. A Ramachandran plot and the Profile-3D module in DS were used to evaluate the optimised model.
Virtual screening
Virtual screening based on molecular docking is an effective method for the identification of novel compounds. The programme GOLD 5.1 was employed for our docking virtual screen. Genetic Optimisation for Ligand Docking (GOLD) is a genetic algorithm for docking compounds into protein binding sites. Considering full ligand flexibility and partial protein flexibility including protein side chains and backbone flexibility), GOLD shows high accuracy and reliabilityCitation12,Citation13. Docking studies of the known active peptide was first applied to explore the probable active site of the protein model. A set of manually designed peptides was generated using the Build and Edit Protein module in DS for virtual screening. The construction of the peptides started with the known active peptide, and we changed residues based on the rules provided by Laszlo Otvos JrCitation9. A goldscore fitness function was used to evaluate the docking results, and peptides with high goldscores were selected for in vitro experiments.
The anti-fibrotic experiment
Cell culture
The rat immortalised HSC line HSC-T6 and mouse NIH-3T3 cells were cultured at 37 °C with 5% CO2 in Dulbecco’s modified Eagle’s medium (DMEM) with a high glucose concentration (4.5 g/L) supplemented with 10% foetal bovine serum (FBS) and 1% penicillin/streptomycin.
Cell proliferation assay
The cell viability of HSC-T6 and NIH-3T3 cells was determined by CCK-8 assay according to the instructions of the manufacturer. Briefly, cells were plated onto 96-well plates (1 × 10⁴ cells/well) and treated with different concentrations of peptides (0.05, 0.5, 1.0, 5.0, 10.0, 50 and 100 μM) or PBS for 24 h. CCK-8 solutions were added and incubated for 2 h followed by viable cell detection with a microplate reader at 450 nm absorbance (Model 550; Bio-Rad, Hercules, CA).
Flow cytometric analysis of the cell cycle
For cell-cycle analysis, cells were incubated in a 24-well plate (1 × 10⁴ cells/well) and pre-treated with peptides (10, 50 and 100 μM) or PBS for 1 h followed by 24 h co-incubation with rat TGF-β1 (5 ng/ml). Cells were collected and fixed in cold 70% ethanol overnight at 4 °C, followed by PI (1 mg/ml) staining in the presence of 1% RNase A for 30 min at 37 °C in the dark. The percentages of cells in the sub-G1, G0/G1, S and G2/M phases were analysed by flow-cytometry (BD FACSCalibur, San Jose, BD) at an excitation and emission of 488 nm and 630 nm, respectively. At least 15,000 cells were harvested for each analysis, and the experiments were performed in triplicate.
Western blot analysis
After 16 h of synchronised growth in serum-free media containing 0.1% FBS, HSC-T6 and NIH-3T3 cells were pre-treated with 10 μM peptides or PBS for 1 h, followed by 24 h co-incubation with rat TGF-β1 (5 ng/ml), washed with ice-cold HBSS, and then collected by gentle scraping. The total protein was quantified using the bicinchoninic acid (BCA) protein assay kit. A total of 30 μg of each protein lysate (RIPA lysis buffer) was mixed with 5 × Laemmli sample buffer and subjected to 10% SDS-PAGE. Blots were probed with α-SMA, COL1A1 and TGF-β1 antibody.
Real-time qPCR
To investigate the screened peptides effects on the expression of fibrotic genes (α-SMA, COL1A1 and TGF-β1), HSC-T6 and NIH-3T3 cells were treated with different concentrations of peptides or PBS for 1 h, followed by 24 h co-incubation with rat TGF-β1 (final concentration 5 ng/ml). After total RNA extraction, reverse transcription was performed using 400 ng RNA according to the instructions of the manufacturer. The primers for qPCR are listed in . Real-time PCR was carried out using a CFX96 Optical Reaction Module for Real-Time PCR Systems (Bio-Rad Laboratories Inc., Hercules, CA). The expression levels of three fibrotic genes were normalised against β-actin and compared with the model group (only rat TGF-β1 stimulation). Data were showed as the mean of two experiments, and three parallel samples were prepared for each peptide concentration.
Table 1. Primers used for real-time qPCR.
Results and discussion
Modelling of AdipoR1
The homology model of AdipoR1 was built using the Discovery Studio (DS) software (Accelrys, San Diego, CA). This programme can simultaneously incorporate structural data from one or more reference proteins. Structural features in the reference proteins are used to derive spatial restraints, which in turn are used to generate model protein structures using conjugate gradients and simulated annealing optimisation procedures. Building on the strategy of Marco MieleCitation10, protein rhodopsin II (PDB code: 1GU8) was used as the reference protein. The probability density function (PDF) total energy and Discrete Optimised Protein Energy (DOPE) scores were used for model evaluation. The PDF total energy is the sum of the scoring function value of all homology-derived pseudo-energy terms and stereochemical pseudo-energy terms, while the DOPE score of a protein is a conformational energy that measures the relative stability of a conformation with respect to other conformations of the same proteinCitation14. Both can assist in choosing the best model out of a set of predicted model structures of a protein sequence. In total, 20 models were obtained () and based on its lowest PDF total energy and relatively low DOPE scores. The best model was selected for further optimisation by energy minimisation and molecular dynamics simulation.
Table 2. PDF total energy and DOPE scores of each model.
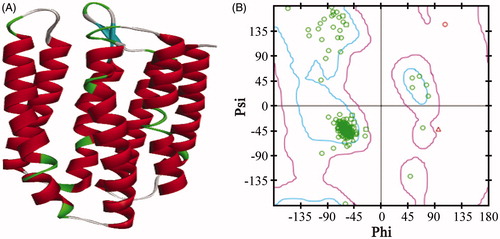
The reliability of the model was assessed and confirmed by comparing specific model scores with the “expected high” and “expected low” scores generated by the Verify Protein (Profiles-3D) module in the DS programme. The optimised model 1 generated a score of 97.63, which was closer to the expected high score of 112.68 than to the expected low score of 50.71. This result confirmed that the optimised model 1 was reliable (). A Ramachandran plot provides a graphical representation of the local backbone conformation of each residue in a protein and includes a representation of the favourable and unfavourable regions for residuesCitation15. As shown in , only two residues in the generated structure fell in the unfavourable region, while 93.8% residues fell in the most favoured region, which further validated the quality of model 1.
Figure 1. The 3D structure of the AdipoR1 homology model (A) and the Ramachandran plot of model 1 (B). The zone in the blue line (inside line) was the most favoured region, and the zone in the purple line (outside line) was the allowed region. The zone outside of the purple line was the disallowed region.
The mapping of active binding sites by docking with known active peptides
In Laszlo Otvos Jr’s workCitation9, they examined the interaction of an active peptide with biotin-labelled fragments of the 4 AdipoR1 extracellular loops. They found that the active peptide bound the first extracellular loop of AdipoR1. Therefore, we defined the residues of loop 1 as the binding site; the coordinates of the binding site sphere were x = 5.2647, y = −3.849 and z = −25.191, and the radius was 15 Å. The GOLD programme was applied to dock the optimised model 1 to the known active peptides (the sequence of each peptide is listed in ). Docking with each peptide generated 10 docking poses, and the poses with highest goldscores were selected to achieve complex system balance by molecular dynamics simulation. The final poses were chosen for the analysis of the interaction between the peptides and model 1. The residues involved in the interaction of each peptide are listed in . K35 was identified as a key residue because it was involved in all of the peptide-protein interactions except for Pep23. To make the virtual screening more accurate, we redefined the binding site with residue K35 set as the centre of the sphere, and we reset the coordinates of the binding site sphere (x, y, z: 5.913, −4.498 and −24.006, and radius 9 Å).
Table 3. Sequence of known active peptides and the docking results to the model 1.
Identifying biologically active compounds through virtual screening
In silico virtual high-throughput screening is a rapid method of identifying the biologically active compounds. A virtual screening based on docking was used to identify the peptides that can effectively interact with optimised model 1. A total of 747 manually designed peptides were included in the screen library. The top three peptides in goldscores were selected for further anti-fibrotic bioactivity studies ().
Table 4. Sequence and gold scores of the screened peptides.
The anti-fibrotic properties of the screened peptides
Pep70 inhibited the cell proliferation of HSC-T6 and NIH-3T3
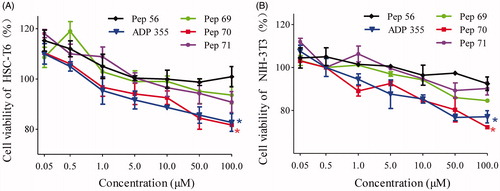
The activation of HSCs is the crucial step of fibrogenesis because HSCs are the main producers responsible for the excessive production of extracellular matrix and profibrogenic cytokines in fibrotic liversCitation16,Citation17. Obtained from desegregated NIH Swiss mouse embryo fibroblasts, NIH-3T3 cells have become a standard fibroblast cell lineCitation18,Citation19. To investigate the anti-proliferative effect of the studied peptides, HSC-T6 and NIH-3T3 cells were treated with different concentrations of peptides as indicated, and then the cell viability was determined by CCK-8 assay. ADP355Citation20–22, a novel adiponectin-based short peptide agonist (H-DAsn-Ile-Pro-Nva-Leu-Tyr-DSer-Phe-Ala-DSer-NH2) with potent anti-fibrotic activities in vivo and in vitro, was used as a positive control. Pep56, a sequence-scrambled peptide, was used as a negative control. As shows, cell proliferation for HSC-T6 and NIH-3T3 cells was significantly inhibited by Pep70. At a dose of 10 μM, the suppression rates against NIH-3T3 cells reached 15.3%. Notably, this anti-proliferation effect of Pep70 was similar to ADP355, while Pep69 and Pep71 exhibited lower suppression rates compared with Pep70. Several kinds of peptides harbour the capacity to prevent fibrosis driven by HSC-T6 cellsCitation23,Citation24, and Pep70 also attenuates fibrosis by suppressing the proliferation of HSC-T6 and NIH-3T3 cells.
Figure 2. The cell proliferation of HSC-T6 and NIH-3T3 cells treated with different concentrations of peptide or PBS. (A) Cell proliferation of HSC-T6 cells. (B) Cell proliferation of NIH-3T3 cells. Statistically different levels are denoted by *p < 0.01, and the data are presented as the mean of three repeated experiments.
Pep70-induced cell-cycle arrest
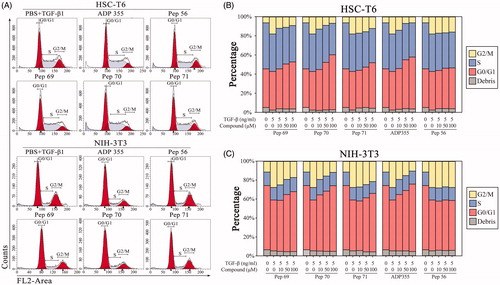
Restrained proliferation always presents as cell-cycle arrestCitation25. To further examine the anti-proliferative effect of the screened peptides, HSC-T6 and NIH-3T3 cells were used to determine the cell-cycle perturbations using flow cytometry. In untreated NIH-3T3 cells, the cell-cycle distribution curve showed 53.64% of the population in the G0/G1 phase, 27.79% of the population in the G2/M phase and 18.57% of the population in the S phase, explaining the rapid proliferation of the cells. Upon treatment with Pep70, the cells were arrested in the G0/G1 phase with 69.50% of the population in the G0/G1 phase and 11.84% of the population in the G2/M phase, with no obvious increase in the apoptotic sub-G1 fraction (). For HSC-T6 cells, Pep70 treatment also favoured cell-cycle arrest by increasing the cells’ accumulation in the G0/G1 phase by 17.08% and reducing the cell population in the G2/M phase by 11.25% compared with untreated cells, which stayed in the same phase (57.50% versus 40.42% and 6.84% versus 18.09%, respectively), as shown in . The cell-cycle perturbations of Pep70 were similar to that of ADP355, suggesting its obvious anti-fibrotic effects.
Figure 3. Pep70-induced cell-cycle arrest. Flow cytometric cell-cycle analysis in HSC-T6 and NIH-3T3 cells subjected to different concentrations of peptide treatment under 5 ng/ml rat TGF-β1 stimulation for 24 h. (A) Flow cytometric histograms showing cell distributions in the G0/G1, S and G2/M phases of the cell cycle. (B and C) Quantification of the DNA content in the G0/G1, S and G2/M phases. This study was conducted in duplicate, and the data from one representative experiment are shown.
Pep70 suppressed TGF-β-induced gene and protein expression of α-SMA, COL1A1 and TGF-β1
A hallmark of HSC activation is overexpression of α-SMA and increased production of COL1A1 and fibronectinCitation26,Citation27. Additionally, the activation of HSCs increases the responsiveness to TGF-β1 through the up-regulation or de novo expression of TGF-β1 receptorsCitation28. Therefore, TGF-β1 is an established and potent profibrogenic mediator in the progression of liver fibrosisCitation29,Citation30. Here, rat TGF-β1 was used as a fibrosis stimulant in cultured fibroblasts. Blocking the TGF-β signalling pathway can inhibit the fibrotic response by leading to the down-regulated expression of COL1A1 induced by TGF-β and the myofibroblast phenotype marker α-SMA. To investigate the anti-fibrotic activity of the screened peptides, the expression levels of three fibrotic indicators (α-SMA, COL1A1 and TGF-β1) were analysed at both the transcriptional and translational levels. HSC-T6 and NIH-3T3 cells were pre-incubated with different concentrations (10–100 μM) of peptides for 1 h and then treated with rat TGF-β1 (5 ng/mL) for 24 h. The data from real-time qPCR () showed that the expression levels of these three fibrotic genes were all significantly up-regulated by rat TGF-β1, but the up-regulated mRNA levels could be reduced by the screened peptides. shows that Pep70 reduced the level of α-SMA mRNA in a dose-dependent manner in HSC-T6 cells, indicating its potential inhibitory effects on myofibroblast differentiation. Furthermore, a similar suppressive effect of Pep70 against NIH-3T3 cells was also observed. In addition, this peptide caused a dose-dependent attenuation of COL1A1 mRNA levels. The proportional decline in COL1A1 mRNA levels reached 47.6% and 42.8% with a Pep70 dose of 10 μM, confirming that Pep70 abrogated TGF-β-induced collagen protein accumulation. Similarly, the TGF-β1 mRNA level was also down-regulated by Pep70, and this inhibition was more pronounced than for ADP355 at a dose of 100 μM. Interestingly, as shown in , among these three screened peptides, Pep70 exhibited the most marked suppression of the protein expression of α-SMA, COL1A1 and TGF-β1 in both in vitro cell lines. This inhibitory effect was similar to the positive control peptide ADP355. In NIH-3T3 cells, the average grey value of these three proteins in the Pep70-treated group was much lower than in the model group (2.8 versus 0.9, 2.1 versus 1.1 and 3.4 versus 2.1). Moreover, the decreased intensities of the different protein bands were also observed compared with the model group in TGF-β1-stimulated HSC-T6 cells (2.5 versus 1.2 for α-SMA, 2.4 versus 1.8 for COL1A1 and 3.6 versus 0.9 for TGF-β1). Taken together, Pep70 is believed to be a promising anti-fibrotic peptide.
Figure 4. Representative western blot analysis of HSC-T6 (A) and NIH-3T3 (B) cells treated with PBS or 10 μM screened peptides in the presence of 5 ng/ml rat TGF-β1 for 24 h. The protein expression levels of α-SMA, COL1A1 and TGF-β1 were probed. GAPDH served as the loading control, and PBS served as the control (Ctl), while only 5 ng/ml TGF-β1 stimulation served as the model (Model). This experiment was repeated three times under the same conditions, and one representative set of results are presented.
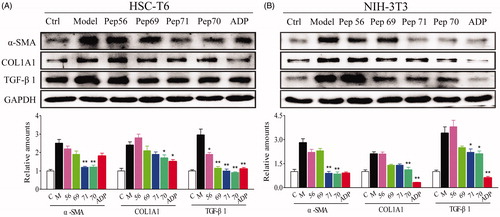
Table 5. The relative mRNA levels of α-SMA, COL1A1 and TGF-β1 in HSC-T6 and NIH-3T3 cells.
Docking studies
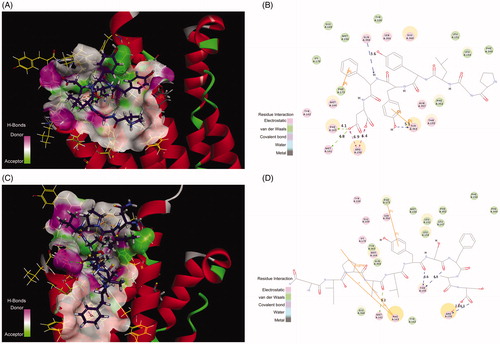
Interestingly, a crystal structure of human adiponectin receptor 1 was recently published (PBD id: 3WXV), and its structure is similar with our homology model, especially the loop1 (). Meanwhile, docking the peptides to the crystal structure led to a similar result with our model () in that Lys35 (Lys170 in 3WVX) was in both interactions. Additionally, the docking pose analysis of Pep70 () revealed hydrogen bonding interactions and π–π interactions that exist in both peptide–protein complexes. Combined with the H-bonding surface plot, the binding site of the complex was shown as a long and narrow cavity. Pep70 was led to entering the cavity through the hydrogen bonding interactions with Gln359, Arg158 and Tyr353. In addition, π–π interactions were formed with Phe173 and Tyr353, which allowed the entire Pep70 peptide to be embedded in the cavity. Compared with the docking pose of ADP355 (), the most active AdipoR1 agonist peptide Pep70 shared a similar binding mode, including a self π–π interaction with Phe173 of 3WVX and H-bond interactions with Arg158 of 3WVX that stabilised their structures. In addition, for Pep70, a π–π interaction formed with Phe173 of 3WVX makes Pep70 embed deeper into the cavity, which may potentially make Pep70 show a comparable activity to ADP355.
Figure 5. (A) Superposition of our homology model of adiponectin receptor 1 (yellow) and the crystal structure of adiponectin receptor 1 (PDB id: 3WXV; grey; 135–355 region). The RMSD between Cα atoms was 6.64 Å. (B) The binding mode of Pep70 docked to the 3WXV. 3WXV is shown as a line representation. Pep70 (purple) and the residues involved in the interaction (yellow) are displayed as a stick representation. Hydrogen bonds are depicted by the green dotted lines. Pi–pi interactions are depicted by the orange solid lines.
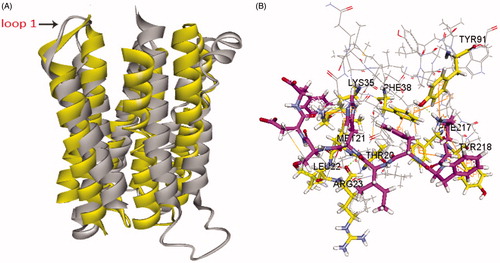
Figure 6. (A) The H-bond interactions between Pep70 and crystal structure 3WVX with the crystal structure of 3WVX shown as a line representation. Pep70 (purple) and the residues involved in the interaction (yellow) are displayed as a stick representation. Hydrogen bonds are depicted by the green dotted lines. Pi–pi interactions are depicted by the orange solid lines. (B) Plot of the interactions between Pep70 and 3WVX. (C) The binding mode of ADP355 to 3WVX. (D) Plot of the interactions between ADP355 and 3WVX.
Conclusions
In conclusion, we constructed the structure of AdipoR1 by homology modelling in silico. The putative active site of the model was further explored by docking to known active peptides. Virtual screening was carried out with a set of 747 manually designed peptides. Three peptides with high docking scores were evaluated in vitro for their anti-fibrotic activities, and the novel peptide Pep70 with promising anti-fibrotic effects was obtained. However, to achieve a higher level of bioactivity, further studies of Pep70 are needed.
The work presented here provides a reliable model of AdipoR1 and a better understanding of the interactions between the peptide and AdipoR1. Virtual screening and biological activity studies on early leads provided initial validation of this approach and will facilitate screening for additional AdipoR1 agonists.
Compliance with ethical standards
None human participants or animals were involved in our studies.
Acknowledgements
This work was supported by a grant from the National Natural Science Foundation of China (No. 81573348).
Disclosure statement
The authors report no conflicts of interest.
Additional information
Funding
References
- Wynn TA. Cellular and molecular mechanisms of fibrosis. J Pathol 2008;214:199–10.
- Wynn TA, Ramalingam TR. Mechanisms of fibrosis: therapeutic translation for fibrotic disease. Nat Med 2012;18:1028–40.
- Deng YL, Xiong XZ, Cheng NS. Organ fibrosis inhibited by blocking transforming growth factor-beta signaling via peroxisome proliferator-activated receptor gamma agonists. Hepatobiliary Pancreat Dis Int 2012;11:467–78.
- Friedman SL, Sheppard D, Duffield JS, et al. Therapy for fibrotic diseases: nearing the starting line. Sci Transl Med 2013;5:167.
- Fang F, Liu L, Yang Y, et al. The adipokine adiponectin has potent anti-fibrotic effects mediated via adenosine monophosphate-activated protein kinase: novel target for fibrosis therapy. Arthritis Res Ther 2012;14:R229.
- Mishra R, Cool BL, Laderoute KR, et al. AMP-activated protein kinase inhibits transforming growth factor-beta-induced Smad3-dependent transcription and myofibroblast transdifferentiation. J Biol Chem 2008;283:10461–9.
- Scherer PE, Williams S, Fogliano M, et al. A novel serum protein similar to C1q, produced exclusively in adipocytes. J Biol Chem 1995;270:26746–9.
- Handy JA, Fu PP, Kumar P, et al. Adiponectin inhibits leptin signalling via multiple mechanisms to exert protective effects against hepatic fibrosis. Biochem J 2012;440:385–95.
- Otvos L Jr, Haspinger E, Russa FL, et al. Design and development of a peptide-based adiponectin receptor agonist for cancer treatment. BMC Biotechnol 2011;11:90.
- Miele M, Costantini S, Colonna G. Structural and functional similarities between osmotin from Nicotiana tabacum seeds and human adiponectin. PLoS One 2011;6:2.
- Yamauchi T, Iwabu M, Okada-Iwabu M, et al. Adiponectin receptors: a review of their structure, function and how they work. Best Pract Res Clin Endocrinol Metab 2013;28:15–23.
- Zoete V, Grosdidier A, Michielin O. Docking, virtual high throughput screening and in silico fragment-based drug design. J Cell Mol Med 2009;13:238–48.
- Kellenberger E, Rodrigo J, Muller P, et al. Comparative evaluation of eight docking tools for docking and virtual screening accuracy. Proteins 2004;57:225–42.
- Shen MY, Sali A. Statistical potential for assessment and prediction of protein structures. Protein Sci 2006;15:2507–24.
- Lovell SC, Davis IW, Arendall WB, et al. Structure validation by Calpha geometry: phi,psi and Cbeta deviation. Proteins 2003;50:437–50.
- Chen ZJ, Jin W, Liu H, et al. Discovery of peptide ligands for hepatic stellate cells using phage display. Mol Pharm 2015;12:2180–8.
- Wallace MC, Friedman SL. Hepatic fibrosis and the microenvironment: fertile soil for hepatocellular carcinoma development. Gene Expres 2014;16:77–84.
- Leibiger C, Kosyakova N, Mkrtchyan H, et al. First molecular cytogenetic high resolution characterization of the NIH 3T3 cell line by murine multicolor banding. J Histochem Cytochem 2013;61:306–12.
- Jainchill JL, Aaronson SA, Todaro GJ. Murine Sarcoma and Leukemia viruses: assay using clonal lines of contact-inhibited mouse cells. J Virol 1969;4:549–53.
- Otvos L Jr, Wade JD. Current challenges in peptide-based drug discovery. Front Chem 2014;2:62.
- Wang HF, Zhang H, Zhang ZM, et al. Adiponectin-derived active peptide ADP355 exerts anti-inflammatory and anti-fibrotic activities in thioacetamide-induced liver injury. Sci Rep 2016;6:19445.
- Kumar P, Smith T, Rahman K, et al. Adiponectin agonist ADP355 attenuates CCl4-induced liver fibrosis in mice. PLoS One 2014;9:e110405.
- Tsai TH, Ma HI, Liu MY. Pigment epithelium-derived factor 34-mer peptide prevents liver fibrosis and hepatic stellate cell activation through down-regulation of the PDGF receptor. PLoS One 2014;9:e95443.
- Tang Y, Hu C, Liu Y. Effect of bioactive peptide of Carapax Trionycis on TGF-β1-induced intracellular events in hepatic stellate cells. J Ethnopharmacol 2013;148:69–73.
- Lopez-Mejia IC, Fajas L. Cell cycle regulation of mitochondrial function. Curr Opin Cell Biol 2015;33:19–25.
- Novo E, Cannito S, Paternostro C, et al. Cellular and molecular mechanisms in liver fibrogenesis. Arch Biochem Biophys 2014;548:20–37.
- Dees C, Distler JHW. Canonical Wnt signalling as a key regulator of fibrogenesis – implications for targeted therapies? Exp Dermatol 2013;22:710–13.
- Gressner AM, Weiskirchen R, Breitkopf K, et al. Roles of TGF-beta in hepatic fibrosis. Front Biosci 2002;7:d793–807.
- Biancheri P, Giuffrida P, Docena GH, et al. The role of transforming growth factor (TGF)-β in modulating the immune response and fibrogenesis in the gut. Cytokine Growth Factor Rev 2014;25:45–55.
- Meng XM, Tang PM, Li J, et al. TGF-β/Smad signaling in renal fibrosis. Front Physiol 2015;6:82.