
Abstract
Protein tyrosine phosphatase 1B (PTP1B) and α-glucosidase are important targets to treat obesity and diabetes, due to their deep correlation with insulin and leptin signalling, and glucose regulation. The methanol extract of Paulownia tomentosa fruits showed potent inhibition against both enzymes. Purification of this extract led to eight geranylated flavonoids (1–8) displaying dual inhibition of PTP1B and α-glucosidase. The isolated compounds were identified as flavanones (1–5) and dihydroflavonols (6–8). Inhibitory potencies of these compounds varied accordingly, but most of the compounds were highly effective against PTP1B (IC50 = 1.9–8.2 μM) than α-glucosidase (IC50 = 2.2–78.9 μM). Mimulone (1) was the most effective against PTP1B with IC50 = 1.9 μM, whereas 6-geranyl-3,3′,5,5′,7-pentahydroxy-4′-methoxyflavane (8) displayed potent inhibition against α-glucosidase (IC50 = 2.2 μM). All inhibitors showed mixed type Ι inhibition toward PTP1B, and were noncompetitive inhibitors of α-glucosidase. This mixed type behavior against PTP1B was fully demonstrated by showing a decrease in Vmax, an increase of Km, and Kik/Kiv ratio ranging between 2.66 and 3.69.
Introduction
Protein tyrosine phosphatase 1B (PTP1B) is known to be a negative regulator of both insulin and leptin signalling pathways, and plays a role in glucose homeostasis and body weight regulationCitation1. α-Glucosidase is a membrane bound enzyme in small intestine having a key role in carbohydrates hydrolysis. Thus PTP1B and α-glucosidase are attractive targets to treat obesity and diabetes, because these conditions are associated with increased PTP1B and α-glucosidase activitiesCitation2. In this study we found that the methanolic extract from paulownia tomentosa fruits significantly inhibited both PTP1B and α-glucosidase enzymes. We proceeded to undertake a thorough kinetic analysis of the inhibition of these two enzymes by the compounds present in the extract.
Protein tyrosine phosphatase 1B (PTP1B) is a non-transmembrane phosphatase, which belongs to PTPs enzymes family and is highly expressed in the tissues targeted by insulin such as liver, muscle, and fatCitation3. It catalyzes the de-phosphorylation of activated insulin receptor, and hence downregulates insulin signalling, additionally it also negatively regulates leptin signalling and contributes to obesity and metabolic disordersCitation4. Moreover, high insulin sensitivity and resistance to obesity has been reported in PTP1B deficient mice undergoing through insulin and glucose tolerance testsCitation5. Thus inhibition of PTP1B has been suggested as a promising approach for the treatment of type 2 diabetes (T2DM) and prevention of obesityCitation6. α-Glucosidase (EC 3.2.1.20) is an exo-acting enzyme, which contributes to glycoprotein processing and carbohydrate metabolismCitation7. Additionally, it speeds up the final step of carbohydrate hydrolysis, and provides high amount of intestine absorbable glucose. Therefore, α-glucosidase inhibition retards the cleavage of complex carbohydrates resulting in decreased postprandial hyperglycaemia, ultimately ameliorating complications associated with T2DM. α-Glucosidase inhibition can also greatly effect glycan structure which further affects the maturation, secretion and other important functions of glycoproteinsCitation8,Citation9. Interestingly, bioactive constituents which simultaneously inhibit α-glucosidase and PTP1B enzymes display synergistic effect to antagonize hyperglycaemia and hence significantly improve insulin sensitization. So bioactive compounds with this dual inhibition profile may be promising therapeutic lead structures, which could effectively contribute in the treatment of T2DM, reduce the hyperglycaemia and suppress the accompanied hazards.
Paulownia tomentosa (Thunb.) Siebold & Zucc. ex Steud is a deciduous tree belonging to Paulowniaceae family, which is distributed widely in Korea, Japan and China. Phytochemical studies have revealed that a diverse array of metabolites like iridoids, lignans and flavonoids are present in this plantCitation10,Citation11. Particularly geranylated flavonoids are the major bioactive components, an observation that has attracted much attention due to their diverse biological applications.Citation12 Previously multiple studies have explored the antimicrobial, cytotoxic, and antioxidant effects of these individual compounds, as well as some enzymes inhibitory activities such as targeting neuraminidase and human acetylcholinesterase have also been reportedCitation13–15.
In the present study the P. tomentosa fruits extract was characterized for their role as a source of PTP1B and α-glucosidase inhibitors. From preliminary screen we identified eight bioactive compounds, which displayed dual inhibitory functions against PTP1B and α-glucosidase. All bioactive compounds were able to inhibit both enzymes, however, their inhibitory potencies and mode of actions varied according to their skeletons. Furthermore, detailed kinetic mechanisms were fully characterized by using Lineweaver–Burk plot, Dixon plot and Yang’s method.
Materials and methods
Instruments and chemicals
Column chromatography was carried out with reversed phase C18 (ODS-A, 12 nm, S-150 μM, YMC), Silica gel (230–400 mesh, Merck), and Sephadex LH-20 (Pharmacia Biotech AB, Uppsala, Sweden) columns. All organic solvents used for extraction and isolation were first grade. Medium pressure liquid chromatography (MPLC) instrument was applied for separation purposes. In addition silica gel and reversed-phase cartridges purchased from Teledyne Isco were also used. TLC plates pre-coated with silica gel 60 F254 (0.25 mm, normal phase, Merck) were utilized for thin layer chromatography (TLC). Visualization of TLC plates was done by a UVGL-58 254 nm hand-held UV lamp (UVP, Cambridge, UK. 13C and 1H-NMR, and 2 D NMR experiments were acquired using a Bruker AM 500 (1H-NMR at 500 MHz, 13C-NMR at 125 MHz) spectrometer (Bruker, Karlsruhe, Germany). Different NMR solvents like CD3OD, CDCl3 and DMSO-d6 with TMS as internal standard (Andover, MA) were used. JEOL JMS-700 mass spectrometer (JEOL, Tokyo, Japan) was used to get EIMS and HREIMS data. Jasco J-715 CD spectropolarimeter (Gross-Umstadt, Germany) was used for measuring Circular Dichroism (CD) spectra in methanol (ca 0.1 mg/mL). Melting points were measured on an Electro Thermal 9200, UK. SpectraMax M3 multi-mode microplate reader (Molecular devices, Sunnyvale, CA) was used to measure the enzymatic hydrolysis.
Plant material
The fruits of P. tomentosa were collected in July 2010, at Jinju, near Gyeongsang National University, Gyeongsangnam-do, South Korea. The sample was identified by Prof. Jae Hong Park and a voucher specimen (KHPark 071210) was deposited at the herbarium of Kyungpook National University, Daegu, South Korea.
Extraction and isolation
The dried fruits of P. tomentosa (0.5 kg) were extracted with methanol (12 L) at room temperature for one week. The filtrate was concentrated to a black residue (115 g), which was washed with hexane (5 × 0.5 L) to remove oily components. After that the methanol extract (26 g) was chromatographed on silica gel (10 × 30 cm, 230–400 mesh, 720 g), eluted with a gradient of n-hexane and ethylacetate (20:1 to 1:2), to give ten different fractions (A–J). Fractions (D–G, 13 g) enriched with chromophoric compounds were fractionated by column chromatography on silica gel (5 × 40 cm, 800 g) and eluted with n-hexane to ethylacetate (50:1 to 0:1) to give 20 subtractions (A1-A20). Subfractions (A6-A15, 4.2 g) enriched with compounds (1–8) were fractionated through MPLC using a C18 column (130 g) with a gradient elution, using gradual increase in MeOH (0–100%) in H2O having flow rate of 16 ml/min, affording 40 subfractions (B1-B40). Subfractions (B12-B19, 0.56 g) containing compounds 4 and 8 were further chromatographed by MPLC using a C18 column, and eluted with MeOH (0–100%) in H2O, which yielded compounds 4 (18 mg) and 8 (26 mg). Subfractions (B21-B23, 0.38 g) enriched with compounds 6 and 7 were further chromatographed over a sephadex LH 20 column, using MeOH-H2O (80:20) to give compounds 6 (16 mg) and 7 (13 mg). Subfractions (B27-B35, 0.78 g) containing compounds 1, 2, 3, and 5 were further chromatographed over MPLC using a C18 column, eluted with MeOH (0-100%) in H2O, which gave compounds 1 (27 mg), 2 (18 mg), 3 (23 mg) and 5 (12 mg). All isolated compounds were identified by comparison with previously reported spectroscopic data (Supplementary materials)Citation16,Citation17.
PTP1B enzymatic assay
The PTP1B inhibitory assay was carried out using a slight modification to literature reported methodCitation18. p-nitrophenyl phosphate (pNPP) was used as a substrate for the measurement of enzyme activity. Buffer solution consisted of 25 mM Tris–HCl (pH 7.5), 2 mM β-mercaptoethanol, 1 mM (ethylenediaminetetraacetic acid) EDTA, and 1 mM dithiothreitol (DTT). The assay was performed by adding 10 μL test compound solution to 20 μL of enzyme (1 μg/ml), and then mixing with 40 μL of 4 mM pNPP in 130 μL of the given buffer using 96 well plate at 37 °C for 10 min. During the enzymatic reaction, pNP was produced as a result of pNPP dephosphorylation which was monitored by Spectra Max M3 multi-mode microplate reader at 405 nm for 30 min. NaVO4 was used as positive control for inhibition. The experiments were carried out in triplicate, and the samples concentration needed to inhibit 50% of enzyme activity under the assay conditions were defined as the IC50 values. Lineweaver–Burk and Dixon plots methods were used to determine kinetic parameters. Sigma Plot (SPCC Inc., Chicago, IL) was used to calculate these parameters.
α-Glucosidase enzymatic assay
The α-glucosidase inhibitory activity was measured using reported experimental method with slight modificationsCitation19. Phosphate buffer [50 mM potassium phosphate (pH 6.8)] was used for the whole assay. p-nitrophenyl-α-d-glucopyranoside (pNPG) was used as substrate, whose concentration 1.2 mM was prepared in phosphate buffer. Stock solution of α-glucosidase (EC 3.2.1.20. from Baker’s Yeast) containing 0.45 units of enzyme was also prepared in phosphate buffer. DMSO was used as a solvent for dissolving the test compounds, which were then diluted to their respective concentrations. Enzymatic assay was performed by mixing 40 μl of substrate (final concentration 0.15 mM) with 10 μl of inhibitors/vehicle, 130 μl phosphate buffer and 20 μl of enzyme in 96 well plate. As a result of the catalytic reaction, p-nitrophenol was produced as a reaction product which was subsequently measured using spectra max M3 multi-mode microplate reader (Molecular Devices) at 37 °C, at 405 nm for 15 min. The concentrations of the compounds that inhibited 50% of enzyme activity (IC50) was determined by the percent inhibition ratio (percent) which was calculated accordingly: % inhibition = [(rate of control reaction – rate of sample reaction)/rate of control reaction] × 100. The experiments were performed in triplicate.
Enzyme kinetics and progress linear determination
Lineweaver–Burk plots were used for the analysis of enzyme’s inhibitory kinetics, caused by the tested bioactive compounds, and its comparison was performed with the data collected in the absence of inhibitors. Steady-state rates were determined at different inhibitor concentrations and at changing concentrations of substrate, then enzyme inhibition mechanism and related kinetic parameters were determined. Where applicable, KI and KIS, the two inhibition constants, when inhibitor binds with either free enzyme or the complex of enzyme–substrate, were derived from secondary plots of the slopes of the straight lines and vertical intercept (1/Vappmax), versus inhibitors concentrations. EquationEquations (1)–(3) are the representatives equations for derivation of KI and KIS, respectivelyCitation20.
(1)
(2)
(3)
To determine enzyme inhibition parameters, an experiment was performed having substrate concentrations range (pNPP; 0.4–1.6 mM, pNPG; 0.075–0.3 mM), and different concentrations of tested compound, as indicated. To find out each curve parameter, a nonlinear regression program was used for data analysis using sigma Plot. Similarly Km and Vmax were derived from Lineweaver–Burk plots. Kik and Kiv rate constants were calculated according to EquationEquations (4)(4) and Equation(5)
(5) proposed by Yang’s methodCitation21. While Excel was used for linear regression analysis.
(4)
(5)
Statistical analysis
All measurements were made in at least triplicate. The results were subject to variance analysis using sigma plot. Differences were considered significant at p < .05.
Results and discussion
Separation and characterization of PTP1B and α-glucosidase inhibitors
The extracts from different solvents (water, methanol, chloroform) were examined for their enzymatic inhibitory activities against PTP1B and α-glucosidase. The enzymes were screened according to standard literature procedures by following the hydrolysis of p-nitrophenyl phosphate for PTP1B and p-nitrophenyl glucopyranoside for α-glucosidase spectrophotometricallyCitation18,Citation19. Among them, the methanol extract displayed the most potent inhibitory activity against both PTP1B (IC50 = 35 μg/ml) and α-glucosidase (IC50 = 82 μg/ml). Next we conducted phytochemical investigations to isolate compounds responsible for this inhibition. This was achieved via repeated column chromatography (CC) over silica gel, octadecyl-functionalized silica gel and Sephadex LH-20, these efforts led to the isolation of eight bioactive compounds. Structure identification of these compounds were carried out by spectroscopic analysis, and their comparison with published data (Supplementary materials). All compounds shared a common feature, they were adorned with a geranyl group at the C-6 position of the flavonoid skeleton. The isolated compounds were identified as mimulone (1), 3′-O-methyldiplacone (2), 4′-O-methyldiplacone (3), 6-geranyl-3′,5,5′,7-tetrahydroxy-4′-methoxyflavanone (4), 3′-O-Methyl-5′-O-methyldiplacone (5), 3′-O-methyldiplacol (6), 4′-O-methyldiplacol (7), and 6-geranyl-3,3′,5,5′,7-pentahydroxy-4′-methoxyflavaneCitation16,Citation17 (8) ().
PTP1B inhibitory activities
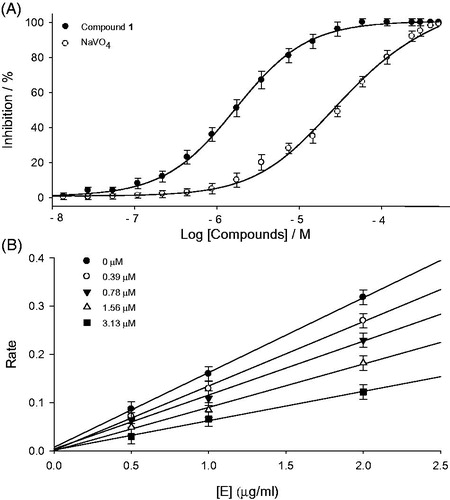
First of all, the individual isolated constituents (1–8) from P. tomentosa fruits were tested in an in vitro PTP1B inhibition assay, using recombinant human protein tyrosine phosphate 1B (EC 3. 1. 3. 48)1. All the isolated flavonoids (1–8) exhibited significant inhibition, having IC50 values in the range of 1.9–8.2 μM. However, the observed activities were slightly affected by subtle changes in compounds structures, the most effective compound was flavanone 1 (IC50 = 1.9 μM), whereas geranyl group was found to be a critical functionality for PTP1B inhibition. Because its mother compound, naringenin showed much lower inhibition with 130.1 μM of IC50Citation23. Comparing with other inhibitors, the potent activity of 1 was attributable to the presence of hydroxyl group at 4′-position on B-ring: 2 (IC50 = 3.9 μM) vs. 4 (IC50 = 5.9 μM), and 5 (IC50 = 3.8 μM) vs. 4 (IC50 = 5.9 μM). shows dose-dependent inhibitory effects of the most effective compound 1 and NaVO4 which is a known PTP1B inhibitor and used as a positive control.
Figure 1. Chemical structures of isolated geranyl compounds (1–8) from the fruits of P. tomentosa.
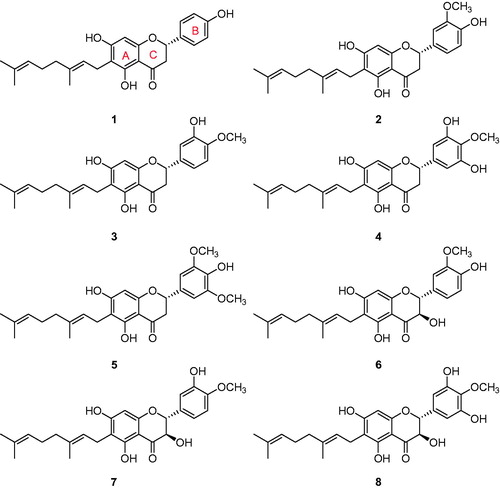
Figure 2. (A) Inhibitory effect of compound (1) and positive control (NaVO4) on PTP1B activity. (B) Determination of the reversible inhibitory mechanism of compound 1 on PTP1B. Data represent the results of three independent experiments performed in triplicates for each sample.
Kinetic analysis of PTP1B inhibitors
Kinetic assays were repeated in the presence of different concentrations of compounds (1–8) to further characterize inhibition of p-nitrophenylphosphate hydrolysis. The inhibition of PTP1B by the most effective compound 1 is illustrated in , respectively. A plot was drawn by the initial velocity versus enzyme concentration in the presence of different concentrations of compound 1. The slope decreased upon increasing inhibitor concentrations, indicating that compound 1 is a reversible inhibitor (). All inhibitors manifested a similar relationship between enzyme activity and concentration. The Ki values of representative compounds 1 and 6 were determined to be 0.8 μM and 3.8 μM, respectively (). Similarly the Ki values of all tested compounds ranged from 0.8 to 8.1 μM ().
Figure 3. (A–D) Kinetic assays of PTP1B inhibition, caused by compounds 1 and 6. (A and B) Lineweaver–Burk plots were constructed for the inhibition of PTP1B. The plots are expressed as 1/velocity (1/V) versus 1/substrate (1/[S]) with or without inhibitors. Insets (I) and (II) represents the secondary plots of the slopes and the intercepts of the straight lines versus concentrations of compound 1 and 6. (C and D) Dixon plots for inhibition of PTP1B by compound 1 and 6, respectively.
![Figure 3. (A–D) Kinetic assays of PTP1B inhibition, caused by compounds 1 and 6. (A and B) Lineweaver–Burk plots were constructed for the inhibition of PTP1B. The plots are expressed as 1/velocity (1/V) versus 1/substrate (1/[S]) with or without inhibitors. Insets (I) and (II) represents the secondary plots of the slopes and the intercepts of the straight lines versus concentrations of compound 1 and 6. (C and D) Dixon plots for inhibition of PTP1B by compound 1 and 6, respectively.](/cms/asset/f2855da4-1974-4861-bfbd-c76d14042b21/ienz_a_1368502_f0003_b.jpg)
Table 1. Inhibitory activities on PTP1B and α-glucosidase of isolated compounds.
Further kinetic analysis showed that compounds 1 and 6 exhibited a mixed type inhibition, because increasing concentrations of substrate resulted in a family of lines which shared a common intercept on the left of the vertical axis and above the horizontal axis (). More detailed parameters can be derived by changing the concentrations of substrate and inhibitors, followed by measurement of residual enzyme–substrate complex. This can help to specifically identify the predominant mode of inhibition, in the two possible mechanisms (Mixed type Ι and ΙΙ)Citation24. In this regard parameters KI and KIS which reflect the affinity of compound 1 either for free enzyme or substrate bound enzyme, can be fitted to EquationEquations (2)(2) and Equation(3)
(3) . As a result the values of these constants, when the inhibitor binds with free enzyme (KI) and with enzyme-substrate complex (KIS) were obtained from the secondary plots of the Km and Vmax versus compound 1 concentration respectively. This analysis showed that compound 1 had the following attributes: KI = 0.4 and KIS = 2.2 ( inset), which indicates that the affinity of inhibitor for free enzyme was stronger than that for enzyme-substrate complex. Thus Compound 1 was accordingly assigned as a mixed type Ι inhibitor of PTP1B. Interestingly, inset shows that compound 6 was also a mixed type Ι inhibitor.
α-Glucosidase inhibitory activities
Similarly the isolated flavonoids (1–8) were also examined for inhibitory activities against α-glucosidase. All compounds showed significant α-glucosidase inhibition with IC50s in the range of 2.2–78.9 μM (). Among the tested compounds the potency of compound 8 (IC50 = 2.2 μM) can be favourably compared with numerous sugar derived α-glucosidase inhibitors which are currently used as therapeutics, such as voglibose (IC50 = 24.5 μM)Citation22. Our results shows some interesting facets of the SAR: it appeared that better inhibition was observed when there were two free hydroxyl groups on C-3´ and C-5´ positions in the B-ring. This can be seen by comparing compound 4 (IC50 = 6.5 μM) with methylated analogue 5 (IC50 = 78.9 μM). There was not much difference in the potencies of dihydroflavonol (6 and 7) and their flavanone analogues (2 and 3) as shown in . On the other hand dihydroflavonol 8 (IC50 = 2.2 μM) was more effective than its analog 4 (IC50 = 6.5 μM).
Figure 4. (A) Inhibitory effects of compounds (1–8) on α-glucosidase activity. (B and C) Linweaver–Burk plots of compounds 4 and 8 for the inhibition of α-glucosidase catalyzed hydrolysis of p-nitrophenyl glucopyranoside. (D and E) Dixon plots of inhibition of α-glucosidase by compounds 4 and 8, respectively, which were used for determination of Ki values.
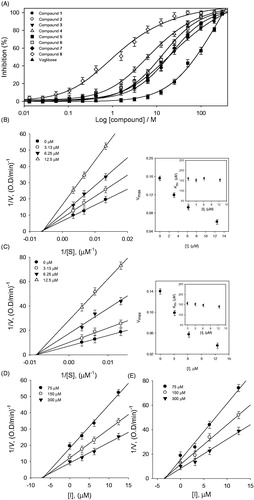
Table 2. Effect of different concentrations of compound 1 on Vmax, Km, and the Kik to Kiv ratio using PTP1B and α-glucosidase.
Kinetic analysis of α-glucosidase inhibitors
The α-glucosidase inhibitory properties of isolated compounds (1–8) were also modelled using double reciprocal plots such as Lineweaver–Burk and Dixon plots. This analysis showed that Vmax decreased without changing Km in presence of increasing concentrations of inhibitors 4 and 8 (). The x-intercept (−1/Km) was unaffected by inhibitor concentrations, whereas 1/Vmax increased. These features indicate that compounds 4 and 8 exhibited noncompetitive inhibitory characteristics towards α-glucosidaseCitation25. The Ki values of these flavonoids were easily measured from Dixon plots (). The Dixon plots of compounds 4 and 8 displayed in (). All inhibitors showed a similar relationship between enzyme activities and enzyme concentrations (Supplementary materials).
To further confirm the inhibitory behaviour of compound 1 towards PTP1B and α-glucosidase, the results were analysed using Yang’s methodCitation21. According to this procedure: Km and Vmax are plotted against the inhibitor concentrations, the new kinetic constants Kik can be fit to EquationEquation (4)(4) ), while Kiv can be fit EquationEquation (5)
(5) . From these results of the fit, Kik/Kiv ratio of PTP1B inhibition was observed to be ranging from 2.66 to 3.69, which are further consistent with mixed type inhibition. Kik/Kiv ratio (12.42–27.48) from the kinetics of α-glucosidase accorded with noncompetitive behaviours ().
Conclusions
This study demonstrated that the methanol extract of P. tomentosa fruits showed potent inhibitory activity towards PTP1B and α-glucosidase, both of which are important targets to treat obesity and diabetes. The principal components were identified as geranylated flavonoids (1–8), which showed mixed type inhibition against PTP1B with IC50s = 1.9–8.2 μM and noncompetitive inhibition towards α-glucosidase with IC50s = 2.2–78.9 μM. Furthermore, detailed inhibitory behaviours were inferred from double-reciprocal plots and resulting kinetic parameters: Vmax, Km, Kik, and Kiv. This result indicates that geranylated flavonoids, the most effective constituents of this plant, simultaneously inhibit α-glucosidase and PTP1B enzymes. Such compounds may display synergistic effects to antagonize hyperglycaemia, and hence significantly improve insulin sensitization. Further studies using in vivo diabetic models are necessary to well define the underlying potential of these interesting compounds.
Supplementary materials
Download PDF (5.2 MB)Disclosure statement
The authors report no conflicts of interest.
Additional information
Funding
References
- Yip SC, Saha S, Chernoff J. PTP1B: a double agent in metabolism and oncogenesis. Trends Biochem Sci 2010;35:442–9.
- Bence KK, Delibegovic M, Xue B, et al. Neuronal PTP1B regulates body weight, adiposity and leptin action. Nat Med 2006;12:917–24.
- Bialy L, Waldmann H. Inhibitors of protein tyrosine phosphatases: next-generation drugs? Angew Chem Int Ed Engl 2005;44:3814–39.
- Johnson TO, Ermolieff J, Jirousek MR. Protein tyrosine phosphatase 1B inhibitors for diabetes. Nat Rev Drug Discov 2002;1:696–709.
- Klaman LD, Boss O, Peroni OD, et al. Increased energy expenditure, decreased adiposity, and tissue-specific insulin sensitivity in protein-tyrosine phosphatase 1B-deficient mice. Mol Cell Biol 2000;20:5479–89.
- Montalibet J, Kennedy BP. Therapeutic strategies for targeting PTP1B in diabetes. Drug Discov Today 2005;2:129–35.
- Bojarova P, Kren V. Glycosidases: a key to tailored carbohydrates. Trends Biotechnol 2009;27:199–209.
- Dwek RA, Butters TD, Platt FM, Zitzmann N. Targeting glycosylation as a therapeutic approach. Nat Rev Drug Discov 2002;1:65–75.
- Asano N. Glycosidase inhibitors: update and perspectives on practical use. Glycobiology 2003;13:93–104.
- Smejkal K, Grycova L, Marek R, et al. C-Geranyl compounds from Paulownia tomentosa fruits. J Nat Prod 2007;70:1244–8.
- Schneiderova K, Smejkal K. Phytochemical profile of Paulownia tomentosa (Thunb). Steud. Phytochem Rev 2015;14:799–833.
- Hanakova H, Hosek J, Babula P, et al. C-geranylated flavanones from Paulownia tomentosa fruits as potential anti-inflammatory compounds acting via inhibition of TNF-α production. J Nat Prod 2015;78:850–63.
- Cho JK, Ryu YB, Curtis-Long MJ, et al. Cholinestrase inhibitory effects of geranylated flavonoids from Paulownia tomentosa fruits. Bioorg Med Chem 2012;20:2595–602.
- Zima A, Hosek J, Treml J, et al. Antiradical and cytoprotective activities of several C-geranyl-substituted flavanones from Paulownia tomentosa fruit. Molecules 2010;15:6035–49.
- Lee Y, Ryu YB, Youn HS, et al. Structural basis of sialidase in complex with geranylated flavonoids as potent natural inhibitors. Acta Crystallogr D Biol Crystallogr 2014;D70:1357–65.
- Asai T, Hara N, Kobayashi S, et al. Geranylated flavanones from the secretion on the surface of the immature fruits of Paulownia tomentosa. Phytochemistry 2008;69:1234–41.
- Smejkal K, Babula P, Slapetova T, et al. Cytotoxic activity of C-Geranyl compounds from Paulownia tomentosa fruits. Planta Med 2008;74:1488–91.
- Fang L, Cao J, Duan L, et al. Protein tyrosine phosphatase 1B (PTP1B) and α-glucosidase inhibitory activities of Schisandra chinensis (Turcz.) Baill. J Funct Foods 2014;9:264–70.
- Ryu HW, Cho JK, Curtis-Long MJ, et al. α-Glucosidase inhibition and antihyperglycemic activity of prenylated xanthones from Garcinia mangostana. Phytochemistry 2011;72:2148–54.
- Chiari ME, Vera DMA, Palacios SM, Carpinella MC. Tyrosinase inhibitory activity of a 6-isoprenoid-substituted flavanone isolated from Dalea elegans. Bioorg Med Chem 2011;19:3474–82.
- Yang X, Du Z, Pu J, et al. Classification of difference between inhibition constants of an inhibitor to facilitate identifying the inhibition type. J Enzyme Inhib Med Chem 2013;28:205–13.
- Adisakwattana S, Ngamrojanavanich N, Kalampakorn K, et al. Inhibitory Activity of Cyanidin-3-rutinoside on alpha-glucosidase. J Enzyme Inhib Med Chem 2004;19:313–16.
- Jung HA, Paudel P, Seong SH, et al. Structure related protein tyrosine phosphatase 1B inhibition by naringenin derivatives. Bioorg Med Chem Lett 2017;27:2274–80.
- Uddin Z, Song YH, Curtis-Long MJ, et al. Potent bacterial neuraminidase inhibitors, anthraquinone glucosides from Polygonum cuspidatum and their inhibitory mechanism. J Ethnopharmacol 2016;193:283–92.
- Xie F, Gong S, Zhang W, et al. Potential of lignin from Canna edulis ker residue in the inhibition of α-D-glucosidase: Kinetics and interaction mechanism merging with docking simulation. Int J Biol Macromol 2017;95:592–602.