
 ?Mathematical formulae have been encoded as MathML and are displayed in this HTML version using MathJax in order to improve their display. Uncheck the box to turn MathJax off. This feature requires Javascript. Click on a formula to zoom.
Abstract
We synthesised a new series of sulphonamide-bearing quinazolinone derivatives 5-18 and evaluated their in vitro cytotoxicity in various cancer cell lines (A549, HepG-2, LoVo and MCF-7) and in normal human cells (HUVEC). Compounds 6 and 10 exhibited the higher activity against all the cancer cell lines compared with 5-flourourcil as positive control. The ability of the most promising compounds 6 and 10 to induce cell cycle arrest and apoptosis in breast cancer (MCF-7) cells was evaluated by flow cytometry. Reverse transcriptase-polymerase chain reaction and western blotting were used to evaluate the expression of apoptosis-related markers. We found that the 2-tolylthioacetamide derivative 6 and the 3-ethyl phenyl thioacetamide derivative 10 exhibited cytotoxic activity comparable to that of 5-fluorouracil as reference drug in MCF-7 and LoVo colon cancer cells. Cell cycle analysis showed a concentration-dependent accumulation of cells in the sub-G1 phase upon treatment with both compounds. The Annexin V-fluorescein isothiocyanate/propidium iodide assay showed that the compounds 6 and 10 increased the early and late apoptosis cell death modes in a dose-dependent manner. These compounds downregulated the expression of B-cell lymphoma-2 (Bcl-2), while increasing that of p53, Bcl-2-like protein 4, and caspase-7, at the mRNA and protein levels. Molecular docking of compounds 6 and 10 with Bcl-2 predicted them to show moderate − high binding affinity (6: −7.5 kcal/mol, 10: −7.9 kcal/mol) and interactions with key central substrate cavity residues. Overall, compounds 6 and 10 were found to be promising anticancer and apoptosis-inducing agents.
1. Introduction
Cancer is a life-threatening disease that is considered a major medical challenge worldwideCitation1. Treatments for cancer include surgery, chemotherapy, hormonal therapy, and biological therapyCitation2–4. The choice of treatment is influenced by the site and progression of the disease. Chemotherapy is primarily used for the treatment of metastasis and hypoxic tumours. However, its use is limited by the toxicity of the drugs towards healthy cellsCitation5,Citation6. This toxicity is a result of the low selectivity of existing chemotherapeutic drugs towards cancer cellsCitation7. In addition, the long-term use of chemotherapeutic agents often gives rise to drug resistanceCitation8. The continuous search for new anticancer agents that offer both selectivity towards malignant cells and low potential for resistance is required. Interest in quinazolinone derivatives grew after showing numerous activity in medical chemotherapy such as apoptosis induction and antiangiogenic properties. Idelalisib, afatinib, gefitinib, erlotinib, and lapatinib () are among these compounds that have been reported to exert apoptosis induction and cell cycle arrest in different cancer cellsCitation9–14. The main factors contributing to the interest in these compounds are their good safety profile and potential for oral administrationCitation15,Citation16. Hybridisation has proven to be beneficial in the preparation of new anticancer agents and in overcoming the drawbacks of conventionally used drugsCitation17,Citation18. Therefore, sulphonamides were hybridised with quinazolin-4(3H)-ones to obtain potentially better drug candidates. Sulphonamides mimic the properties of p-aminobenzoic acid and block SH- and NH2-containing enzymes and proteins to exhibit antimicrobial activityCitation19,Citation20.
Figure 1. Quinazoline-containing drugs.
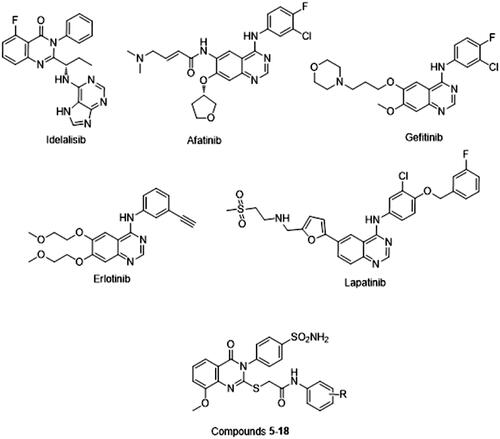
We designed a series of novel compounds using the quinazolinone-sulphonamide hybrid scaffold and explored their in vitro cytotoxic effects against a range of cancer cell lines. The hybrid group was fixed and structural modifications focussed on the replacement of the thiol group at the C-2 position of quinazolines with thioacetamide derivatives bearing substituted phenyl rings. The activities of the target compounds were evaluated against MCF-7, HepG-2, LoVo, and A549 cancer cell lines; the most potent compounds were then evaluated for their pro-apoptotic activity, in order to analyse the underlying anticancer mechanisms. To explore the possible pharmacological properties involved in the anticancer activity, the cell cycle and apoptosis were evaluated by flow cytometry. The target compounds were established to initiate apoptosis, which synergistically enhanced the antitumor effectsCitation21,Citation22. Therefore, the apoptotic effects of the most potent compounds were explored by evaluating caspase-7 activity and by monitoring B-cell lymphoma-2 (Bcl-2) and Bcl-2-like protein 4 (Bax) levels using in vitro and in silico techniques.
2. Results and discussion
2.1. Chemistry
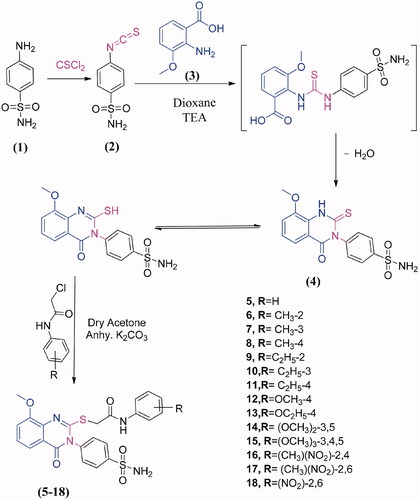
In this work, it seemed of interest to search for new heterocyclic compounds with anticancer activity. A novel series of 3,4-dihydroquinazolinone conjugated to a biologically active benzenesulphonamide moiety was synthesised by the introduction of benzenesulphonamide at the 3-position with the incorporation of different types of acetamide terminal at 2-position aimed at exploring the potential anticancer activity. Scheme 1 shows the synthesis of quinazolinone-benzenesulphonamide derivatives 5–18. The starting material, 4-(2-mercapto-4-oxoquinazolin-3(4H)-yl) benzenesulphonamide (4) was prepared in quantitative yield by cyclocondensation of 4-isothiocyanatobenzenesulfonamide (2)Citation23 and 2-amino-3-methoxybenzoic acid (3) in refluxing 1,4-dioxan containing a catalytic amount of triethylamine. The structure of compound 4 was characterised from correct analytical data as well as its infra-red (IR) spectrum which showed a characteristic bands at 3321, 3262, 3181 cm−1 (NH2), 3055 cm−1 (CH aromatic), 1691 cm−1 (CO), 1620 cm−1 (CN), 1381, 1156 cm−1 (SO2). 1H-NMR spectrum exhibited signals at 3.9 ppm attributed to OCH3 and 12.3 ppm assigned to SH group. 13 C- NMR spectrum revealed signals at 55.7 ppm due to OCH3, 160.5 ppm for C=N and 160.9 ppm attributed to C=O. The coupling of 4 and 2-chloro-N-substituted acetamides in dry acetone, in the presence of anhydrous K2CO3 at room temperature yielded the corresponding 2-((8-methoxy-4-oxo-3-(4-sulfamoylphenyl)-3,4-dihydroquinazolin-2-yl)thio)-N-substituted phenyl acetamides 5–18. The synthesised compounds 5–18 were characterised on the basis of their spectral data. The IR spectra of compounds 5–18 displayed additional NH, NH2, CH aromatic, CH aliphatic, 2CO, CN and SO2 characteristic bands in the assigned regions. Proton nuclear magnetic resonance (1H-NMR) spectra of compounds 5–18 revealed two singlet signal peaks (3.9 − 4.1 ppm, representing the CH2; 7.9 − 10.3 ppm, representing the NH) and the loss of the SH singlet of 3. The 13 C-NMR spectra of compounds 5–18 showed two signals peculiar to the CH2 and CO carbons. The 1H-NMR spectra of compounds 6–8 showed singlet peaks at 2.4, 2.2 and 2.3 ppm, which were attributed to the CH3 groups at the ortho, meta and para- positions of the phenyl group, respectively. The 1H-NMR and 13 C- spectra of compounds 9–11 showed triplets (1.0, 1.1, 1.1 ppm, respectively) and quartettes at 2.5 ppm, attributed to the CH3 and CH2, respectively of the ethyl groups, at the ortho, meta and para positions of the phenyl ring. The 13 C-NMR spectra of compounds 9–11 showed signals corresponding to the CH3 (14.5, 15.9 and 16.1 ppm, respectively) and CH2 (24.0, 28.7, and 28.0, respectively) of the ethyl groups. The IR spectra of compounds 16–18 showed bands corresponding to the NO2 groups in the specified region. The 1H-NMR spectra of 16 and 17 showed singlets at 2.3 and 2.2 ppm, respectively, due to the CH3 group, while the 13 C-NMR showed signals at 19.3 and 18.0 ppm, respectively.
Scheme 1. Synthesis of the sulphonamide bearing methoxyquinazolinone 4-18.
2.2. Biological evaluation
2.2.1. Cytotoxicity screening
The anticancer activity of compounds 5–18 was evaluated against a panel of cell lines, including non-small cell lung carcinoma (A549), liver (HepG2), colon (LoVo), and breast (MCF-7) cancer cell lines, as well as normal human umbilical vein endothelial cells (HUVEC), by 3-(4,5-dimethylthiazol-2-yl)-2,5-diphenyl tetrazolium bromide (MTT) assay. 5-Fluorouracil was used as reference drug. As shown in , the screening results indicated that eight compounds, namely 3, 4-dihydroquinazolin-sulphonamide carrying 2-tolylthioacetamide group at 2-position 6, 3- tolyl 7, 3-ethylphenyl 10, 4-ethylphenyl 11, 4-ethoxyphenyl 13, 3,5-dimethoxyphenyl 14, 3,4,5-trimethoxyphenyl 15 and 2-methyl-4-nitrophenyl 16 exhibited powerful cytotoxic activity against all cancer cell lines compared to 5-flourouracil as positive control. In general, all the tested compounds tended to exhibit better efficacy against MCF-7 cells than against the other cell lines. Among the compounds screened, the 2-tolyl derivative 6 and the 3-ethylphenyl derivative 10 exhibited the most promising activity. The 2-tolyl derivative 6 exhibited good antitumor activity, with half maximal inhibitory concentrations (IC50 values 20.17, 22.64, 45. 57, and 51.50 µM, against MCF-7, LoVo, HepG2, and A549 cell lines, respectively. Interestingly, 2-tolyl derivative 6 was found to be much less cytotoxic towards normal HUVECs (IC50=88.27 µM). The 3-ethylphenyl derivative 10 also exhibited good cytotoxic potency against MCF-7 cells (IC50 = 20.91 µM), LoVo (IC50 = 22. 30 µM), HepG2 (IC50 = 42.29 µM), and A549 (IC50 = 48.00 µM). The presence of the methyl group at 2-position in phenyl ring in compound 6 with IC50 value = 20.17 µM and ethyl group at 3-position in phenyl ring in compound 10 with IC50 value = 20.91 µM lead to an increase in the anticancer activity against human breast cancer cell line MCF-7 compared to the 5-flourouracil as reference drug with IC50 value 95.63 µM. It is clear from the present data that the comparison of the IC50 for the synthesised compounds against human breast cancer cell line MCF-7 follows the order 6 > 10 > 7 > 11 > 14 > 16 > 13 > 15 > 5-fluorouracil with IC50 values 20.17, 20.91, 27.69, 29.40, 34.60, 39.90, 46.72, 74.03, 95.63, respectively. On the other hand, compounds 5, 8, 9, 12, 17 and 18 showed no activity towards all the cell lines. Based on the MTT screening results, compounds 6 and 10 were found to be the most potent against MCF-7 cells, so they were pursued for further investigation.
Table 1. In vitro anticancer activities of compounds 5–18 against A549, HepG2, LoVo, MCF-7 and HUVEC cell lines.
2.2.2. Cell cycle analysis
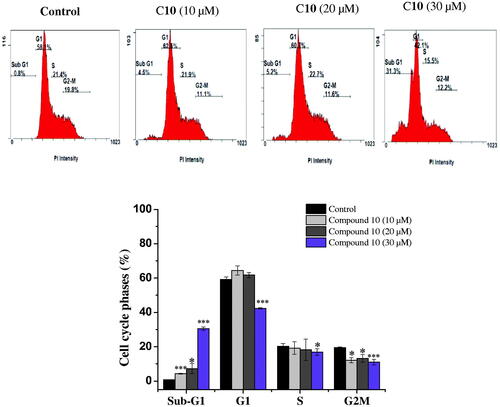
The capacity of anticancer drugs to influence cell cycle distribution can provide an insight into the mechanism of their cytotoxic activityCitation24. In fact, several cell cycle inhibitors have emerged as prospective therapeutic medications for the treatment of several tumoursCitation25. Following the cytotoxicity screening, the effect of the most active compounds 6 and 10 on cell cycle progression in the MCF-7 cell line was evaluated. Compared with untreated cells, MCF-7 cells treated with compounds 6 and 10 had a significantly higher percentage of cells in the sub-G1. This increase in sub-G1 phase cells exhibited dose-dependence. Treatment with 10, 20, and 30 µM of the promising compound 6 increased the proportion of sub-G1 phase cells to 3.35 ± 0.07%, 7.8 ± 0.14%, and 22.85 ± 1.2%, respectively, versus the control (0.75 ± 0.07%) (). Similarly, treatment of MCF-7 cells with the active compound 10 (10, 20, and 30 µM) also caused an accumulation of cells in the sub-G1 phase (4.3 ± 0.28%, 7.25 ± 2. 89% and 30.6 ± 0.07%, respectively), compared to the control (0.75 ± 0.07%) (). This increase in the proportion of sub-G1 phase cells was accompanied by a significant decrease in the percentage of cells in the G1 and G2-M phases. It has been proposed that the increment in the sub-G1 cell fraction is indicative of apoptotic cell deathCitation26, suggesting that both the biologically active compounds 6 and 10 induced apoptosis in MCF-7 cells.
Figure 2. Cell cycle distribution of MCF-7 cells analysed by flow cytometry after treatment with compound 6 at (10, 20 and 30 μM) concentrations for 24 h. The histogram showing the cells percentage in control and treated cells. Columns, average ± SD. *p < 0.05, **p < 0.01 and ***p < 0.001 as compared to control.
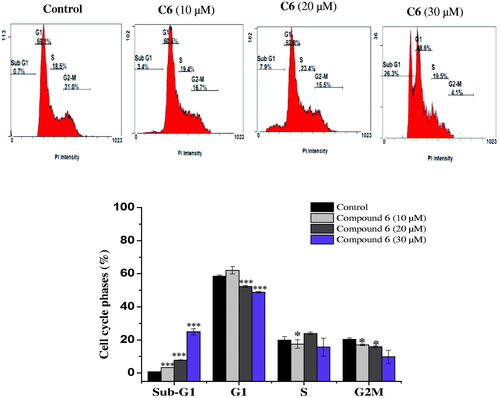
Figure 3. Cell cycle analysis of MCF-7 cells after treatment with compound 10. MCF-7 cells were treated with different concentrations of compound 10 (10, 20, 30 μM) for 24 h, stained with propidium iodide and analysed for cell cycle using flow cytometer. Columns, average ± SD. *p < 0.05, **p < 0.01 and ***p < 0.001 as compared to control.
2.2.3. Quantification of apoptosis
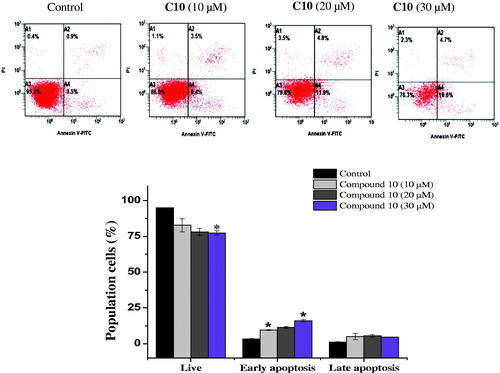
Apoptosis evasion is also a hallmark of the transformation of normal cells into tumour cellsCitation27. Common anticancer drugs aim to induce cell death through apoptosis; this is viewed as a requirement for blocking malignant cell growthCitation28. To verify that apoptotic cell death was caused by the promising compounds 6 and 10, an Annexin V-fluorescein isothiocyanate (FITC)/propidium iodide (PI) assay was used to quantify the cells undergoing apoptosis. In addition to the accumulation of cells in the sub-G1 phase, the Annexin V/PI assay has been widely utilised for the detection of apoptotic cellsCitation29. As shown in , the treatment of MCF-7 cells with compound 6 (10, 20, and 30 µM) for 24 h cells increased the proportion of cells in early apoptosis (7.6 ± 1.4%, 11.4 ± 1.97%, and 18.35 ± 2.4%, respectively), compared to the control group (2.9 ± 0.84%). Similarly, the number of early apoptotic MCF-7 cells increased to 9.55 ± 0.2%, 11.4 ± 0. 7%, and 16 ± 0.84% on 24 h-treatment with 10, 20, and 30 µM compound 10, respectively, compared to the control group (3.3 ± 0.28%). An increase in the number of late apoptotic cells was also observed (). Overall, the flow cytometry data suggested that both compounds induced cell death through the induction of apoptosis, in a dose-dependent manner.
Figure 4. Apoptosis detection in MCF-7 cells using annexin V − FITC/PI double-staining assay. Cells were treated with 10, 20 and 30 μM of C6 for 24 h. Dot plots: Necrotic cells (A1), live cell (A2), late apoptotic cells (A3) and early apoptotic cells (A4). The quantitative analyses of apoptotic cells are shown in bar graphs. Data are expressed as average ± SD of three experiments.
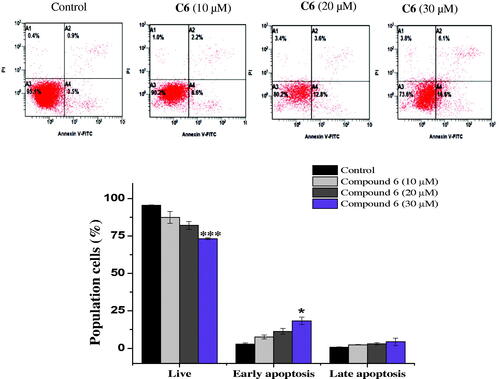
Figure 5. Effect of compound 10 on apoptosis induction of MCF-7 cells treated with various concentrations of C10 (10, 20 and 30 μM) for 24 h. Apoptosis quantification was performed by Annexin V-FITC/PI dual staining assay. Data represents replicates of three experiments, and is expressed as the average ± SD. Data was analysed using the Student’s t test.
2.2.4. Expression of p53, bax, caspase-7 and bcl-2
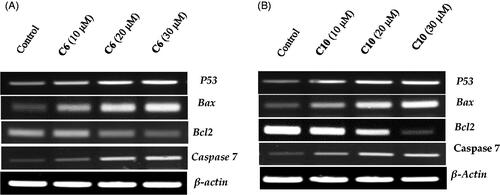
Next, we explored whether the induction of apoptosis caused by the active compounds 6 and 10 was associated with the activation of apoptosis-related genes. Members of the Bcl-2 family, especially the pro-apoptotic Bax and anti-apoptotic Bcl-2 genes, are known to play a crucial role in the regulation of the apoptotic pathway. The Bax and Bcl-2 genes participate in the downstream initialising of caspase proteinsCitation30. Therefore, the expression of key genes and the levels of proteins that control the apoptosis pathway were investigated to evaluate the pro-apoptotic effect of the compounds. The expression of p53, Bax, caspase-7, and Bcl-2 was evaluated using specific primers and antibodies. β-actin was used as an internal control. A remarkable change in the expression of apoptotic genes was reported after 24 h of treatment with increasing concentrations of the two compounds. The expression of p53, Bax, and caspase-7 mRNA increased as compared to the control, when the concentrations of compounds 6 and 10 were increased (). Meanwhile, the expression of Bcl-2 was downregulated with increasing doses of compounds 6 and 10, as compared to that of the control.
Figure 6. Evaluation of the effects of compound 6 (A) and compound 10 (B) on the expression of p53, Bax, caspase-3 and Bcl-2 using reverse transcriptase-polymerase chain reaction. MCF-7 cells were cultured and treated in the presence and absence of compound 6 (10, 20, and 30 μM) (A) and compound 10 (10, 20, and 30 μM) (B). β-actin was used as the internal control.
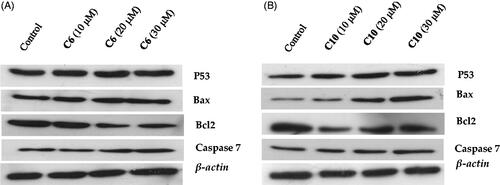
To assess the changes in expression of p53, Bax, Bcl-2, and caspase-7 proteins upon treatment with the compounds, measurements of the protein levels in MCF-7 cells treated with different dosed of compounds 6 and 10 were carried out. Western blot analysis revealed that treatment with compounds 6 and 10 markedly increased the levels of p53, Bax, and caspase-7 (). In contrast, the expression of Bcl-2 was down-regulated; this shift in the Bax/Bcl-2 ratio corresponds with the onset of cell apoptosisCitation31. The activation of caspase-7 was also evident (), indicating the initiation of cellular apoptosis by both compounds.
Figure 7. Evaluation of the effects of compound 6 (A) and compound 10 (B) on the protein levels of p53, Bax, caspase-7 and Bcl-2 by western blotting. MCF-7 cells were cultured and treated in the presence and absence of compound 6 (10, 20, and 30 μM) (A) and compound 10 (10, 20, and 30 μM) (B). β-actin was used as the internal control.
2.3. Structure–activity relationship
By comparing the experimental cytotoxicity of the novel synthesised compounds reported in this study to their structures, the following structure–activity relationships (SAR) were postulated.
The presence of a basic skeleton quinazolin-sulphonamide is necessary for the broad spectrum of cytotoxic activity of the most compounds namlly 6, 7, 10, 11, 13–16 towards different cell lines (A 549, HepG2, LoVo and MCF-7).
Introducing 2-tolyl at 2- position with the biologically active benzenesulphonamide moiety at 3- position and methoxy group at 8- position to the quinazoline 6 enhances the cytotoxic activity against all the cell lines.
Also, the incorporating 3-ethylphenyl at 2- position to quinazoline-sulphonamide 10 lead to increase the cytotoxicity towards all cell lines.
Transformation of 2-tolyl in compound 6 or 3-ethylphenyl in compound 10 to 3-tolyl in compound 7, 4-ethylphenyl in compound 11, 4-ethoxyphenyl in compound 13, 3,5-dimethoxyphenyl in compound 14, 3,4,5- trimethoxyphenyl in compound 15 and 2-methyl-4-nitrophenyl in compound 16 diminshed the anticancer activity towards all the cell lines.
The replacement of 3-ethylphenyl 10 by 4-ethylphenyl 11 lead to decrease the cytotoxic activity against A549, HepG2 and LoVo and MCF-7 cell lines.
In addition the substitution of 3,5-dimethoxyphenyl 14 by 3,4,5-trimethoxyphenyl 15 reduces the anticancer activity towards all the cell lines.
2.4. Molecular docking analysis
Molecular docking simulations for promising compounds were also performed to obtain further understanding into differential cytotoxic action of synthesised compounds. The molecular docking procedure implemented in this study was validated as described by Al Ajmi and co-workersCitation32. The cognate ligand, 1-(2-([(3S)-3-(aminomethyl)-3,4-dihydroisoquinolin-2(1H)-yl]carbonyl)phenyl)-4-chloro-5-methyl-N,N-diphenyl-1H-pyrazole-3-carboxamide (DRO), was extracted from the ligand-bound X-ray co-crystal structure of Bcl-2, and re-docked. The poses of the bound and re-docked ligand were compared, and the root mean square deviation (RMSD) was calculated. The RMSD of the re-docked DRO was found to be 0.3842 Å. Since the calculated RMSD was within the acceptable limit (2.0 Å), we were confident in adopting the docking protocol to predict the binding of compounds 6 and 10 with Bcl-2.
Anti-apoptotic Bcl-2 protein overexpression is frequently linked to several types of cancer. Recently, a lot of attention on developing effective inhibitors to reduce the increased levels of this proteinCitation33,Citation34. In this study, the molecular docking of compounds 6 and 10 with Bcl-2 was performed using Autodock 4.2, and the binding was compared with that of DRO (), ( and ). We found that both compounds 6 and 10 occupied a similar position at the Bcl-2 binding site as DRO ( and ). Analysis of the interactions between compound 6 and Bcl-2 revealed that the protein-ligand complex was stabilised by a hydrogen bond with Asp99, and nine hydrophobic interactions with Phe63, Phe71, Leu96, Arg105, and Ala108 (). The compound 6-Bcl-2 complex was further stabilised by van der Waals’ interactions of the compound with several other residues, including Asp70, Met74, Val92, Glu95, Arg98, Gly104, and Phe112 (). Similarly, compound 10-Bcl-2 complex was stabilised by three hydrogen bonds, with His79, Leu78, and Arg88, and an electrostatic interaction with Arg88. Compound 10 formed a further six hydrophobic interactions with Phe71, Met74, and Ala108 (). Compound 10 also formed a π-sulfur bond with His79 of Bcl-2. Additionally, the Phe63, Tyr67, Asp70, Glu73, Gly77, Val92, Glu95, Leu96, and Phe112 residues of Bcl-2 formed van der Waals’ interactions to stabilise the carvone-Bcl-2 complex (). In comparison, the DRO-Bcl-2 complex was stabilised by a hydrogen bond and an electrostatic interaction with the Asp70 residue (), as well as eleven hydrophobic interactions with Val92, Phe63, Tyr67, Phe71, Met74, Leu96, Arg105, and Ala108 (). The DRO-Bcl-2 complex was further stabilised by van der Waals’ interactions of DRO with the Arg88, Glu95, Gly104, and Phe112 residues of Bcl-2. The binding energies and the corresponding binding affinities of DRO, compounds 6 and 10 towards Bcl-2 were estimated to be −10.2 kcal mol−1 and 3.03 × 10⁷ M−1, −7.6 kcal mol−1 and 3.75 × 10⁵ M−1 and −7.9 kcal mol−1 and 6.23 × 10⁵ M−1, respectively (). It is interesting to note that the Phe63, Tyr67, Phe71, Met74, Leu96, and Ala108 residues of Bcl-2 showed interactions with both compound 6 and DRO, while the Phe63, Tyr67, Phe71, Met74, Val92, Leu96, and Ala108 residues showed interactions with compound 10 and DRO.
Figure 8. (A) 2D cartoon representation of the binding of DRO (control ligand), compound 6 and compound 10 at the binding site of the Bcl-2 protein, and (B) 3D representation of the binding of DRO (control ligand), compound 6 and compound 10 at the binding site of the Bcl-2 protein. DRO, compound 6 and compound 10 are represented by gold, purple and cyan sticks, respectively.
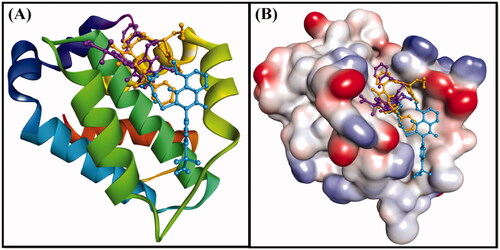
Figure 9. Molecular docking of (A) the control ligand DRO, (B) compound 6, and (C) compound 10, with the Bcl-2 protein.
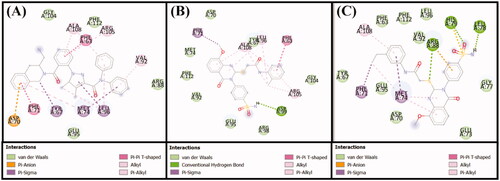
Table 2. Molecular docking of compounds 6 and 10 with Bcl-2
3. Experimental
3.1. Chemistry
The melting points (MP; uncorrected) of the compounds were determined in an open capillary on a Gallen Kamp melting point apparatus (Sanyo Gallen Kamp, UK). Precoated silica gel plates (Kieselgel 0.25 mm, 60 F254, Merck, Germany) were used for thin-layer chromatography. A developing solvent system of chloroform/methanol (8:2) was used, and the spots were visualised using ultraviolet light. The IR spectra (KBr disc) were recorded using a Fourier transform-IR spectrophotometer (Perkin Elmer, USA). A nuclear magnetic resonance spectrophotometer (Bruker AXS Inc., Switzerland) was used for the 1H- and 13 C-NMR experiments, operating at 500 MHz and 125.76 MHz, respectively. Chemical shifts are reported as δ-values (ppm) relative to tetramethylsilane (internal standard), using deuterated dimethyl sulfoxide (DMSO-d6) as the solvent. Elemental analyses were conducted using a model 2400 CHNSO analyser (Perkin Elmer, USA). All results were within ± 0.4% of the theoretical values. All reagents used were of analytical grade.
4–(2-Mercapto-8-methoxy-4-oxoquinazolin-3(4H)-yl) benzenesulfonamide (4)
A mixture of 2-amino-3-methoxybenzoic acid 3 (1.67 g, 0.01 mol), 4- isothiocyanatobenzenesulphonamide 2 (2.14 g, 0.01 mol) in dioxan (30 ml) containing a catalytic amount of triethylamine was refluxed for 8 h and then left to cool. The solid product was collected by filtration and recrystallized from dioxan to yield 4.
4: Yield: 92%. MP: 342–344 °C. IR (KBr, cm−1): 3321, 3262 (NH2), 3055 (aromatic), 1691 (CO), 1620 (CN), 1381, 1156 (SO2). 1H-NMR (DMSO-d6,ppm): 3.9 (s, 3H, OCH3), 7.0–7.7 (m, 5H, Ar-H + SO2NH2), 7.8, 8.0 (2d, 4H, J = 7.1, 7.0 Hz, AB system), 12.3 (s, 1H, SH). 13 C-NMR (DMSO-d6,ppm): 55.7, 116.2, 118.6, 119.8, 120. 6 (2), 127.0, 128.9 (2), 130.1, 134.6, 135.3, 150.4, 160.5, 160.9. MS (m/z, %): 363 (M+) (14.54), 155 (100). Anal. Calcd. for C15H13N3O4S2 (363.41): C, 49.57; H, 3.61; N, 11.56. Found: C, 49.22; H, 3.86; N, 11.31.
3.1.1. General procedure for the synthesis of 3, 4-dihydroquinazolin-sulphonamide derivatives (5–18)
Anhydrous K2CO3 (1.38 g) was added to a mixture of 4 (3.63 g, 0.01 mol) and 2-chloro-N-substituted acetamide derivatives (0.012 mol) in dry acetone (50 ml) and stirred at room temperature for 8 h. The resulting solid was then collected by filtration and crystallised from ethanol to yield compounds 5–18.
2-((8-Methoxy-4-oxo-3–(4-sulphamoylphenyl)-3,4-dihydroquinazolin-2-yl)thio)-N-phenyl-acetamide (5)
5: Yield: 77%. MP: > 350 °C. IR (KBr, cm−1): 3324, 3291, 3164 (NH2, NH), 3056 (aromatic), 2967, 2845 (aliphatic), 1687, 1663 (2 CO), 1619 (CN), 1385, 1155 (SO2). 1H-NMR (DMSO-d6,ppm): 3.8 (s, 3H, OCH3), 4.0 (s, 2H, CH2), 7.3, 7.5 (2d, 4H, J = 7.3, 7.2 Hz, AB system), 7.6 − 8.0 (m, 10H, Ar-H + SO2NH2), 10.3 (s, 1H, NH). 13 C-NMR (DMSO-d6,ppm): 31.3, 56.6, 116.5, 117.4, 118.6 (2), 119.6, 124.8 (2), 126.9, 127.4, 129.2 (2), 130.3 (2), 130.7 (2), 143.1, 143.9, 151.3, 157.8, 159.2, 175.6. MS (m/z, %): 496 (M+) (32.21), 77 (100). Anal. Calcd. for C23H20N4O5S2 (496.56): C, 55.63; H, 4.06; N, 11.28. Found: C, 55.87; H, 4.19; N, 11.49.
2-((8-Methoxy-4-oxo-3-(4-sulphamoylphenyl)-3,4-dihydroquinazolin-2-yl)thio)-N-(o-tolyl) acetamide (6)
6: Yield: 86%. MP: > 350 °C. IR (KBr, cm−1): 3421, 3365, 3154 (NH2, NH), 3077 (aromatic), 2958, 2837 (aliphatic), 1687, 1660 (2 CO), 1618 (CN), 1388, 1156 (SO2). 1H-NMR (DMSO-d6,ppm): 2.4 (s, 3H, CH3), 3.8 (s, 3H, OCH3), 3.9 (s, 2H, CH2), 7.3, 7.4 (2d, 4H, J = 6.8, 6.7 Hz, AB system), 7.5 − 7.9 (m, 9H, Ar-H + SO2NH2), 11.9 (s, 1H, NH). 13 C-NMR (DMSO-d6,ppm): 15.0, 29.3, 56.9, 116.7, 117.3, 118.6, 125.2 (2), 126.9 (2), 130.2 (2), 130.3 (2), 131.2 (2), 133.1 (2), 142.8 (2), 144.4, 160.0, 160.2, 175.8. MS (m/z, %): 510 (M+) (33.32), 91 (100). Anal. Calcd. for C24H22N4O5S2 (510.59): C, 56.46; H, 4.34; N, 10.97. Found: C, 56.18; H, 4.05; N, 11.17.
2-((8-Methoxy-4-oxo-3-(4-sulphamoylphenyl)-3,4-dihydroquinazolin-2-yl)thio)-N-(m-tolyl) acetamide (7)
7: Yield: 78%. MP: > 350 °C. IR (KBr, cm−1): 3311, 3234, 3176 (NH2, NH), 3065 (aromatic), 2912, 2845 (aliphatic), 1691, 1665 (2 CO), 1621 (CN), 1383, 1155 (SO2). 1HNMR (DMSO-d6,ppm): 2.2 (s, 3H, CH3), 3.8 (s, 3H, OCH3), 3.9 (s, 2H, CH2), 7.3, 7.5 (2d, J = 8.1, 8.2 Hz, 4H, AB system), 7.6 − 7.9 (m, 9H, Ar-H + SO2NH2), 10.0 (s, 1H, NH). 13 C-NMR (DMSO-d6,ppm): 21.2, 29.3, 56.9, 116.6, 117.4, 118.6 (2), 124.9, 126.9 (2), 130.3 (2), 130.8 (3), 131.4 (2), 135.6, 136.0, 143.0, 151.3, 158.6, 160.7, 175.7. MS (m/z, %): 510 (M+) (11.62), 77 (100). Anal. Calcd. for C24H22N4O5S2 (510.59): C, 56.46; H, 4.34; N, 10.97. Found: C, 56.66; H, 4.65; N, 10.64.
2-((8-Methoxy-4-oxo-3-(4-sulphamoylphenyl)-3,4-dihydroquinazolin-2-yl)thio)-N-(p-tolyl) acetamide (8)
8: Yield: 90%; MP: > 350 °C. IR (KBr, cm−1): 3345, 3256, 3180 (NH2, NH), 3097 (aromatic), 2967, 2823 (aliphatic), 1690, 1667 (2 CO), 1622 (CN), 1381, 1165 (SO2). 1H-NMR (DMSO-d6,ppm): 2.3 (s, 3H, CH3), 3.8 (s, 3H, OCH3), 3.9 (s, 2H, CH2), 7.3, 7.4 (2d, 4H, J = 8.0, 7.9 Hz, AB system-tolyl), 7.5, 7.6 (2d, J = 7.4, 7.3 Hz, 4H, AB system), 7.7 − 7.9 (m, 9H, Ar-H + SO2NH2), 10.4 (s, 1H, NH). 13 C-NMR (DMSO-d6,ppm): 20.6, 31.2, 56.9, 116.6, 117.4, 118.6 (2), 119.6, 125.0 (2), 126.9, 129.5 (2), 130.3 (2), 130.4, 136.7, 137.8, 137.9, 143.0, 150.7, 156.3, 160.1, 175.7. MS (m/z, %): 510 (M+) (12.98), 154 (100). Anal. Calcd. for C24H22N4O5S2 (510.59): C, 56.46; H, 4.34; N, 10.97. Found: C, 56.22; H, 4.11; N, 10.67.
N-(2-Ethylphenyl)-2-((8-methoxy-4-oxo-3-(4-sulphamoylphenyl)-3,4-dihydroquinazolin-2-yl)thio) acetamide (9)
9: Yield: 92%. MP: 288 − 290 °C. IR (KBr, cm−1): 3412, 3387, 3178 (NH2, NH), 3100 (aromatic), 2988, 2827 (aliphatic), 1685, 1666 (2 CO), 1612 (CN), 1391, 1155 (SO2). 1H-NMR (DMSO-d6,ppm): 1.0 (t, 3H, J = 6.6 Hz, CH3 ethyl), 2.5 (q, 2H, J = 8.3 Hz, CH2 ethyl), 3.8 (s, 3H, OCH3), 4.1 (s, 2H, CH2), 7.7, 7.8 (2d, 4H, J = 6.9, 6.8 Hz, AB system), 7.1 − 7.6 (m, 9H, Ar-H + SO2NH2), 9.6 (s, 1H, NH). 13 C-NMR (DMSO-d6,ppm): 14.5, 24.0, 31.0, 56.7, 116.3, 118.1, 120.9, 126.4 (2), 126.5, 127.1, 127.5, 128.9 (2), 130.7 (2), 135.2 (2), 138.0, 138.5, 139.0, 153.7, 155.5, 161.0, 166.5. MS (m/z, %): 524 (M+) (54.93), 121 (100). Anal. Calcd. for C25H24N4O5S2 (524.61): C, 57.24; H, 4.61; N, 10.68. Found: C, 57.51; H, 4.86; N, 10.46.
N-(3-Ethylphenyl)-2-((8-methoxy-4-oxo-3-(4-sulphamoylphenyl)-3,4-dihydroquinazolin-2-yl)thio) acetamide (10)
10: Yield: 86%. MP: 292 − 294 °C. IR (KBr, cm−1): 3345, 3300, 3152 (NH2, NH), 3078 (aromatic), 2945, 2856 (aliphatic), 1689, 1661 (2 CO), 1618 (CN), 1390, 1165 (SO2). 1H-NMR (DMSO-d6,ppm): 1.1 (t, 3H, J = 6.5 Hz, CH3 ethyl), 2.5 (q, 2H, J = 6.8 Hz, CH2 ethyl), 3.9 (s, 3H, OCH3), 4.0 (s, 2H, CH2), 7.9, 8.0 (2d, 4H, J = 7.0, 7.1 Hz, AB system), 7.2 − 7.7 (m, 9H, Ar-H + SO2NH2), 10.2 (s, 1H, NH). 13 C-NMR (DMSO-d6,ppm): 15.9, 28.7 (2), 56.7, 117.0, 118.1, 118.9, 120.9, 123.4, 126.9 (2), 127.1, 127.4, 129.1, 130.3 (2), 130.7, 138.0, 139.1, 139.3, 144.7, 153.7, 155.6, 161.0, 166.0. MS (m/z, %): 524 (M+) (22.76), 231 (100). Anal. Calcd. for C25H24N4O5S2 (524.61): C, 57.24; H, 4.61; N, 10.68. Found: C, 57.02; H, 4.35; N, 10.89.
N-(4-Ethylphenyl)-2-((8-methoxy-4-oxo-3-(4-sulphamoylphenyl)-3,4-dihydroquinazolin-2-yl)thio) acetamide (11)
11: Yield: 88%. MP: 280 − 282 °C. IR (KBr, cm−1): 3400, 3363, 3145 (NH2, NH), 3075 (aromatic), 2945, 2867 (aliphatic), 1687, 1665 (2 CO), 1619 (CN), 1378, 1163 (SO2). 1H-NMR (DMSO-d6,ppm): 1.1 (t, 3H, J = 8.4 Hz, CH3 ethyl), 2.5 (q, 2H, J = 7.9 Hz, CH2 ethyl), 3.8 (s, 3H, OCH3), 4.0 (s, 2H, CH2), 7.1, 7.4 (2d, 4H, J = 7.6, 7.7 Hz, AB system), 7.7 − 8.0 (2d, 4H, J = 7.4, 7.5 Hz, AB system), 7.3 − 7.7 (m, 5H, Ar-H + SO2NH2), 10.3 (s, 1H, NH). 13 C-NMR (DMSO-d6,ppm): 16.1, 28.0 (2), 56.7, 116.4, 118.1, 119.7 (2), 120.9, 127.4 (2), 128.4 (2), 130.7 (3), 137.0, 138.0, 139.3, 139.4, 146.2, 153.7, 155.6, 161.0, 165.8. MS (m/z, %): 524 (M+) (8.05), 106 (100). Anal. Calcd. for C25H24N4O5S2 (524.61): C, 57.24; H, 4.61; N, 10.68. Found: C, 57.49; H, 4.78; N, 10.87.
2-((8-Methoxy-4-oxo-3-(4-sulphamoylphenyl)-3,4-dihydroquinazolin-2-yl)thio)-N-(p-methoxyphenyl) acetamide (12)
12: Yield: 66%. MP: 296 − 298 °C. IR (KBr, cm−1): 3445, 3343, 3129 (NH2, NH), 3078 (aromatic), 2976, 2845 (aliphatic), 1677, 1657 (2 CO), 1621 (CN), 1376, 1176 (SO2). 1H-NMR (DMSO-d6,ppm): 3.8, 3.9 (2 s, 6H, 2 OCH3), 4.0 (s, 2H, CH2), 6.8, 7.4 (2d, 4H, J = 6.7, 6.6 Hz, AB system), 7.6, 8.0 (2d, 4H, J = 7.2, 7.3 Hz, AB system), 7.5–7.9 (m, 5H, Ar-H + SO2NH2), 10.2 (s, 1H, NH). 13 C-NMR (DMSO-d6,ppm): 32.3, 55.6, 56.9, 114.3 (2), 116.4, 118.1, 120.9, 121.2 (2), 126.9 (2), 127.4, 130.3 (2), 130.7, 132.4, 138.0, 139.1, 153.7, 155.6, 155.8, 161.0, 165.5. MS (m/z, %): 526 (M+) (5.43), 165 (100). Anal. Calcd. for C24H22N4O6S2 (526.58): C, 54.74; H, 4.21; N, 10.64. Found: C, 54.49; H, 4.00; N, 10.40.
N-(p-Ethoxyphenyl)-2-((8-methoxy-4-oxo-3-(4-sulphamoylphenyl)-3,4-dihydroquin-azolin-2-yl)thio) acetamide (13)
13: Yield: 69%. MP: 300 − 302 °C. IR (KBr, cm−1): 3410, 3376, 3161 (NH2, NH), 3058 (aromatic), 2978, 2845 (aliphatic), 1687, 1661 (2 CO), 1613 (CN), 1386, 1155 (SO2). 1H-NMR (DMSO-d6,ppm): 1.3 (t, 3H, J = 8.5 Hz, CH3), 3.8 (s, 3H, OCH3), 4.0 (s, 2H, SCH2), 4.1 (q, 2H, J = 8.0 Hz, CH2), 6.8, 7.3 (2d, 4H, J = 7.7, 7.8 Hz, AB system), 7.5, 7.7 (2d, 4H, J = 7.0, 7.2 Hz, AB system), 7.0–7.8 (m, 5H, Ar-H + SO2NH2), 10.3 (s, 1H, NH). 13 C-NMR (DMSO-d6,ppm): 18.2, 28.9, 55.8, 56.9, 115.6 (2), 115.7, 118.9, 119.9, 120.9 (2), 126.3 (2), 126.8, 130.3 (2), 130.6, 133.7, 133.9, 138.3, 154.6, 155.8, 157.7, 160.0, 175.4. MS (m/z, %): 540.61 (M+) (22.09), 264 (100). Anal. Calcd. for C25H24N4O6S2 (540.61): C, 55.54; H, 4.47; N, 10.36. Found: C, 55.27; H, 4.68; N, 10.09.
N-(3,5-Dimethoxyphenyl)-2-((8-methoxy-4-oxo-3-(4-sulphamoylphenyl)-3,4-dihydroq-uinazolin-2-yl)thio) acetamide (14)
14: Yield: 76%. MP: 240 − 242 °C. IR (KBr, cm−1): 3460, 3311, 3178 (NH2, NH), 3071 (aromatic), 2971, 2855 (aliphatic), 1691, 1660 (2 CO), 1620 (CN), 1377, 1161 (SO2). 1H-NMR (DMSO-d6,ppm): 3.6, 3.8 (2 s, 9H, 3 OCH3), 4.0 (s, 2H, SCH2), 6.2 (s, 1H, CH), 6.80, 6.82 (2 s, 2H, Ar-H), 7.4, 7.5 (2d, 4H, J = 6.2, 6.1 Hz, AB system), 7.5–7.9 (m, 6H, Ar-H + SO2NH2 + NH). 13 C-NMR (DMSO-d6,ppm): 31.2, 55.5, 56.8 (2), 95.9, 97.9 (2), 116.4, 118.1, 120.9, 127.0 (2), 127.1, 129.3 (2), 131.0, 131.3, 138.0, 141.0, 153.7, 160.9, 161.0 (2), 166.2 (2). MS (m/z, %): 556 (M+) (22.09), 264 (100). Anal. Calcd. for C25H24N4O7S2 (556.61): C, 53.95; H, 4.35; N, 10.07. Found: C, 54.27; H, 4.69; N, 10.29.
2-((8-Methoxy-4-oxo-3-(4-sulphamoylphenyl)-3,4-dihydroquinazolin-2-yl)thio)-N-(3,4,5-trimethoxyphenyl) acetamide (15)
15: Yield: 86%. MP: 290 − 292 °C. IR (KBr, cm−1): 3356, 3256, 3176 (NH2, NH), 3100 (aromatic), 2942, 2856 (aliphatic), 1690, 1667 (2 CO), 1623 (CN), 1367, 1152 (SO2). 1H-NMR (DMSO-d6,ppm): 3.71, 3.90, 3.92 (3 s, 12H, 4 OCH3), 4.08 (s, 2H, SCH2), 6.95 (s, 2H, Ar-H), 7.45, 7.48 (2d, 4H, J = 7.4, 7.2 Hz, AB system), 7.5 − 8.0 (m, 5H, Ar-H + SO2NH2), 10.2 (s, 1H, NH). 13 C-NMR (DMSO-d6,ppm): 32.1, 56.1, 56.8, 56.9, 60.5, 97.3 (2), 116.5, 118.1, 120.9, 126.7 (2), 127.0, 127.4 (2), 130.3, 133.9, 135.5, 138.0, 139.0, 153.1, 153.7 (2), 155.4, 161.0, 165.9. MS (m/z, %): 586.64 (M+) (33.32), 91 (100). Anal. Calcd. for C26H26N4O8S2 (586.64): C, 53.23; H, 4.47; N, 9.55. Found: C, 52.98; H, 4.15; N, 9.21.
2-((8-Methoxy-4-oxo-3-(4-sulphamoylphenyl)-3,4-dihydroquinazolin-2-yl)thio)-N-(2-methyl-4-nitrophenyl) acetamide (16)
16: Yield: 86%. MP: > 350 °C. IR (KBr, cm−1): 3421, 3365, 3154 (NH2, NH), 3077 (aromatic), 2958, 2837 (aliphatic), 1687, 1660 (2 CO), 1618 (CN), 1388, 1156 (SO2). 1H-NMR (DMSO-d6,ppm): 2.3 (s, 3H, CH3), 3.9 (s, 3H, OCH3), 4.1 (s, 2H, CH2), 6.8, 7.4 (2d, 4H, J = 7.6, 7.7 Hz, AB system), 7.51–7.9 (m, 8H, Ar-H + SO2NH2), 10.1 (s, 1H, NH). 13 C-NMR (DMSO-d6,ppm): 19.3, 30.3, 58.6, 109.4, 116.7, 117.3, 120.6, 121.6, 122.7 (2), 124.7, 127.6, 128.7 (2), 129.1, 133.6, 134.6, 135.7, 141.9, 142.3, 150.7, 160.8, 161.2, 165.6. MS (m/z, %): 555 (M+) (1.54), 163 (100). Anal. Calcd. for C24H21N5O7S2 (555.58): C, 51.88; H, 3.81; N, 12.61. Found: C, 51.56; H, 4.09; N, 12.32.
2-((8-Methoxy-4-oxo-3-(4-sulphamoylphenyl)-3,4-dihydroquinazolin-2-yl)thio)-N-(2-methyl-6-nitrophenyl) acetamide (17)
17: Yield: 71%. MP: > 350 °C. IR (KBr, cm−1): 3400, 3318, 3162 (NH2, NH), 3065 (aromatic), 2994, 2843 (aliphatic), 1684, 1666 (2 CO), 1622 (CN), 1378, 1155 (SO2). 1H-NMR (DMSO-d6,ppm): 2.2 (s, 3H, CH3), 3.8 (s, 3H, OCH3), 4.1 (s, 2H, CH2), 7.4, 7.6 (2d, 4H, J = 7.0, 6.9 Hz, AB system), 7.5 − 7.9 (m, 8H, Ar-H + SO2NH2), 10.2 (s, 1H, NH). 13 C-NMR (DMSO-d6,ppm): 18.0, 27.9, 56.7, 116.4, 118.1, 120.0, 122.6 (2), 127.1, 127.4, 127.5, 128.7, 130.7 (2), 135.4, 137.7, 137.9, 130.0 (2), 145.9, 153.7, 155.2, 161.0, 166.4. MS (m/z, %): 555 (M+) (8.54), 212 (100). Anal. Calcd. for C24H21N5O7S2 (555.58): C, 51.88; H, 3.81; N, 12.61. Found: C, 66.56; H, 3.61; N, 12.85.
N-(2,4-Dinitrophenyl)-2-((8-methoxy-4-oxo-3-(4-sulphamoylphenyl)-3,4-dihydro-quinazo-lin-2-yl)thio) acetamide (18)
18: Yield: 86%. MP: > 350 °C. IR (KBr, cm−1): 3365, 3312, 3177 (NH2, NH), 3082 (aromatic), 2991, 2863 (aliphatic), 1689, 1664 (2 CO), 1624 (CN), 1378, 1158 (SO2). 1H-NMR (DMSO-d6,ppm): 3.92 (s, 3H, OCH3), 3.95 (s, 2H, CH2), 7.41, 7.63 (2d, 4H, J = 8.4, 8.5 Hz, AB system), 7.56 − 7.93 (m, 8H, Ar-H + SO2NH2), 8.67 (s, 1H, NH). 13 C-NMR (DMSO-d6,ppm): 29.6, 56.9, 116.6, 117.4, 118.6, 125.0, 126.9 (2), 130.3 (2), 130.7 (2), 136.1 (2), 136.3 (2), 137.6, 143.0, 144.0, 151.3, 160.2, 162.4, 175.7. MS (m/z, %): 586 (M+) (17.62), 187 (100). Anal. Calcd. for C23H18N6O9S2 (586.55): C, 47.10; H, 3.09; N, 14.33. Found: C, 47.36; H, 3.31; N, 14.06.
3.2. Biological evaluation
3.2.1. Cytotoxicity assay
The MTT assay was performed to test the antiproliferative activity of the synthesised compounds, as per the methodology described by Alqahtani and co-workersCitation35. Briefly, A549, HepG2, LoVo, MCF-7 and HUVEC cell lines were seeded in 96-cell culture plates (5 × 10⁴ per well) and allowed 24 h for adherence. The cells were then treated with different concentrations of each compound, and 5-fluorouracil was used as a positive control. Following the treatment period (48 h), 10 µL of MTT solution (5 mg/mL) was added to each well and the plates were incubated at 37 °C for 2–4 h. Isopropanol (100 µL) acidified with 0.1 N HCl was added to solubilise the formazan products and the plate was kept on a shaker for 10 min. The optical density of each mixture was measured at 570 nm using an enzyme-linked immunosorbent assay plate reader (ELISA plate reader, Bio-Tek, USA). The concentrations of tested compounds required to inhibit cell growth by 50% (IC50) were calculated using a dose-response curve. Cell survival was calculated using the following equation:
3.2.2. Cell cycle analysis
Cell cycle analysis was conducted as previously described by Alqahtani and co-workersCitation35. Briefly, MCF-7 cells were seeded in 6-well plates and incubated for 24 h before the addition of various concentrations (10, 20 and 30 µM) of compounds 6 and 10. After incubating for 24 h, the cells were harvested, washed, and resuspended in PBS. The cells were fixed with 70% ethanol at 4 °C for 4 h. The cells were then incubated with RNase (100 µg/mL) and PI (50 µg/mL) for 30 min in the dark. Flow cytometry analysis was performed using Cytomics FC 500 (Beckman Coulter, Brea, CA, USA).
3.2.3. Quantification of apoptosis by flow cytometric analysis
Apoptosis was measured using the Annexin V/PI detection kit (BioLegend, CA, USA), as per the manufacturer’s instructions. Briefly, MCF-7 cells were treated with different concentrations (10, 20 and 30 µM) of compounds 6 and 10 for 24 h. After treatment, the detached and adherent cells were collected, washed, and resuspended in 100 µL of 1X binding buffer. Then, 5 µL of Annexin V and 5 µL of PI were added to the resuspended cells. After incubating for 15 min in the dark, 400 µL of binding buffer was added to each tube and cell samples were analysed using Cytomics FC 500 (Beckman Coulter, Brea, CA, USA). Data collection and analysis were conducted using the CXP software V. 3.0 (Aspect, Phoenix, AZ, USA).
3.2.4. Rt-pcr
MCF-7 cells were cultured with different concentrations (10, 20 and 30 µM) of compounds 6 and 10 for 24 h, and the untreated cells were used as a control. The cells were lysed using Trizol reagent (Invitrogen, USA). Total RNA was extracted as per the manufacturer’s instructions. Total RNA was quantitated by taking 2 µL of resuspended RNA on a Nano drop spectrophotometer (Thermo Scientific, USA) and reverse transcribing an equal amount (1 µg) of RNA to make complementary deoxyribonucleic acid (cDNA) using a Super Script VILO cDNA synthesis Kit (Invitrogen), as per the manufacturer’s protocol, in a final volume of 20 µL. The mixture was incubated at 42 °C for 1 h. The generated cDNA (2 µL) was used to assess the mRNA expression of apoptotic genes, including caspase-7, Bax, Bcl-2, and p53. The actin gene was used as an internal control. RT-PCR was performed using 5x Firepol Master Mix ready to load (Solis BioDyne, Tartu, Estonia), as per the manufacturer’s instructions. The specific primer sets used in this study are listed in . The program was run as follows: initial denaturation at 95 °C for 5 min, denaturation at 95 °C for 30 s, annealing at 55 °C for 45 s, elongation at 72 °C for 45 s (30 cycles), and final extension at 72 °C for 10 min. The RT-PCR products were electrophoresed on a 1.2% agarose gel containing ethidium bromide, and the gel was imaged on a Licor machine.
Table 3. List of primer sequences used for reverse transcriptase-polymerase chain reaction in this study. F: Forward, R: Reverse
3.2.5. Western blot analysis
MCF-7 cells were treated with compounds 6 and 10 for 24 h. The cells were then harvested and washed twice with 1x PBS, by adding lysis buffer containing 20 mM Tris (pH 7.5), 150 mM NaCl, 1 mM sodium ethylenediaminetetraacetic acid, 1 mM ethylene glycol-bis (β-aminoethyl ether)-N,N,N′,N′-tetraacetic acid, 1% Triton X100, 1 µg/mL leupeptin, and 100 µM phenylmethylsulphonyl fluoride, to prepare the total cell extract. The lysate was cooled on ice for 1 h and clarified by centrifugation at 13000 rpm at 4 °C for 15 min. The supernatants were collected. The protein concentrations of all the samples were determined using Bradford reagent (BioRad, Hercules, CA, USA). For western blot analysis, 30 − 35 µg of the total protein was loaded onto 10% sodium dodecyl sulphate-polyacrylamide gel and then transferred to a polyvinylidene fluoride membrane. The membrane was blocked with 5% bovine serum albumin in 0.1% Tween-tris-buffered saline (TBST) buffer for 2 h at room temperature, and then washed thrice with TBST. The membrane was incubated with primary antibodies for Bcl-2, p53, caspase7, Bax, and β-actin (1:200, Santa Cruz Biotechnology). To ensure equal loading, an anti-actin antibody was also used. The membrane was incubated with horseradish peroxidase-conjugated anti-mouse secondary antibody diluted 1: 1000 for 1 h at room temperature. After incubation, the membrane was washed thrice with TBST. It was then ready for immunodetection; the membrane was incubated with enhanced chemiluminescence western blotting detection reagents (Amersham, Pharmacia Biotech Inc., Piscataway, NJ, USA) and bands were obtained on exposing to X-ray films (Amersham).
3.3. Molecular docking
The potential of the two most promising compounds 6 and 10 to inhibit Bcl-2 was evaluated in molecular docking experiments, conducted as described by Al-Shabib and co-workersCitation32. The 3 D coordinates of Bcl-2 were retrieved from the PDB-RCSB databank (PDB ID: 2W3L). The X-ray crystal structure of DRO-bound Bcl-2 has previously been solved at a resolution of 2.10 ÅCitation36. Prior to molecular docking, the protein was pre-processed to remove crystallographic water molecules and any other heteroatoms, add hydrogen atoms, assign proper bond order, and define rotatable bonds, as previously described by Rehman and co-workersCitation37. A network of H-bonds was created, and the energy of the protein was minimised using the Merck Molecular Force Field. A grid box of 27 × 30 × 25 Å, centred at 39 × 28 × −12 Å, with 0.375 Å spacing was defined as a conformation search space for the binding of ligands to Bcl-2. Finally, molecular docking between ligands and proteins was performed using Autodock 4.2 (Scripps Research, San Diego, CA, USA), as previously described by Rabbani and co-workersCitation38. Molecular docking was performed using the Lamarckian Genetic Algorithm and Solis and Wets local search methods. The initial torsions, positions, and orientations of the ligands were set randomly. For each docking run, a maximum of 2.5 × 10⁶ calculations was enumerated after setting a population size of 150 and a translational step of 0.2 Å. The quaternion and torsion steps were set to 5. Discovery Studio (BIOVIA, San Diego, CA, USA) was used to analyse the docking results and prepare the figures. Binding affinities of compounds 6 and 10 for Bcl-2 were determined from their respective binding energies (ΔG), using the following relationshipCitation39.
Here, R is the Boltzmann gas constant (1.987 cal mol−1 K−1) and T is the temperature (298 K).
3.4. Statistical analysis
Statistical analysis was performed using OriginPro 8.5 software (OriginLab, Northampton, MA, USA). Data are shown as the mean ± standard deviation. Differences were analysed using Student’s t-test, and were considered statistically significant if p < 0.05. *p < 0.05, **p < 0.01, ***p < 0.001.
4. Conclusion
In conclusion, a new series of quinazoline-sulphonamide derivatives 5–18 were synthesised and evaluated in vitro for their antiproliferative activity. Most of the prepared compounds were found to exhibit remarkable cytotoxicity in the MCF-7 breast cancer cell line. Compounds 6 and 10 were found to be the most promising. Flow cytometry data revealed that compounds 6 and 10 arrested the cell cycle of MCF-7 cells in the sub-G1 and induced apoptosis in cell death mode. Furthermore, changes in the expression of apoptosis-related markers at the gene and protein level were also indicative of apoptotic activity. The 2-tolyl derivative 6 and the 3-ethylphenyl derivative 10 downregulated the expression of B-cell lymphoma-2 (Bcl-2), while increasing that of p53, Bcl-2-like protein 4, and caspase-7, at the mRNA and protein levels. Molecular docking of compounds 6 and 10 also suggested that they possess good binding affinity for Bcl-2. Overall, the findings suggest that compounds 6 and 10 both possess promising anti-proliferative activity. These molecules may be further modified to develop more selective, clinically useful analogues.
Acknowledgements
This project was funded by the National Plan for Science, Technology, and Innovation (MAARIFAH), King Abdulaziz City for Science and Technology, Kingdom of Saudi Arabia, Award number (13-MED 997-02).
Disclosure statement
The authors declare no conflicts of interest.
Additional information
Funding
References
- Clark W. Tumour progression and the nature of cancer. Br J Cancer 1991;64:631–44.
- DeVita VT, Chu E. A history of cancer chemotherapy. Cancer Res 2008;68:8643–53.
- Arruebo M, Vilaboa N, Sáez-Gutierrez B, et al. Assessment of the evolution of cancer treatment therapies. Cancers (Basel) 2011;3:3279–330.
- Schirrmacher V. From chemotherapy to biological therapy: A review of novel concepts to reduce the side effects of systemic cancer treatment (Review). Int J Oncol 2019;54:407–19.
- Peitzsch C, Perrin R, Hill RP, et al. Hypoxia as a biomarker for radioresistant cancer stem cells. Int J Radiat Biol 2014;90:636–52.
- Sugrue T, Lowndes NF, Ceredig R. Hypoxia enhances the radioresistance of mouse mesenchymal stromal cells. Stem Cells 2014;32:2188–200.
- Daniel KG, Gupta P, Harbach RH, et al. Organic copper complexes as a new class of proteasome inhibitors and apoptosis inducers in human cancer cells. Biochem Pharmacol 2004;67:1139–51.
- Luqmani Y. Mechanisms of drug resistance in cancer chemotherapy. Med Princ Pract 2005;14(Suppl 1):35–48.
- Nahta R, Yuan LX, Du Y, Esteva FJ. Lapatinib induces apoptosis in trastuzumab-resistant breast cancer cells: effects on insulin-like growth factor I signaling. Mol Cancer Ther 2007;6:667–74.
- Ling YH, Lin R, Perez-Soler R. Erlotinib induces mitochondrial-mediated apoptosis in human H3255 non-small-cell lung cancer cells with epidermal growth factor receptorL858R mutation through mitochondrial oxidative phosphorylation-dependent activation of BAX and BAK. Mol Pharmacol 2008;74:793–806.
- Chao T-T, Wang C-Y, Chen Y-L, et al. Afatinib induces apoptosis in NSCLC without EGFR mutation through Elk-1-mediated suppression of CIP2A. Oncotarget 2015;6:2164–79.
- Zhao Z-Q, Yu Z-Y, Li J, Ouyang X-N. Gefitinib induces lung cancer cell autophagy and apoptosis via blockade of the PI3K/AKT/mTOR pathway. Oncol Lett 2016;12:63–8.
- George JA, Alshebli Z, Alneyadi A, et al. Idelalisib induces apoptosis in the lymphoid tissues and impairs lung function in mice. J Chemother 2020;32:88–97.
- Ghorab MM, Alsaid MS, Soliman AM, Al-Mishari AA. Benzo[g]quinazolin-based scaffold derivatives as dual EGFR/HER2 inhibitors. J Enzyme Inhib Med Chem 2018;33:67–73.
- Traxler P. Tyrosine kinases as targets in cancer therapy - successes and failures. Expert Opin Ther Targets 2003;7:215–34.
- Wakeling AE, Guy SP, Woodburn JR, et al. ZD1839 (Iressa): an orally active inhibitor of epidermal growth factor signaling with potential for cancer therapy. Cancer Res 2002;62:5749–54.
- Gong HH, Addla D, Lv JS, Zhou CH. Heterocyclic naphthalimides as new skeleton structure of compounds with increasingly expanding relational medicinal applications. Curr Top Med Chem 2016;16:3303–64.
- Kashyap M, Das D, Preet R, et al. Scaffold hybridization in generation of indenoindolones as anticancer agents that induce apoptosis with cell cycle arrest at G2/M phase. Bioorg Med Chem Lett 2012;22:2474–9.
- Lubenets V, Lviv Polytechnic National University, Karpenko O, Ponomarenko M, Zahoriy G, Krychkovska A, Novikov V. Development of new antimicrobial compositions of thiosulfonate structure. Chem Chem Technol 2013;7:119–24.
- Lubenets V, Vasylyuk S, Monka N, et al. Synthesis and antimicrobial properties of 4-acylaminobenzenethiosulfoacid S-esters. Saudi Pharm J 2017;25:266–74.
- Harmey JH, Bouchier‐Hayes D. Vascular endothelial growth factor (VEGF), a survival factor for tumour cells: Implications for anti-angiogenic therapy. Bioessays 2002;24:280–3.
- Gorski DH, Beckett MA, Jaskowiak NT, et al. Blockade of the vascular endothelial growth factor stress response increases the antitumor effects of ionizing radiation. Cancer Res 1999;59:3374–8.
- Ghorab MM, El Ella DAA, Heiba HI, Soliman AM. Synthesis of certain new thiazole derivatives bearing a sulfonamide moiety with expected anticancer and radiosensitizing activities. J Mater Sci 2011;3:31.
- Mills CC, Kolb EA, Sampson VB. Development of chemotherapy with cell-cycle inhibitors for adult and pediatric cancer therapy. Cancer Res 2018;78:320–5.
- Bai J, Li Y, Zhang G. Cell cycle regulation and anticancer drug discovery. Cancer Biol Med 2017;14:348–62.
- Heishima K, Mori T, Sakai H, et al. MicroRNA-214 promotes apoptosis in canine hemangiosarcoma by targeting the COP1-p53 axis. PLoS One 2015;10:e0137361.
- Hanahan D, Weinberg RA. Hallmarks of cancer: the next generation. Cell 2011;144:646–74.
- Fesik SW. Promoting apoptosis as a strategy for cancer drug discovery. Nat Rev Cancer 2005;5:876–85.
- Plesca D, Mazumder S, Almasan A. DNA damage response and apoptosis. Methods Enzymol 2008;446:107–22.
- Kale J, Osterlund EJ, Andrews DW. BCL-2 family proteins: changing partners in the dance towards death. Cell Death Differ 2018;25:65–80.
- Perlman H, Zhang X, Chen MW, et al. An elevated bax/bcl-2 ratio corresponds with the onset of prostate epithelial cell apoptosis. Cell Death Differ 1999;6:48–54.
- Al-Shabib NA, Khan JM, Malik A, et al. Molecular insight into binding behavior of polyphenol (rutin) with beta lactoglobulin: spectroscopic, molecular docking and MD simulation studies. J Mol Liquids 2018;269:511–20.
- Campbell KJ, Tait SWG. Targeting BCL-2 regulated apoptosis in cancer. Open Biol 2018;8:180002.
- Salam AAA, Nayek U, Sunil D. Homology modeling and docking studies of Bcl-2 and Bcl-xL with small molecule inhibitors: identification and functional studies. Curr Top Med Chem 2018;18:2633–63.
- Alqahtani AS, Nasr FA, Noman OM, et al. Cytotoxic evaluation and anti-angiogenic effects of two furano-sesquiterpenoids from Commiphora myrrh resin. Molecules 2020;25:1318.
- Porter J, Payne A, de Candole B, et al. Tetrahydroisoquinoline amide substituted phenyl pyrazoles as selective Bcl-2 inhibitors. Bioorg Med Chem Lett 2009;19:230–3.
- Rehman MT, Shamsi H, Khan AU. Insight into the binding mechanism of imipenem to human serum albumin by spectroscopic and computational approaches. Mol Pharm 2014;11:1785–97.
- Rabbani N, Tabrez S, Islam BU, et al. Characterization of colchicine binding with normal and glycated albumin: In vitro and molecular docking analysis. J Biomol Struct Dyn 2018;36:3453–62.
- Rehman MT, Ahmed S, Khan AU. Interaction of meropenem with 'N' and 'B' isoforms of human serum albumin: a spectroscopic and molecular docking study. J Biomol Struct Dyn 2016;34:1849–64.