
 ?Mathematical formulae have been encoded as MathML and are displayed in this HTML version using MathJax in order to improve their display. Uncheck the box to turn MathJax off. This feature requires Javascript. Click on a formula to zoom.
Abstract
The rise of antibacterial-resistant bacteria is a major problem in the United States of America and around the world. Millions of patients are infected with antimicrobial resistant bacteria each year. Novel antibacterial agents are needed to combat the growing and present crisis. Acetyl-CoA carboxylase (ACC), the multi-subunit complex which catalyses the first committed step in fatty acid synthesis, is a validated target for antibacterial agents. However, there are at present, no commercially available antibiotics that target ACC. Ethyl 4-[[2-chloro-5-(phenylcarbamoyl)phenyl]sulfonylamino]benzoate (SABA1) is a compound that has been shown to have antibacterial properties against Pseudomonas aeruginosa and Escherichia coli. SABA1 inhibits biotin carboxylase (BC), the enzyme that catalyses the first half reaction of ACC. SABA1 inhibits BC via an atypical mechanism. It binds in the biotin binding site in the presence of ADP. SABA1 represents a potentially new class of antibiotics that can be used to combat the antibacterial resistance crisis.
Introduction
In a 2020 report, the World Health Organisation called antimicrobial resistance (AMR) “a major threat to human health with significant global economic and security implications”Citation1. In the United States, an estimated 2.8 million patients contract AMR infections each year. Of those 2.8 million infections, over 35 000 cases result in deathCitation2. The economic loss from AMR is difficult to quantify, but estimates are as high as $55 billion (2008 dollars) per year in the U.S. aloneCitation3. The problem of AMR is not limited to the United States. In 2015, there were an estimated 670 000 AMR infections leading to approximately 33 000 deaths in the European Union (EU) and European Economic AreaCitation4. The ESKAPE pathogens (Enterococcus faecium, Staphylococcus aureus, Klebsiella pneumoniae, Acinetobacter baumannii, Pseudomonas aeruginosa, and Enterobacter spp) are particularly problematic. These six pathogens are the leading cause of nosocomial infections worldwide and are known for their ability to “escape” destruction by many current antibioticsCitation5–8. Of those six bacteria, four of them (Klebsiella pneumoniae, Acinetobacter baumannii, Pseudomonas aeruginosa, and Enterobacter) are Gram-negative. Gram-negative bacteria are generally more resistant to antibiotics than Gram-positive organisms, largely because of their outer membraneCitation9–11. In order to combat the present and growing threat of AMR, new classes of antibiotics need to be developedCitation12–14. While a few novel classes have been developed this past decade, they are not enough to meet the current demand. More antibiotics still need to be developedCitation15.
The fatty acid synthesis type-II (FASII) pathway is a validated target for antibiotic development against Gram-negative bacteriaCitation16–18. In Gram-negative organisms FASII, in addition to its normal role of synthesising saturated fatty acids, is required for the production of β-hydroxy-fatty acids, which are necessary for the synthesis of the lipid A component of lipopolysaccharides (LPS). LPS is a major constituent of the outer membrane of Gram-negative bacteriaCitation19–21.
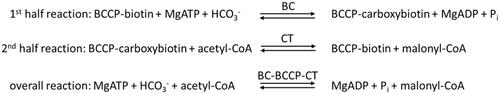
Acetyl-CoA carboxylase (ACC) is the multi-subunit complex that catalyses the first committed step in fatty acid synthesisCitation22. The complex catalyses the two half reactions, shown in Scheme 1. In the first half reaction, biotin carboxylase (BC) catalyses the ATP dependent carboxylation of the vitamin biotin, which is covalently attached to biotin carboxyl carrier protein (BCCP). This forms a carboxybiotin intermediate. In the second half reaction, carboxyltransferase (CT) transfers the carboxyl group from the carboxybiotin intermediate onto acetyl-CoA, forming malonyl-CoA. The BC and CT subunits retain their activity when isolated separately and can utilise free biotin as a substrateCitation22,Citation23.
Scheme 1. Reactions catalysed by ACC.
Both CT and BC are the targets of antibacterial compounds. The natural products andrimid and moiramide B both target CT and are competitive versus malonyl-CoACitation24. There are three classes of compounds that inhibit BC: the aminooxazolesCitation25, the benzimidazole carboxamidesCitation26, and the pyridopyrimidinesCitation27. All three are synthetic compounds that bind in the ATP-binding site and are competitive versus ATP ().
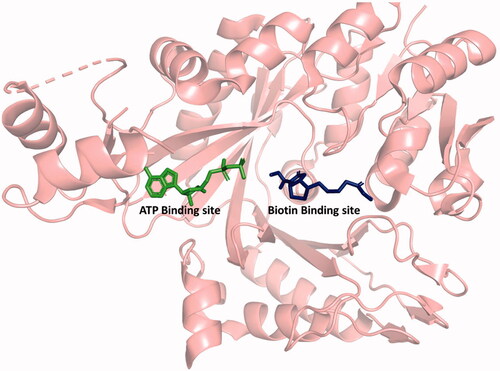
Figure 1. Structure of BC showing the ATP and biotin binding sites. ATP, ADP, aminooxazole, benzimidazole carboxamide, and pyridopyrimidine bind in the ATP binding site. Biotin, bicarbonate, and phosphate bind in the biotin binding site. Generated with PyMOL.
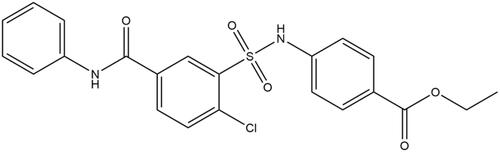
In 2015 a group from Microbiotix, Inc. developed an in vivo high-throughput screen capable of identifying FASII inhibitors in Pseudomonas aeruginosa and Escherichia coliCitation28. That screen identified five compounds that selectively inhibit FASIICitation28. Two of those compounds share a sulfonamidobenzamide (SABA) core structureCitation28. The more potent of those two compounds is ethyl 4-[[2-chloro-5-(phenylcarbamoyl)phenyl]sulfonylamino]benzoate (SABA1) (). SABA1 has a MIC of 0.45–0.9 µM against efflux compromised E. coli (ΔtolC::tet) and prolongs the doubling time of the efflux compromised P. aeruginosa strain PAO397 by 30%Citation28. They determined that the antibacterial action of SABA1 is due to inhibition of ACC. It has an IC50 of 4.0 µM against E. coli ACCCitation28 and mapping of resistant mutations suggests that SABA1 targets BCCitation28.
Figure 2. Structure of SABA1.
In this report, we definitively establish that SABA1 inhibits BC. Instead of binding in the ATP-binding site like all other known inhibitors of BC with antibacterial properties, SABA1 binds in the biotin binding site. We further demonstrate that SABA1 inhibits BC via an atypical mechanism where SABA1 binding is strongly enhanced by the presence of ADP.
Materials and methods
All reagents for protein expression, purification, and kinetic analysis were purchased from MilliporeSigma, Fischer Scientific, Bio-Rad, New England BioLabs, or Thermo Scientific except where noted. SABA1 was purchased from Hit2Lead.
Protein expression
Biotin carboxylase with an N-terminal His tagCitation29, biotin carboxylase carrier protein with an N-terminal His tagCitation30, and carboxyltransferase with a His tag on the N-terminus of the α-subunitCitation31 were expressed separately as previously described, with the following modifications. Cells from glycerol stocks were streaked for isolation on a Luria broth (LB) plate with appropriate antibiotics. A 50 mL culture of LB with an appropriate antibiotic was inoculated with an isolated colony and incubated overnight with shaking at 37 °C. The overnight culture was used to inoculate 0.5 L of LB medium in a 2.0-L flask. The cells were grown at 37 °C, shaking at 200 rpm until mid-log phase. Cells were induced with 50 µM Isopropyl β-d-1-thiogalactopyranoside (IPTG). Shaking was decreased to 150 RPM, and the incubation was continued for 18 h at room temperature. Cells were harvested by centrifugation and resuspended in a minimal amount of Buffer A (5 mM imidazole, 25 mM NaPO4, 500 mM NaCl, pH 8.0). The resuspended cell pellet was then either frozen or purified immediately.
Protein purification
Cells were lysed by sonication in the presence of DNase. The resultant lysate was clarified by centrifugation at 4 °C. The clarified lysate was loaded onto a Ni-NTA column pre-equilibrated with Buffer A. The column was washed with 200 mL of Buffer A then 200 mL of NPI-45 (45 mM imidazole, 25 mM NaPO4, 500 mM NaCl, pH 8.0). Protein was eluted with NPI-500 (500 mM imidazole, 25 mM NaPO4, 500 mM NaCl, pH 8.0) and collected in 1 mL fractions. Purity was determined by SDS-PAGE and pure fractions were pooled. The pooled fractions were first dialysed against 10 mM Hepes pH 8.0, 150 mM KCl, 1 mM EDTA, to remove any residual nickel, then 10 mM Hepes pH 8.0, 150 mM KCl. The pure protein was concentrated, aliquoted, and stored at −80 °C.
Kinetic assays
For inhibition studies that varied ATP or biotin, initial velocities were measured as previously reportedCitation30. In brief, pyruvate kinase and lactic dehydrogenase were used to couple ADP production to NADH oxidation, which can be measured spectrophotometrically at 340 nm. For inhibition studies varying ADP, activity was determined by following the production of inorganic phosphate (Pi) using the EnzChek® Phosphate Assay Kit (Molecular Probes) according to the manufacturer’s protocol. In brief, purine nucleoside phosphorylase converts 2-amino-6-mercapto-7-methylpurine riboside to ribose 1-phosphate and 2-amino-6-mercapto-7-methylpurine in the presence of Pi. This reaction is monitored at 360 nMCitation32. Kinetic data were collected on a Cary60 UV-Vis spectrophotometer (Agilent Technologies)
Biotin carboxylase inhibition assays
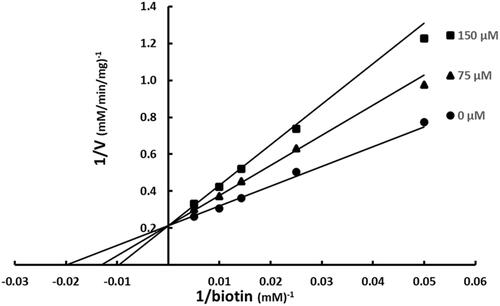
To determine the inhibition pattern versus ATP, ATP was varied from 0.05 mM to 1.0 mM. SABA1 was held at fixed concentrations of 0.0 µM, 75 µM, or 150 µM. Biotin was held constant at 40 mM. To determine the inhibition pattern versus biotin, biotin was varied from 20 mM and 200 mM. SABA1 was held at fixed concentrations of 0.0 µM, 75 µM, or 150 µM. ATP was held constant at 0.2 mM. Each reaction was started with the addition of enzyme.
To determine the inhibition pattern versus ADP using the Pi assay, ADP was varied from 0.19 µM to 19 µM. ATP was held constant at 0.6 mM, biotin was held constant 40 mM, and SABA1 was held constant at 100 µM. Each reaction cocktail was incubated in the presence or absence of SABA1 for 10 min. The reaction was started by addition of biotin.
Multiple inhibition assays
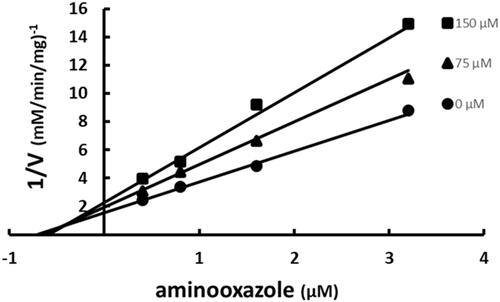
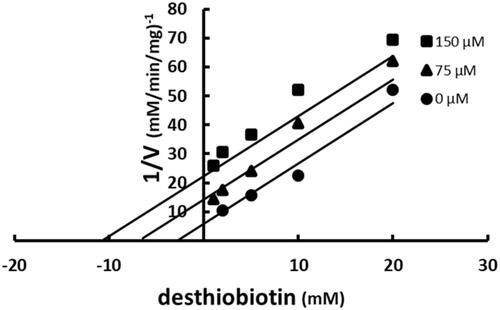
To determine the multiple inhibition pattern with respect to ATP, aminooxazole was varied from 0.2 µM to 3.2 µM. SABA1 was held at fixed concentrations of 0.0 µM, 75 µM, or 150 µM. ATP and biotin were held constant at 0.2 mM and 40 mM, respectively. To determine the multiple inhibition pattern with respect to biotin, desthiobiotin was varied from 1.0 mM to 20 mM. SABA1 was held at fixed concentrations of 0.0 µM, 75 µM, or 150 µM. ATP and biotin were held constant at 0.2 mM and 40 mM, respectively.
ACC assays
As stated above, the components of ACC were purified separately. Purified BC, BCCP, and CT were combined in a 1:2:1 molar ratio and allowed to equilibrate for 1 h prior to assaying ACC. To determine the inhibition pattern versus ATP, ATP was varied from 1.0 µM to 16 µM. SABA1 was held at fixed concentrations of 0.0 µM, 50 µM, or 100 µM. Acetyl-CoA was held constant at 0.20 mM. The reaction was started by the addition of enzyme.
Kinetic analysis
Data for inhibition studies varying ATP or biotin were analysed by nonlinear regression using the programs of ClelandCitation33. Competitive inhibition data were fitted to EquationEquation (1)(1)
(1) where v is the experimentally determined velocity, V is maximal velocity, A is substrate concentration, Km is the Michaelis constant, I is inhibitor concentration and Kis is the inhibition constant for the slope.
(1)
(1)
Non-competitive inhibition data were fitted to EquationEquation (2)(2)
(2) where v is the experimentally determined velocity, V is maximal velocity, A is substrate concentration, Km is the Michaelis constant, I is inhibitor concentration and Kii is the inhibition constant for the intercept and Kis is the inhibition constant for the slope.
(2)
(2)
Multiple inhibition data were fitted to EquationEquation (3)(3)
(3) where v is the experimentally determined velocity, V is maximal velocity, L and J are the concentration of the two inhibitors, KL and KJ are the apparent inhibition constants of those respective inhibitors, and α is the interaction factor of the two inhibitors.
(3)
(3)
Data for inhibition studies varying ADP were analysed by nonlinear regression using the program EnzfitterCitation34. Apparent inhibition constants were obtained using EquationEquation (4)(4)
(4) where v is the velocity in the presence of inhibitor, vo is the uninhibited velocity, Ki′ is the apparent inhibition constant, and I is the concentration of inhibitor.
(4)
(4)
The apparent inhibition constants were fitted then to EquationEquation (5)(5)
(5) . Ki′ is the apparent inhibition constant, Kii is the real inhibition constant for the intercept, S is the substrate concentration, and Km is the Michaelis constant.
(5)
(5)
Docking simulations
The structure of SABA1 was obtained from the ZINC databaseCitation35 in SDF format. A single subunit of BC (PDB ID: 4RZQ or 4MV3) was used as the protein model for docking. Both the protein receptor and ligand were prepared for docking using AutoDockToolsCitation36. The box size for ligand docking, 13.337 Å, was determined by eBoxSizeCitation37. The box was centred on the position of the N1 nitrogen of biotin. The carboxybiotin analogue, N1′-methoxycarbonyl biotin methyl ester, which binds in the biotin binding siteCitation38, was docked as a reference compound. Docking was performed using AutoDock VinaCitation39. Open babelCitation40 was used to convert the ligand from PDBQT format to PDB format for viewing. PyMOLCitation41 was used to visualise binding interactions.
Results
Inhibition patterns
ATP was varied at fixed increasing concentrations of SABA1 while holding the other substrate biotin constant at subsaturating levels. SABA1 showed a competitive inhibition pattern versus ATP with a Kis of 242 ± 32 µM (). When biotin was varied at fixed increasing concentrations of SABA1 and ATP was held constant at subsaturating levels a competitive inhibition pattern with a Kis of 142.0 ± 12.3 µM was also observed ().
Figure 3. Inhibition of BC by SABA1 with respect to ATP. The concentration of ATP was varied at fixed increasing concentrations of SABA1. Biotin was held constant at subsaturating levels. Curves are the best fit of the data to EquationEquation (1)(1)
(1) . Points are the experimentally obtained velocities.
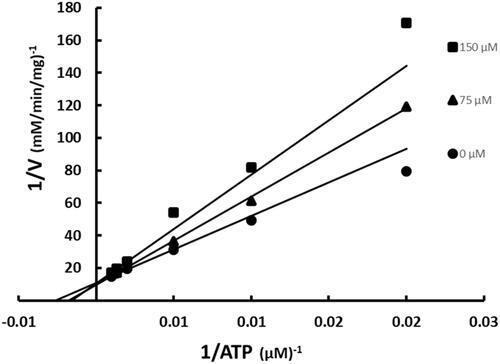
Figure 4. Inhibition of BC by SABA1 with respect to biotin. The concentration of biotin was varied at fixed increasing concentrations of SABA1. ATP was held constant at subsaturating levels. Curves are the best fit of the data to EquationEquation (1)(1)
(1) . Points are the experimentally obtained velocities.
Multiple inhibition analysis
Competitive inhibition means that binding of the inhibitor and the substrate to the enzyme are mutually exclusive. This usually indicates that the inhibitor and substrate bind in the same location. The simple explanation for the competitive inhibition patterns observed for SABA1 suggest the inhibitor can bind in either the ATP or biotin binding sites, or both sites simultaneously. To determine if SABA1 can bind in the ATP binding site, biotin binding site or both, multiple inhibition analysis was performed as described by Yonetani and TheorellCitation42. Multiple inhibition analysis is used to define the topological relationship between two different enzyme inhibitorsCitation42. Initial velocities are measured while one inhibitor is varied against fixed increasing concentrations of the second inhibitor. The substrates are held constant at subsaturating levels.
The possibility of SABA1 binding in the ATP binding site was examined with the BC inhibitor aminooxazole. Aminooxazole has been shown crystallographically to bind in the ATP siteCitation25. When aminooxazole was varied at fixed increasing concentrations of SABA1, an intersecting pattern was observed (). An intersecting pattern indicates that both inhibitors, aminooxazole and SABA1, bind to the enzyme simultaneously. This means that the SABA1 and aminooxazole/ATP binding sites are topologically distinct and therefore SABA1 does not bind in the ATP site. When the data were fitted to EquationEquation (3)(3)
(3) an α value of 0.6 was calculated. An intersecting pattern with an α value greater than zero but less than one means the two inhibitors bind synergisticallyCitation42.
Figure 5. Multiple inhibition pattern for aminooxazole and SABA1. The concentration of aminooxazole was varied at fixed increasing concentrations of SABA1. ATP and biotin were held constant at subsaturating levels. Curves are the best fit of the data to EquationEquation (3)(3)
(3) . Points are the experimentally obtained velocities.
Binding of SABA1 to the biotin-binding site was assessed with desthiobiotin. Desthiobiotin is a slow alternate substrate of BC (0.2% activity of biotin)Citation43. A slow alternate substrate can be treated as a dead-end inhibitor if its activity is less than or equal to 2.0% of the true substrateCitation44. When desthiobiotin was varied at fixed increasing concentrations of SABA1, a parallel pattern was observed (). This indicates that SABA1 and desthiobiotin bind in a mutually exclusive manor. In other words, SABA1 binds in the biotin binding site.
Figure 6. Multiple inhibition pattern for desthiobiotin and SABA1. The concentration of desthiobiotin was varied at fixed increasing concentrations of SABA1. ATP and biotin were held constant at subsaturating levels. Curves are the best fit of the data to EquationEquation (3)(3)
(3) . Points are the experimentally obtained velocities.
Inhibition versus ADP
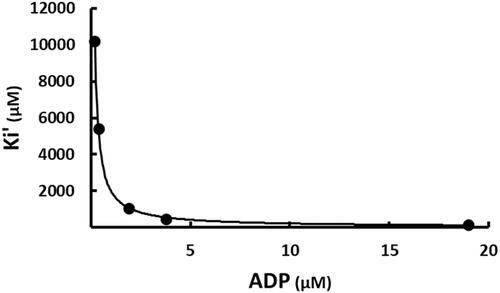
The apparent inconsistency of SABA1 binding in the biotin site, but also exhibiting competitive inhibition versus ATP suggests an inhibition mechanism more intricate than simple competition between SABA1 and biotin. An alternative mechanism for SABA1 inhibition starts by noting that the kinetic mechanism of biotin carboxylase is ordered, with ATP binding before biotinCitation45 and that free BC can bind ADPCitation38. SABA1 could inhibit BC by binding to the ADP bound form of the enzyme, blocking the addition of biotin (Scheme 2). This is the same mechanism by which the antibacterial agent triclosan inhibits enoyl (acyl carrier protein) reductase (EACPR) which catalyses the reduction of the double bond intermediate in fatty acid synthesisCitation46. Like BC, EACPR has an ordered mechanism of substrate binding, with NADH binding before the enoyl substrateCitation47. Triclosan binds following the addition of NAD+ Citation48 and binds in the enoyl substrate siteCitation49. The inhibitor exhibits competitive inhibition versus NADH but uncompetitive inhibition versus NAD+ Citation48. To determine if the inhibition mechanism for SABA1 is the same as the mechanism of inhibition for triclosan, ADP was varied at fixed concentrations ATP and SABA1. The apparent inhibition constant (Ki′) for the binding of SABA1 clearly decreases as the concentration of ADP increases () indicating uncompetitive inhibition with a Ki of 10.3 ± 0.1 µM. This result combined with the competitive pattern versus ATP reported above suggests that SABA1 inhibits BC by the same mechanism as triclosan inhibits EACPR.
Scheme 2. Reaction scheme showing SABA1 binding to the ADP-bound enzyme.
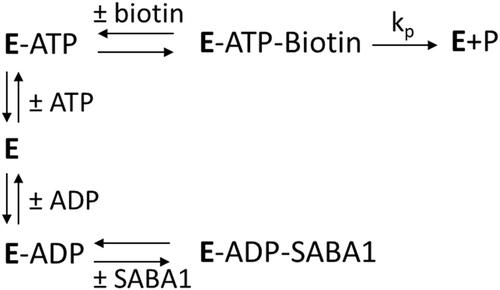
Figure 7. The effect of ADP on the apparent inhibition constant of SABA1. The curve is the best fit of the data to EquationEquation (5)(5)
(5) , indicating uncompetitive inhibition. Points are the experimentally obtained velocities.
ACC inhibition patterns
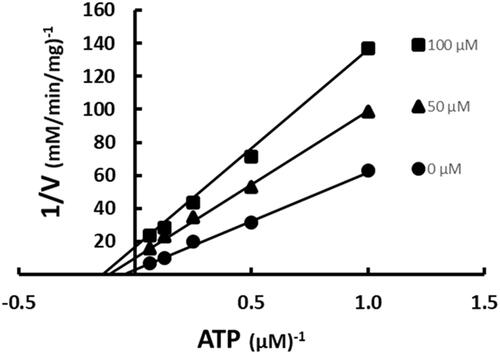
ACC is the catalytically active structure in vivoCitation22. As such, it is necessary to determine the inhibition patterns against that macromolecular complex. ATP was varied at fixed increasing concentrations of SABA1 while acetyl-CoA was held constant at subsaturating concentrations. SABA1 showed a non-competitive inhibition pattern with a Kis of 96.3 ± 31.6 µM and a Kii of 23.3 ± 4.4 µM (). These inhibition constants are lower than the ones obtained for the isolated BC subunit, indicating that SABA1 binds tighter to ACC than to isolated BC.
Figure 8. Inhibition of ACC by SABA1 with respect to ATP. The concentration of ATP was varied at fixed increasing concentrations of SABA1. Acetyl-CoA was held constant at subsaturating levels. Curves are the best fit of the data to EquationEquation (2)(2)
(2) . Points are the experimentally obtained velocities.
The above observations are consistent with a report from Silvers et al.Citation50 which found that aminooxazole, a known BC inhibitor that binds in the ATP binding siteCitation25, is competitive versus ATP when assayed with the isolated BC subunitCitation50. However, aminooxazole was non-competitive versus ATP when assayed with ACCCitation50. Moreover, aminooxazole has a lower inhibition constant for ACC than for BC (0.4 ± 0.1 μM versus 0.8 ± 0.2 μM)Citation50. A molecular explanation for both these results will have to wait for a 3 D structure of bacterial ACC.
Discussion
Biotin carboxylase inhibition
The results of this study definitively show that the antibacterial properties of SABA1 are due to inhibition of biotin carboxylase. Unlike all the known inhibitors of BC which bind in the ATP binding siteCitation25–27, SABA1 binds in the biotin-binding site. This is advantageous with respect to antibiotic development as humans have 49 different ATP-binding cassette transport proteinsCitation51, 95 helicasesCitation52, and over 500 kinasesCitation53 all of which bind and utilise ATP. The biotin carboxylase ATP binding site is structurally similar to the active sites in eukaryotic kinasesCitation27; therefore, any BC inhibitor that binds in the ATP binding site could potentially bind to one of the numerous eukaryotic ATP-utilising proteins. In fact, pyridopyrimidine which inhibits BC by binding in the ATP-binding site does significantly inhibit human scr kinaseCitation27.
Mechanism of SABA1 inhibition
The mechanism by which SABA1 inhibits BC bears a striking similarity to the mechanism of inhibition of EACPR by triclosan. Triclosan exhibits competitive inhibition versus NADH, the first substrate to bind to EACPRCitation48. SABA1 also exhibits competitive inhibition against the first substrate to bind to biotin carboxylase, ATP (). Yet, neither triclosan nor SABA1 bind in the NADH or ATP binding sites of their respective enzymes. Triclosan binds in the enoyl substrate binding site of EACPRCitation49, while SABA1 binds in the biotin-binding site of BC. NAD+, a product of the reaction catalysed by EACPR, strongly enhances triclosan binding, resulting in uncompetitive inhibition with respect to NAD+ Citation48. Likewise, ADP, a product of the reaction catalysed by BC, strongly enhances SABA1 binding, resulting in uncompetitive inhibition with respect to ADP. It is interesting to note that aminooxazole, a BC inhibitor that binds in the ATP binding siteCitation25, also enhances SABA1 binding.
The competitive inhibition of triclosan and SABA1 with respect to the enoyl substrate and biotin respectively, is explained by simple competition of the substrate and inhibitor for the same binding site. In contrast, the competitive inhibition of triclosan and SABA1 with respect to NADH and ATP is more nuanced. In the case of triclosan, NADH competes with NAD+ for binding to the free enzymeCitation47, therefore at saturating concentrations of NADH, NAD+ cannot bind to free EACPR. If NAD+ is not bound to EACPR, the binding affinity of triclosan is markedly decreasedCitation48. In other words, when NADH is bound to EACPR, NAD+, and therefore, triclosan cannot bind. This makes the binding of NADH and triclosan mutually exclusive. This mutual exclusivity manifests as competitive inhibition of triclosan versus NADH. The explanation for the SABA1 data follows an analogous pattern (Scheme 2). ATP competes with ADP for binding to BC. At saturating ATP, ADP is not bound, thereby decreasing the binding affinity of SABA1 to BC. In other words, when ATP is bound to BC, ADP, and therefore, SABA1 cannot bind. This makes the binding of ATP and SABA1 mutually exclusive. Thus, the observed competitive inhibition of SABA1 versus ATP.
Docking results
A 3 D-structure could provide a molecular explanation for why ATP prevents SABA1 binding while ADP enhances SABA1 binding. However, despite numerous attempts, a crystal structure of SABA1 bound to BC is not available. In order to gain insight into the possible molecular explanation of the observed kinetic results, SABA1 was docked into the biotin-binding site of either free BC, or BC bound to ADP and AMPPCP. While docking results are no substitute for structural data, they can provide a working hypothesis for future structure-function analyses.
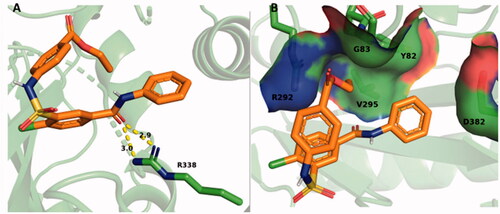
SABA1 docked onto free BC, adopts a folded conformation () with a predicted binding affinity of −6.3 kcal/mol. For reference, the carboxybiotin analogue, N1′-methoxycarbonyl biotin methyl ester, binds in the biotin binding siteCitation38 has a predicted binding affinity of −6.3 kcal/mol. R338 forms a hydrogen bond with the carbonyl oxygen of the benzylamide in SABA1 (). The ethyl ester of SABA1 sits in a positively charged pocket formed by the side chain of R292 and the main chain amide of G83 (). The phenyl ring of SABA1 is juxtaposed between V295, Y82, and the β-carbon of D382 ().
Figure 9. SABA1 docked into the biotin binding pocket of free BC. (A) R338 hydrogen bonds to the carbonyl oxygen in the benzylamide of SABA1. Yellow dashes represent hydrogen bonds, lengths are in Å. (B) Partial surface representation showing the interactions between the ethyl ester and phenyl group of SABA1 with the positive pocket and hydrophobic patch of BC respectively. In the surface representation, red is oxygen, blue is nitrogen, and green is carbon. A and B were generated with PyMOL.
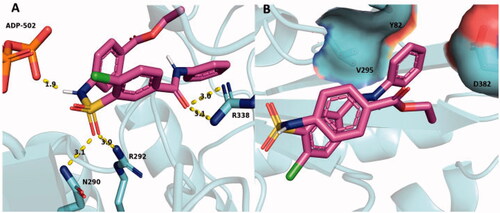
When SABA1 was docked onto BC with ADP bound, the predicted binding affinity increased to −6.8 kcal/mol. It is important to note that the predicated binding affinity of SABA1 in the ADP bound structure (−6.8 kcal/mol) is tighter than the predicted binding affinity of the carboxybiotin analogue, N1′-methoxycarbonyl biotin methyl ester, to BC (−6.3 kcal/mol). The N1′-methoxycarbonyl biotin methyl ester is known to bind in the biotin binding siteCitation38. This suggests that SABA1 binds stably to BC in the presence of ADP. R338 again forms a hydrogen bond to the carbonyl oxygen of the benzylamide in SABA1 () and the phenyl ring is again juxtaposed between V295, Y82, and the β-carbon of D382 (). However, to accommodate the β-phosphate of ADP the sulphonamide group of SABA1 was shifted 3.2 Å away from its position in the ADP free structure. This shift positions the carbonyl oxygens of the sulphonamide group within hydrogen bonding distance of R292 and N290. In addition, the amide nitrogen of the sulphonamide group forms a hydrogen bond with of the β-phosphate of ADP (). These docking results could explain the uncompetitive inhibition data versus ADP. When ADP is not present, SABA1 forms few strong interactions with BC. However, when ADP is present the new position of the sulphonamide group allows it to form hydrogen bonds with R292 and N290, along with the β-phosphate of ADP increasing the affinity of SABA1 for BC.
Figure 10. SABA1 docked into the biotin binding pocket of BC bound to ADP. (A) Hydrogen bonds from BC and ADP to SABA1. Yellow dashes represent hydrogen bonds, lengths are in Å. (B) Partial surface representation showing the interactions between the phenyl group of SABA1 and hydrophobic patch of BC. In the surface representation, red is oxygen, blue is nitrogen, and green is carbon. A and B were generated with PyMOL.
The kinetic data show that SABA1 does not bind in the presence of ATP. In order to determine a possible molecular mechanism that explains why ATP prevents SABA1 binding, SABA1 was docked onto BC with ATP analogue AMPPCP bound. With AMPPCP bound SABA1 adopts an inverted conformation with respect to the conformation it had with ADP bound (). This inversion results in the amide nitrogen of the benzylamide not being within hydrogen bond distance of R338. The γ-phosphate of AMPPCP caused the sulphonamide group of SABA1 to be positioned 5.6 Å away from its position in the ADP-bound structure (). The position of the sulphonamide group is not within hydrogen-bonding distance of R292 or N290. In addition, none of the phosphate groups of AMPPCP are within hydrogen-bonding distance of the sulphonamide group of SABA1.
Figure 11. SABA1 in the presence of AMAPCP (blue) was overlayed onto SABA1 in the presence of ADP (magenta). Note the position of the chlorine atoms (green) is flipped. Generated with PyMOL.
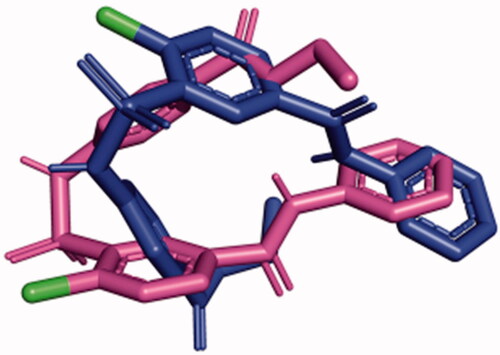
The docking results could provide an explanation of how SABA1 can simultaneously appear competitive versus ATP and uncompetitive versus ADP. ADP is necessary for efficient SABA1 binding as it positions the sulphonamide group in a favourable conformation to hydrogen bond to R292 and N290. In addition, the β-phosphate of ADP hydrogen bonds to SABA1 further enhancing the binding affinity. On the other hand, the presence of ATP forces SABA1 into an inverted conformation in which the sulphonamide group is not able to form hydrogen bonds to strengthen binding to BC.
The residues involved in hydrogen bonding between SABA1 and ADP-bound BC (N290, R292, and R338) are all involved in BC catalysisCitation29,Citation38,Citation54. N290A and R292A mutations decrease the activity of BC 250-fold and 200-fold respectivelyCitation29, while a R338Q mutation decreases BC activity 100-foldCitation54. Thus, mutation of those residues to generate resistance to SABA1 binding would be lethal to the bacterium.
Summary
This report definitively shows that SABA1 does inhibit BC and it does so with an atypical mechanism. Moreover, SABA1 is the first known inhibitor of BC with antibacterial properties that does not bind in the ATP-binding site. All other known BC inhibitors with antibacterial properties bind in the ATP-binding site. Since, biotin carboxylase is highly conserved amongst bacteria speciesCitation55 and given that SABA1 is already effective against Gram-negative bacteriaCitation28, it could serve as a scaffold for the development of novel antibiotics against the Gram-negative ESKAPE pathogens.
Disclosure statement
No potential conflict of interest was reported by the author(s).
References
- Organization WH. Global antimicrobial resistance surveillance system (glass) report: early implementation 2020. In. Global antimicrobial resistance surveillance system (glass) report: early implementation 2020; Geneva; 2020.
- CDC. Antibiotic resistance threats in the United States. In: Antibiotic resistance threats in the United States. Atlanta (GA): U.S. Department of Health and Human Services; 2019.
- CDC. Antibiotic resistance threats in the United States, 2013. In: Antibiotic resistance threats in the United States. Atlanta (GA): U.S. Centers for Disease Control and Prevention; 2013.
- Cassini A, Högberg LD, Plachouras D, et al. Attributable deaths and disability-adjusted life-years caused by infections with antibiotic-resistant bacteria in the eu and the European economic area in 2015: a population-level modelling analysis. Lancet Infect Dis 2019;19:56–66.
- Renner LD, Zan J, Hu LI, et al. Detection of eskape bacterial pathogens at the point of care using isothermal DNA-based assays in a portable degas-actuated microfluidic diagnostic assay platform. Appl Environ Microbiol 2017;83:e02449–02416.
- Pendleton JN, Gorman SP, Gilmore BF. Clinical relevance of the eskape pathogens. Expert Rev Anti Infect Ther 2013;11:297–308.
- Rice LB. Federal funding for the study of antimicrobial resistance in nosocomial pathogens: no eskape. J Infect Dis 2008:197:1079–81.
- Santajit S, Indrawattana N. Mechanisms of antimicrobial resistance in eskape pathogens. BioMed Res Int 2016:2016:2475067.
- Delcour AH. Outer membrane permeability and antibiotic resistance. Biochimica et biophysica acta 2009:1794:808–16.
- Miller SI. Antibiotic resistance and regulation of the gram-negative bacterial outer membrane barrier by host innate immune molecules. mBio 2016;7:e01541–01516.
- Breijyeh Z, Jubeh B, Karaman R. Resistance of gram-negative bacteria to current antibacterial agents and approaches to resolve it. Molecules 2020;25:1340.
- Aslam B, Wang W, Arshad MI, et al. Antibiotic resistance: a rundown of a global crisis. Infect drug Resist 2018:11;1645–58.
- Coates ARM, Halls G, Hu Y. Novel classes of antibiotics or more of the same? Br J Pharmacol 2011:163:184–94.
- Infectious Diseases Society of A. The 10 × 20 initiative: pursuing a global commitment to develop 10 new antibacterial drugs by 2020. Clin Infect Dis 2010;50:1081–83.
- Talbot GH, Jezek A, Murray BE, et al. The infectious diseases society of America’s 10 × ‘20 initiative (10 new systemic antibacterial agents us food and drug administration approved by 2020): is 20 × 20 a possibility? Clin Infect Dis 2019;69:1–11.
- Yao J, Rock CO. How bacterial pathogens eat host lipids: implications for the development of fatty acid synthesis therapeutics. J Biol Chem 2015:290:5940–5946.
- Parsons JB, Rock CO. Is bacterial fatty acid synthesis a valid target for antibacterial drug discovery? Curr Opin Microbiol 2011;14:544–49.
- Turner KH, Wessel AK, Palmer GC, et al. Essential genome of pseudomonas aeruginosa in cystic fibrosis sputum. Proc Natl Acad Sci USA 2015:112:4110–15.
- Parsons JB, Frank MW, Subramanian C, et al. Metabolic basis for the differential susceptibility of gram-positive pathogens to fatty acid synthesis inhibitors. Proc Natl Acad Sci USA 2011:108:15378–83.
- Raetz CRH, Reynolds CM, Trent MS, Bishop RE. Lipid a modification systems in gram-negative bacteria. Ann Rev Biochem 2007;76:295–329.
- Parsons JB, Rock CO. Bacterial lipids: metabolism and membrane homeostasis. Prog Lipid Res 2013;52:249–76.
- Cronan JE, Waldrop GL. Multi-subunit acetyl-coa carboxylases. Prog Lipid Res 2002;41:407–35.
- Campbell JW, John E. Cronan J. Bacterial fatty acid biosynthesis: targets for antibacterial drug discovery. Ann Rev Microbiol 2001;55:305–32.
- Freiberg C, Brunner NA, Schiffer G, et al. Identification and characterization of the first class of potent bacterial acetyl-coa carboxylase inhibitors with antibacterial activity. J Biol Chem 2004:279:26066–73.
- Mochalkin I, Miller JR, Narasimhan L, et al. Discovery of antibacterial biotin carboxylase inhibitors by virtual screening and fragment-based approaches. ACS Chem Biol 2009;4:473–83.
- Cheng CC, Shipps GW, Yang Z, et al. Discovery and optimization of antibacterial accc inhibitors. Bioorg Med Chem Lett 2009;19:6507–14.
- Miller JR, Dunham S, Mochalkin I, et al. A class of selective antibacterials derived from a protein kinase inhibitor pharmacophore. Proc Natl Acad Sci USA 2009:106:1737–42.
- Wallace J, Bowlin NO, Mills DM, et al. Discovery of bacterial fatty acid synthase type II inhibitors using a novel cellular bioluminescent reporter assay. Antimicrob Agents Chemother 2015;59:5775–87.
- Blanchard CZ, Lee YM, Frantom PA, Waldrop GL. Mutations at four active site residues of biotin carboxylase abolish substrate-induced synergism by biotin. Biochemistry 1999;38:3393–400.
- Broussard TC, Price AE, Laborde SM, Waldrop GL. Complex formation and regulation of Escherichia coli acetyl-coa carboxylase. Biochemistry 2013;52:3346–57.
- Blanchard CZ, Waldrop GL. Overexpression and kinetic characterization of the carboxyltransferase component of acetyl-coa carboxylase. J Biol Chem 1998:273:19140–45.
- Webb MR. A continuous spectrophotometric assay for inorganic phosphate and for measuring phosphate release kinetics in biological systems. Proc Natl Acad Sci USA 1992;89:4884–87.
- Cleland WW. Statistical analysis of enzyme kinetic data. Methods Enzymol 1979:63;103–38.
- Leatherbarrow RJ. Enzfitter: a non-linear regression data analysis program for the IBM PC and true compatibles; manuel. Biosoft 1987.
- Sterling T, Irwin JJ. Zinc 15-ligand discovery for everyone. J Chem Inform Model 2015;55:2324–37.
- Morris GM, Huey R, Lindstrom W, et al. Autodock4 and autodocktools4: automated docking with selective receptor flexibility. J Comput Chem 2009;30:2785–91.
- Feinstein WP, Brylinski M. Calculating an optimal box size for ligand docking and virtual screening against experimental and predicted binding pockets. J Cheminform 2015;7:18.
- Broussard TC, Pakhomova S, Neau DB, et al. Structural analysis of substrate, reaction intermediate, and product binding in haemophilus influenzae biotin carboxylase. Biochemistry 2015;54:3860–70.
- Trott O, Olson AJ. Autodock vina: improving the speed and accuracy of docking with a new scoring function, efficient optimization, and multithreading. J Comput Chem 2010;31:455–61.
- O’Boyle NM, Banck M, James CA, et al. Open babel: an open chemical toolbox. J Cheminformatics 2011;3:33.
- Schrodinger, LLC. The pymol molecular graphics system, version 1.8. In: The pymol molecular graphics system, version 1.8; November; 2015.
- Yonetani T, Theorell H. Studies on liver alcohol hydrogenase complexes. 3. Multiple inhibition kinetics in the presence of two competitive inhibitors. Arch Biochem Biophys 1964:106;243–51.
- Dimroth P, Guchhait RB, Stoll E, Lane MD. Enzymatic carboxylation of biotin: molecular and catalytic properties of a component enzyme of acetyl coa carboxylase. Proc Natl Acad Sci 1970;67:1353–60.
- Cleland WW. Determining the chemical mechanisms of enzyme-catalyzed reactions by kinetic studies. Adv Enzymol Relat Areas Mol Biol 1977:45;273–387.
- Tipton PA, Cleland WW. Catalytic mechanism of biotin carboxylase: steady-state kinetic investigations. Biochemistry 1988;27:4317–25.
- Weeks G, Wakil SJ. Studies on the mechanism of fatty acid synthesis: xviii. Preparation and general properties of the enoyl acyl carrier protein reductases from Escherichia coli. J Biol Chem 1968:243:1180–9.
- Quemard A, Sacchettini JC, Dessen A, et al. Enzymic characterization of the target for isoniazid in mycobacterium tuberculosis. Biochemistry 1995;34:8235–41.
- Ward WHJ, Holdgate GA, Rowsell S, et al. Kinetic and structural characteristics of the inhibition of enoyl (acyl carrier protein) reductase by triclosan. Biochemistry 1999;38:12514–25.
- Heath RJ, Rubin JR, Holland DR, et al. Mechanism of triclosan inhibition of bacterial fatty acid synthesis*. J Biol Chem 1999:274:11110–14.
- Silvers MA, Robertson GT, Taylor CM, Waldrop GL. Design, synthesis, and antibacterial properties of dual-ligand inhibitors of acetyl-coa carboxylase. J Med Chem 2014;57:8947–59.
- Vasiliou V, Vasiliou K, Nebert DW. Human ATP-binding cassette (abc) transporter family. Hum Genomics 2009;3:281–290.
- Umate P, Tuteja N, Tuteja R. Genome-wide comprehensive analysis of human helicases. Commun Integr Biol 2011;4:118–137.
- Duong-Ly KC, Peterson JR. The human kinome and kinase inhibition. Curr Protocols Pharmacol, 2013;Unit2.9:60.
- Sloane V, Waldrop GL. Kinetic characterization of mutations found in propionic acidemia and methylcrotonylglycinuria: evidence for cooperativity in biotin carboxylase. J Biol Chem 2004:279:15772–78.
- Tong L. Structure and function of biotin-dependent carboxylases. Cell Mol Life Sci 2013;70:863–91.