
Abstract
T-LAK-cell-originated protein kinase (TOPK), a novel member of the mitogen-activated protein kinase family, is considered an effective therapeutic target for skin inflammation. In this study, a series (A − D) of paeonol derivatives was designed and synthesised using a fragment growing approach, and their anti-inflammatory activities against lipopolysaccharide (LPS)-induced nitric oxide production in RAW264.7 cells were tested. Among them, compound B12 yielded the best results (IC50 = 2.14 μM) with low toxicity (IC50 > 50 µM). Preliminary mechanistic studies indicated that this compound could inhibit the TOPK-p38/JNK signalling pathway and phosphorylate downstream related proteins. A murine psoriasis-like skin inflammation model was used to determine its therapeutic effect.
1. Introduction
T-LAK cell-originated protein kinase (TOPK)Citation1,Citation2, a newly identified member of the MEK3/6-related MAPKK family, is expressed in a wide range of proliferating cells and tissuesCitation2–8 for the proliferation, progression, and metastasis in many cancers, including leukaemia and myelomaCitation9,Citation10. The p38 pathway, a downstream pathway of TOPK, is a key regulator of proinflammatory cytokine biosynthesis, including TNF-α, IL-1β, and COX-2, at the transcriptional and translational levelsCitation11–13. In recent years, many studies have shown that TOPK plays an important role in regulating p38 with anti-inflammatory effectsCitation14–18. Therefore, targeting the TOPK pathway is a promising strategy for to treat inflammatory diseases.
Paeonol isolated from traditional Chinese herbal medicines and used as a topical drug in ChinaCitation15,Citation16 exhibits a wide range of biological effects, including anti-inflammatory, immune regulatory, anti-tumour, and anti-oxidative effectsCitation18–20. Studies have indicated that paeonol could inhibit the expression of TOPK with anti-inflammatory activity at 100 µM16 and a microthermophoresis (MST) assay confirmed the affinity of paeonol for TOPK. Phosphorylation levels of p38, JNKs, MSK1 and histone H2AX were suppressed by paeonol by inhibiting TOPK activity in a time-and dose-dependent manner in vitro and in vivoCitation17. Although paeonol has multiple sites for structural modification, modification of the hydroxyl group is a general means. Among them, compounds 1 and 2, reported by Huang, showed strong anti-inflammatory activity and were obtained by introducing bromine and a long alkyl chainCitation21. Compound 3 showed suitable anti-inflammatory activity and was modified at its hydroxylCitation22 (). In general, the derivatives of paeonol by modification of the 2-OH or 1-acetyl groups have shown anti-inflammatory activities. However, their SARs and specific target characteristics for anti-inflammation remain unclear. Additionally, modification of the substituents at the 5-position of paeonol and evaluating their anti-inflammatory properties have rarely been reported, posing a challenging project due to their unknown anti-inflammatory activities.
Figure 1. The process of design and analysis. (A) Some of paeonol derivatives; (B) Urea linker as fragment of modification in this study.
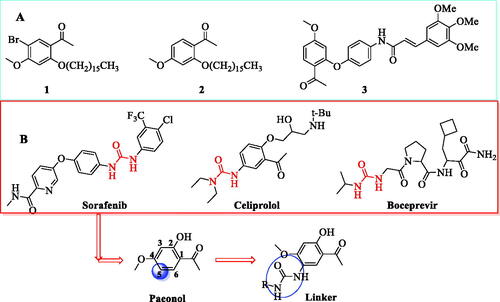
Herein, we present the design and synthesis of paeonol derivatives by the introduction of a urea linker at the 5-position of paeonol so as to discover potent compounds that regulate the TOPK pathway. The urea moiety is inherent in a various clinically approved drugs such as sorafenib, celiprolol and boceprevir () because of their strong ability to form multiple stable hydrogen bonds with protein or receptor targetsCitation23. Thus, a urea linker, which could modulate drug potency and selectivity and improving drug properties, was introduced at the ortho-position of the methoxy group. Meanwhile, to balance the activity and toxicity and explore the structure-activity relationship, the linker was substituted with an array of amines, including alkyl amines, heterocyclic/cyclic amines, and aniline ().
2. Experimental section
2.1. Materials and methods
All commercial reagents and solvents were purchased from commercial suppliers and used without further purification. Reactions were monitored by thin-layer chromatography (TLC) and visualised under UV light at 254 and 365 nm. The chromatograms were conducted on silica gel (3 0 0 ∼ 400 mesh) using combiflash chromatography systems (Teledyne ISCO Rf 200). 1H and 13 C NMR spectral data were recorded with a Bruker or Agilent, 400, 600 MHz spectrometer in CDCl3 or DMSO-d6 using tetramethylsilane (TMS) as internal standard (IS). High-resolution mass spectrometry (HRMS) was recorded on an Agilent Technologies LC-TOF instrument.
2.2. Chemistry
2.2.1. Synthesis of 1–(5-amino-2-hydroxy-4-methoxyphenyl) ethan-1-one (2)
1–(2-hydroxy-4-methoxy-5-nitrophenyl) ethan-1-one (1). To a solution of paeonol (10 g, 0.06 mol) in acetic acid (40 ml), nitric acid (16 ml) was dropwise added under ice/water cooling and it was stirred for 3 h. The solution was poured into ice water and yellow precipitate was produced. The crude was filtered, re-crystallised with ethanol to give compound 1 (7.2 g, 57% yield) as yellow crystal.
1–(5-amino-2-hydroxy-4-methoxyphenyl) ethan-1-one (2). Compound 1 (2 g, 10 mmol) was dissolved in methanol (40 ml) and 10% Pd/C (4% mmol) was added. The suspension was acidified to pH 3 ∼ 4 by addition of 1 M HCl solution. The mixture was vigorously stirred under hydrogen gas at atmospheric pressure about 4 h. Upon completion of the reaction (as determined by TLC), the catalyst was removed by filtration and the filtrate was concentrated under reduced pressure. The residue was recrystallised with ethanol to give compound 2 (1.7 g, 95% yield) as light yellow crystal. 1H NMR (300 MHz, DMSO-d6) δ 12.48 (s, 1H, OH), 9.95 (s, 3H, NH3+), 8.00 (s, 1H, ArH), 6.77 (s, 1H, ArH), 3.94 (s, 3H, OCH3), 2.55 (s, 3H, CH3).
2.2.2. General procedure for synthesis of compounds A1 − A14, B1 − B13, C1 − C17 and D1 − D4
Compound 2 (100 mg, 0.552 mmol, 1.0 eq) and N, N-diisopropylethylamine (273 μL, 1.656 mmol, 3.0 eq) were dissolved in DCM under ice-water bath. A solution of triphosgene (67 mg, 0.226 mmol, 0.41 eq) in DCM was added dropwise and the mixture was vigorously stirred at room temperature for 1 h. Further, the corresponding amines (1.2 eq) was added at room temperature. Upon completion of the reaction (as indicated by TLC in 3 ∼ 5 h), the solvent was removed by rotary evaporation. The residue was purified by flash chromatography on silica (0 − 50% ethyl acetate/petroleum ether) to give compounds A1 − 14, B1 − 13, C1 − 7, D1−D4, respectively.
1–(5-acetyl-4-hydroxy-2-methoxyphenyl)-3-methylurea (A1). White solid, 52.98% yield, m. p.: 211–213 °C. 1H NMR (400 MHz, DMSO-d6) δ 12.46 (s, 1H), 8.52–8.47 (m, 1H), 7.82 (s, 1H), 6.62–6.53 (m, 2H), 3.90 (s, 3H), 2.64 (d, J = 4.6 Hz, 3H), 2.51 (s, 3H). 13 C NMR (101 MHz, DMSO-d6) δ 203.54, 159.18, 156.51, 155.69, 122.30, 120.39, 112.51, 99.63, 56.75, 27.04, 26.47. HRMS (ESI): m/z [M + Na]+ calcd for C11H14N2O4: 261.0846; found: 261.0846.
3–(5-acetyl-4-hydroxy-2-methoxyphenyl)-1,1-diethylurea (A2). White solid, 63.84% yield, m. p.: 132–134 °C. 1H NMR (400 MHz, DMSO-d6) δ 12.56 (s, 1H), 7.98 (s, 1H), 7.32 (s, 1H), 6.56 (s, 1H), 3.86 (s, 3H), 3.30 (q, J = 7.1 Hz, 4H), 2.53 (s, 3H), 1.10 (t, J = 7.1 Hz, 6H). 13 C NMR (101 MHz, DMSO-d6) δ 203.45, 161.01, 159.12, 155.20, 126.45, 121.45, 112.63, 99.78, 56.82, 41.09 (2 C), 27.13, 14.27 (2 C). HRMS (ESI): m/z [M + H]+ calcd for C14H20N2O4: 281.1496; found: 281.1498.
3–(5-acetyl-4-hydroxy-2-methoxyphenyl)-1,1-diisopropylurea (A3). White solid, 40.94% yield, m. p.: 148–149 °C. 1H NMR (400 MHz, DMSO-d6) δ 12.51 (s, 1H), 8.21 (s, 1H), 7.02 (s, 1H), 6.58 (s, 1H), 3.99–3.90 (m, 2H), 3.89 (s, 3H), 2.53 (s, 3H), 1.23 (d, J = 6.8 Hz, 12H). 13 C NMR (101 MHz, DMSO-d6) δ 203.54, 160.19, 157.36, 154.53, 123.47, 121.90, 112.62, 99.75, 57.04, 45.23 (2 C), 27.20, 21.56 (4 C). HRMS (ESI): m/z [M + Na]+ calcd for C16H24N2O4: 331.1628; found: 331.1631.
1–(5-acetyl-4-hydroxy-2-methoxyphenyl)-3-methoxyurea (A4). White solid, 66.68% yield, m. p.: 176–177 °C. 1H NMR (400 MHz, DMSO-d6) δ 12.52 (s, 1H), 9.67 (s, 1H), 8.26 (s, 1H), 7.99 (s, 1H), 6.61 (s, 1H), 3.90 (s, 3H), 3.64 (s, 3H), 2.53 (s, 3H). 13 C NMR (101 MHz, DMSO-d6) δ 203.37, 160.67, 157.36, 157.24, 123.24, 119.97, 112.68, 99.99, 64.31, 56.97, 27.17. HRMS (ESI): m/z [M + Na]+ calcd for C11H14N2O5: 277.0795; found: 277.0797.
1–(5-acetyl-4-hydroxy-2-methoxyphenyl)-3–(2,2,2-trifluoroethyl) urea (A5). White solid, 33.41% yield, m. p.: 232–234 °C. 1H NMR (400 MHz, DMSO-d6) δ 12.47 (s, 1H), 8.47 (d, J = 4.7 Hz, 1H), 8.12 (s, 1H), 7.31 (t, J = 6.4 Hz, 1H), 6.58 (s, 1H), 3.99–3.89 (m, 5H), 2.51 (s, 3H). 13 C NMR (101 MHz, DMSO-d6) δ 203.50, 159.60, 155.81, 155.40, 129.54, 125.57 (d, J = 279.0 Hz), 120.77, 112.55, 99.79, 56.83, 40.46, 27.09. HRMS (ESI): m/z [M + Na]+ calcd for C12H13F3N2O4: 329.0720; found: 329.0718.
1–(5-acetyl-4-hydroxy-2-methoxyphenyl)-3-ethylurea (A6). White solid, 33.41% yield, m. p.: 211–212 °C. 1H NMR (600 MHz, DMSO-d6) δ 12.44 (s, 1H), 8.51 (s, 1H), 7.76 (s, 1H), 6.69 (t, J = 4.7 Hz, 1H), 6.54 (s, 1H), 3.89 (s, 3H), 3.12–3.06 (m, 2H), 2.50 (s, 3H), 1.04 (t, J = 7.2 Hz, 3H). 13 C NMR (151 MHz, DMSO-d6) δ 203.45, 159.09, 155.76, 155.58, 122.35, 120.22, 112.54, 99.58, 56.71, 34.32, 26.97, 15.83. HRMS (ESI): m/z [M + Na]+ calcd for C12H16N2O4: 275.1002; found: 275.1005.
3–(5-acetyl-4-hydroxy-2-methoxyphenyl)-1,1-dimethylurea (A7). White solid, 70.43% yield, m. p.: 176–177 °C. 1H NMR (600 MHz, DMSO-d6) δ 12.55 (s, 1H), 7.96 (s, 1H), 7.46 (s, 1H), 6.56 (s, 1H), 3.85 (s, 3H), 2.90 (s, 6H), 2.52 (s, 3H). 13 C NMR (151 MHz, DMSO-d6) δ 203.31, 161.03, 159.17, 156.50, 126.39, 121.45, 112.66, 99.80, 56.72, 56.70, 36.46, 27.03. HRMS (ESI): m/z [M + H]+ calcd for C12H16N2O4: 253.1183; found: 253.1185.
1–(5-acetyl-4-hydroxy-2-methoxyphenyl)-3-(tert-butyl) urea (A8). White solid, 22.30% yield, m. p.: 241–242 °C. 1H NMR (600 MHz, DMSO-d6) δ 12.45 (s, 1H), 8.52 (s, 1H), 7.72 (s, 1H), 6.66 (s, 1H), 6.53 (s, 1H), 3.89 (s, 3H), 2.52 (s, 3H), 1.28 (s, 9H). 13 C NMR (151 MHz, DMSO-d6) δ 203.51, 158.83, 155.30, 155.01, 122.60, 119.57, 112.51, 99.52, 56.70, 49.79, 29.53 (3 C), 27.09. HRMS (ESI): m/z [M + H]+ calcd for C14H20N2O4: 281.1496; found: 281.1495.
1–(5-acetyl-4-hydroxy-2-methoxyphenyl)-3-cyclopropylurea (A9). White solid, 69.04% yield, m. p.: 191–192 °C. 1H NMR (600 MHz, DMSO-d6) δ 12.45 (s, 1H), 8.52 (s, 1H), 7.69 (s, 1H), 6.91 (s, 1H), 6.55 (s, 1H), 3.89 (s, 3H), 2.51 (m, 4H), 0.62 (m, 2H), 0.37 (m, 2H). 13 C NMR (151 MHz, DMSO-d6) δ 203.46, 159.18, 156.51, 155.55, 122.11, 120.21, 112.54, 99.63, 56.78, 27.00, 22.74, 6.71 (2 C). HRMS (ESI): m/z [M + H]+ calcd for C13H16N2O4: 265.1183; found: 265.1183.
N-(5-acetyl-4-hydroxy-2-methoxyphenyl)-4-methylpiperazine-1-carboxamide (A10). White solid, 63.62% yield, m. p.: 141–142 °C. 1H NMR (600 MHz, DMSO-d6) δ 12.56 (s, 1H), 7.87 (s, 1H), 7.73 (s, 1H), 6.55 (s, 1H), 3.84 (s, 3H), 3.38 (d, J = 10.4 Hz, 4H), 2.52 (s, 3H), 2.29 (s, 4H), 2.19 (s, 3H). 13 C NMR (151 MHz, DMSO-d6) δ 203.31, 161.35, 159.80, 156.03, 127.52, 121.10, 112.71, 99.88, 56.66, 54.86 (2 C), 46.18, 44.01 (2 C), 27.09. HRMS (ESI): m/z [M + H]+ calcd for C15H21N3O4: 308.1605; found: 308.1606.
N-(5-acetyl-4-hydroxy-2-methoxyphenyl) morpholine-4-carboxamide (A11). White solid, 48.57% yield, m. p.: 220–221 °C. 1H NMR (600 MHz, DMSO-d6) δ 12.56 (s, 1H), 7.89 (s, 1H), 7.78 (s, 1H), 6.56 (s, 1H), 3.84 (s, 3H), 3.60 (s, 4H), 3.38 (d, J = 4.1 Hz, 4H), 2.53 (s, 3H). 13 C NMR (151 MHz, DMSO-d6) δ 203.29, 161.42, 159.84, 156.25, 127.64, 120.93, 112.73, 99.92, 66.39 (2 C), 56.67, 44.53 (2 C), 27.10. HRMS (ESI): m/z [M + H]+ calcd for C14H18N2O5: 295.1288; found: 295.1290.
N-(5-acetyl-4-hydroxy-2-methoxyphenyl) pyrrolidine-1-carboxamide (A12). White solid, 73.70% yield, m. p.: 118–120 °C. 1H NMR (400 MHz, DMSO-d6) δ 12.55 (s, 1H), 8.07 (s, 1H), 7.23 (s, 1H), 6.57 (s, 1H), 3.87 (s, 3H), 3.34 (t, J = 4.9 Hz, 4H), 2.52 (d, J = 2.8 Hz, 3H), 1.85 (t, J = 6.5 Hz, 4H). 13 C NMR (101 MHz, DMSO-d6) δ 203.44, 160.86, 158.75, 154.60, 125.80, 121.31, 112.61, 99.79, 56.77, 45.91 (2 C), 27.10 (2 C), 25.53. HRMS (ESI): m/z [M + H]+ calcd for C14H18N2O4: 279.1339; found: 279.1339.
N-(5-acetyl-4-hydroxy-2-methoxyphenyl)-4-ethylpiperazine-1-carboxamide (A13). White solid, 50.52% yield, m. p.: 125–126 °C. 1H NMR (400 MHz, DMSO-d6) δ 12.58 (s, 1H), 7.88 (s, 1H), 7.74 (s, 1H), 6.56 (s, 1H), 3.85 (s, 3H), 3.43–3.39 (m, 4H), 2.53 (s, 3H), 2.34 (dd, J = 12.3, 5.5 Hz, 6H), 1.02 (t, J = 7.2 Hz, 3H). 13 C NMR (101 MHz, DMSO-d6) δ 203.41, 161.47, 159.99, 156.06, 127.84, 121.07, 112.68, 99.90, 56.68, 52.69, 52.09, 44.09, 27.16, 12.39. HRMS (ESI): m/z [M + Na]+ calcd for C16H23N3O4: 344.1581; found: 344.1584.
N-(5-acetyl-4-hydroxy-2-methoxyphenyl) thiazolidine-3-carboxamide (A14). White solid, 66.47% yield, m. p.: 172–174 °C. 1H NMR (400 MHz, DMSO-d6) δ 12.58 (s, 1H), 7.87 (d, J = 4.6 Hz, 1H), 7.84 (s, 1H), 6.58 (s, 1H), 4.50 (s, 2H), 3.85 (s, 3H), 3.68 (t, J = 6.3 Hz, 2H), 3.04 (t, J = 6.3 Hz, 2H), 2.53 (s, 3H). 13 C NMR (101 MHz, DMSO-d6) δ 203.38, 161.75, 160.14, 154.96, 128.30, 120.51, 112.72, 100.01, 56.71, 49.10, 48.82, 30.77, 27.17. HRMS (ESI): m/z [M + Na]+ calcd for C13H16N2O4S: 319.0723; found: 319.0727.
1–(5-acetyl-4-hydroxy-2-methoxyphenyl)-3-phenylurea (B1). White solid, 25.22% yield, m. p.: 184–185 °C. 1H NMR (600 MHz, DMSO-d6) δ 12.49 (s, 1H), 9.19 (s, 1H), 8.56 (s, 1H), 8.14 (s, 1H), 7.45 (d, J = 7.7 Hz, 2H), 7.27 (t, J = 7.9 Hz, 2H), 6.96 (t, J = 7.3 Hz, 1H), 6.61 (s, 1H), 3.95 (s, 3H), 2.55 (s, 3H). 13 C NMR (151 MHz, DMSO-d6) δ 203.44, 159.60, 155.87, 153.11, 140.20, 129.23(2 C), 122.18, 121.45, 120.84, 118.43 (2 C), 112.67, 99.84, 56.89, 27.12. HRMS (ESI): m/z [M + H]+ calcd for C16H16N2O4: 301.1183; found: 301.1184.
1–(5-acetyl-4-hydroxy-2-methoxyphenyl)-3-(m-tolyl) urea (B2). White solid, 32.34% yield, m. p.: 209–210 °C. 1H NMR (600 MHz, DMSO-d6) δ 12.49 (s, 1H), 9.12 (s, 1H), 8.56 (s, 1H), 8.12 (s, 1H), 7.32 (s, 1H), 7.20 (d, J = 8.1 Hz, 1H), 7.15 (t, J = 7.7 Hz, 1H), 6.78 (d, J = 7.4 Hz, 1H), 6.61 (s, 1H), 3.95 (s, 3H), 2.55 (s, 3H), 2.28 (s, 3H). 13 C NMR (151 MHz, DMSO-d6) δ 203.46, 159.56, 155.82, 153.07, 140.14, 138.42, 129.07, 122.93, 121.50, 120.72, 118.91, 115.61, 112.65, 99.82, 56.88, 27.12, 21.67. HRMS (ESI): m/z [M + H]+ calcd for C17H18N2O4: 315.1339; found: 315.1338.
1–(5-acetyl-4-hydroxy-2-methoxyphenyl)-3-(o-tolyl) urea (B3). White solid, 15.10% yield, m. p.: 238–239 °C. 1H NMR (600 MHz, DMSO-d6) δ 12.48 (s, 1H), 8.56 (s, 1H), 8.55 (s, 1H), 8.41 (s, 1H), 7.81 (d, J = 8.0 Hz, 1H), 7.16 (d, J = 7.3 Hz, 1H), 7.13 (t, J = 7.6 Hz, 1H), 6.94 (t, J = 7.4 Hz, 1H), 6.61 (s, 1H), 3.96 (s, 3H), 2.53 (s, 3H), 2.25 (s, 3H). 13 C NMR (151 MHz, DMSO-d6) δ 203.45, 159.53, 156.00, 153.45, 137.82, 130.59, 128.27, 126.47, 123.17, 122.05, 121.62, 121.11, 112.65, 99.82, 56.87, 27.07, 18.50. HRMS (ESI): m/z [M + H]+ calcd for C17H18N2O4: 315.1339; found: 315.1339.
1–(5-acetyl-4-hydroxy-2-methoxyphenyl)-3-(p-tolyl) urea (B4). White solid, 52.57% yield, m. p.: 218–219 °C. 1H NMR (600 MHz, DMSO-d6) δ 12.49 (s, 1H), 9.09 (s, 1H), 8.55 (s, 1H), 8.09 (s, 1H), 7.34 (d, J = 8.3 Hz, 2H), 7.08 (d, J = 7.9 Hz, 2H), 6.60 (s, 1H), 3.94 (s, 3H), 2.54 (s, 3H), 2.24 (s, 3H). 13 C NMR (151 MHz, DMSO-d6) δ 203.46, 159.53, 155.81, 153.14, 137.63, 130.98, 129.62 (2 C), 121.55, 120.71, 118.50 (2 C), 112.65, 99.80, 56.88, 27.09, 20.76. HRMS (ESI): m/z [M + H]+ calcd for C17H18N2O4: 315.1339; found: 315.1339.
1–(5-acetyl-4-hydroxy-2-methoxyphenyl)-3–(3-fluorophenyl) urea (B5). White solid, 27.72% yield, m. p.: 217–218 °C. 1H NMR (600 MHz, DMSO-d6) δ 12.49 (s, 1H), 9.41 (s, 1H), 8.53 (s, 1H), 8.19 (s, 1H), 7.51 (d, J = 12.0 Hz, 1H), 7.30 (dd, J = 15.3, 7.9 Hz, 1H), 7.08 (d, J = 7.7 Hz, 1H), 6.77 (td, J = 8.5, 2.4 Hz, 1H), 6.62 (s, 1H), 3.95 (s, 3H), 2.55 (s, 3H). 13 C NMR (151 MHz, DMSO-d6) δ 203.43, 163.69, 162.09, 159.78, 155.98, 152.94, 142.06 (d, J = 11.4 Hz), 130.78 (d, J = 9.9 Hz),121.10, 114.11, 112.69, 108.49 (d, J = 21.1 Hz), 105.07 (d, J = 26.5 Hz), 99.91, 56.92, 27.15. HRMS (ESI): m/z [M + H]+ calcd for C16H15FN2O4: 319.1089; found: 319.3030.
1–(5-acetyl-2-methoxyphenyl)-3–(4-fluorophenyl) urea (B6). White solid, 16.45% yield, m. p.: 257–259 °C. 1H NMR (400 MHz, DMSO-d6) δ 12.50 (s, 1H), 9.23 (s, 1H), 8.54 (s, 1H), 8.12 (s, 1H), 7.49–7.43 (m, 2H), 7.15–7.08 (m, 2H), 6.61 (s, 1H), 3.94 (s, 3H), 2.54 (s, 3H). 13 C NMR (101 MHz, DMSO-d6) δ 203.53, 159.64, 157.73 (d, J = 237.9 Hz), 155.85, 153.17, 136.54 (d, J = 2.4 Hz), 121.39, 120.79, 120.07 (d, J = 7.7 Hz, 2 C), 115.80 (d, J = 22.2 Hz, 2 C), 112.63, 99.86, 56.93, 27.18. HRMS (ESI): m/z [M + Na]+ calcd for C16H15FN2O3: 341.0908; found: 341.0904.
1–(5-acetyl-2-methoxyphenyl)-3–(2-fluorophenyl) urea (B7). White solid, 17.36% yield, m. p.: 186–187 °C. 1H NMR (400 MHz, DMSO-d6) δ 12.50 (s, 1H), 9.13 (d, J = 1.6 Hz, 1H), 8.69 (s, 1H), 8.55 (s, 1H), 8.18 (td, J = 8.3, 1.4 Hz, 1H), 7.22 (ddd, J = 11.6, 8.2, 1.2 Hz, 1H), 7.12 (t, J = 7.7 Hz, 1H), 7.03–6.96 (m, 1H), 6.61 (s, 1H), 3.94 (s, 3H), 2.54 (d, J = 5.0 Hz, 3H). 13 C NMR (101 MHz, DMSO-d6) δ 203.52, 159.76, 156.03, 152.97, 152.41(d, J = 242.4 Hz), 128.07 (d, J = 10.4 Hz), 124.93 (d, J = 3.7 Hz), 122.77 (d, J = 7.8 Hz), 121.17 (d, J = 17.3 Hz), 121.09 (2 C), 115.43 (d, J = 19.0 Hz), 112.61, 99.88, 56.90, 27.19. HRMS (ESI): m/z [M + Na]+ calcd for C16H15FN2O3: 341.0908; found: 341.0912.
1–(5-acetyl-4-hydroxy-2-methoxyphenyl)-3–(3-methoxyphenyl) urea (B8). White solid, 32.20% yield, m. p.: 176–177 °C. 1H NMR (600 MHz, DMSO-d6) δ 12.49 (s, 1H), 9.21 (s, 1H), 8.54 (s, 1H), 8.12 (s, 1H), 7.19–7.15 (m, 2H), 6.94 (dd, J = 8.1, 0.7 Hz, 1H), 6.60 (s, 1H), 6.54 (dd, J = 8.2, 2.3 Hz, 1H), 3.94 (s, 3H), 3.73 (s, 3H), 2.55 (s, 3H). 13 C NMR (151 MHz, DMSO-d6) δ 203.43, 160.18, 159.64, 155.89, 153.02, 141.43, 130.00, 121.37, 120.88, 112.67, 110.77, 107.61, 104.23, 99.83, 56.87, 55.39, 27.13. HRMS (ESI): m/z [M + Na]+ calcd for C17H18N2O5: 353.1108; found: 353.1105.
1–(5-acetyl-4-hydroxy-2-methoxyphenyl)-3–(2-methoxyphenyl) urea (B9). White solid, 35.16% yield, m. p.: 228–229 °C. 1H NMR (600 MHz, DMSO-d6) δ 12.49 (s, 1H), 8.79 (d, J = 12.4 Hz, 2H), 8.53 (s, 1H), 8.11 (dd, J = 8.0, 1.6 Hz, 1H), 7.00 (dd, J = 8.1, 1.3 Hz, 1H), 6.94 (td, J = 7.8, 1.6 Hz, 1H), 6.88 (td, J = 7.8, 1.3 Hz, 1H), 6.59 (s, 1H), 3.94 (s, 3H), 3.86 (s, 3H), 2.54 (s, 3H). HRMS (ESI): m/z [M + H]+ calcd for C17H18N2O5: 331.1288; found: 331.1291.
1–(5-acetyl-2-methoxyphenyl)-3–(4-methoxyphenyl) urea (B10). White solid, 27.75% yield, m. p.: 227–228 °C. 1H NMR (400 MHz, DMSO-d6) δ 12.49 (s, 1H), 9.02 (s, 1H), 8.55 (s, 1H), 8.05 (s, 1H), 7.38–7.31 (m, 2H), 6.90–6.82 (m, 2H), 6.60 (s, 1H), 3.94 (s, 3H), 3.71 (s, 3H), 2.54 (s, 3H). 13 C NMR (101 MHz, DMSO-d6) δ 203.55, 159.49, 155.74, 154.83, 153.27, 133.26, 121.66, 120.52, 120.13 (2 C), 114.48 (2 C), 112.60, 99.80, 56.89, 55.61, 27.16. HRMS (ESI): m/z [M + Na]+ calcd for C17H18N2O4: 353.1108; found: 353.1108.
1–(5-acetyl-4-hydroxy-2-methoxyphenyl)-3–(4-(trifluoromethyl) phenyl) urea (B11). White solid, 52.52% yield, m. p.: 242–243 °C. 1H NMR (600 MHz, DMSO-d6) δ 12.50 (s, 1H), 9.59 (s, 1H), 8.54 (s, 1H), 8.24 (s, 1H), 7.66 (d, J = 8.7 Hz, 2H), 7.62 (d, J = 8.8 Hz, 2H), 6.62 (s, 1H), 3.95 (s, 3H), 2.55 (s, 3H). 13 C NMR (151 MHz, DMSO-d6) δ 203.39, 159.88, 156.00, 152.82, 143.90, 126.51 (d, J = 3.7 Hz,2C), 124.99 (d, J = 270.8 Hz), 122.18 (q, J = 31.8 Hz), 121.17, 120.98, 118.05 (2 C), 112.68, 99.90, 56.93, 27.11. HRMS (ESI): m/z [M + H]+ calcd for C17H15F3N2O4: 369.1057; found: 369.1054.
1–(5-acetyl-4-hydroxy-2-methoxyphenyl)-3–(3-(trifluoromethyl) phenyl) urea (B12). White solid, 54.64% yield, m. p.: 228–229 °C. 1H NMR (600 MHz, DMSO-d6) δ 12.50 (s, 1H), 9.54 (s, 1H), 8.52 (s, 1H), 8.19 (s, 1H), 8.03 (s, 1H), 7.54–7.48 (m, 2H), 7.32–7.28 (m, 1H), 6.62 (s, 1H), 3.95 (s, 3H), 2.56 (s, 3H). 13 C NMR (151 MHz, DMSO-d6) δ 203.43, 159.89, 156.05, 152.98 (d, J = 11.2 Hz), 141.05, 130.38, 130.06 (d, J = 31.3 Hz), 124.64 (d, J = 272.4 Hz), 121.93, 121.12 (d, J = 39.7 Hz), 118.42 (d, J = 3.8 Hz), 114.22 (d, J = 4.0 Hz), 112.70, 99.91, 79.59, 56.91, 27.18. HRMS (ESI): m/z [M + H]+ calcd for C17H15F3N2O4: 369.1057; found: 369.1054.
1–(5-acetyl-4-hydroxy-2-methoxyphenyl)-3–(4-(trifluoromethoxy) phenyl) urea (B13). White solid, 55.81% yield, m. p.: 209–210 °C. 1H NMR (600 MHz, DMSO-d6) δ 12.49 (s, 1H), 9.39 (s, 1H), 8.54 (s, 1H), 8.16 (s, 1H), 7.57–7.53 (m, 2H), 7.27 (d, J = 8.6 Hz, 2H), 6.61 (s, 1H), 3.94 (s, 3H), 2.54 (s, 3H). 13 C NMR (151 MHz, DMSO-d6) δ 203.39, 159.75, 155.92, 153.01, 143.00, 139.46, 122.11, 121.20, 120.99, 120.64 (q, J = 255.1 Hz), 119.56, 119.46, 112.66, 99.85, 79.59, 56.87, 27.07. HRMS (ESI): m/z [M + H]+ calcd for C17H15F3N2O5: 385.1006; found: 385.1003.
1–(5-acetyl-4-hydroxy-2-methoxyphenyl)-3–(2-chlorobenzyl) urea (C1). White solid, 15.24% yield, m. p.: 221–222 °C. 1H NMR (600 MHz, DMSO-d6) δ 12.45 (s, 1H), 8.52 (s, 1H), 8.06 (s, 1H), 7.45 (dd, J = 7.8, 1.2 Hz, 1H), 7.41 (dd, J = 7.6, 1.5 Hz, 1H), 7.35 (td, J = 7.4, 1.2 Hz, 1H), 7.30 (td, J = 7.7, 1.7 Hz, 1H), 7.25 (t, J = 5.9 Hz, 1H), 6.56 (s, 1H), 4.37 (d, J = 5.9 Hz, 2H), 3.91 (s, 3H), 2.50 (s, 3H). 13 C NMR (151 MHz, DMSO-d6) δ 203.44, 159.28, 155.78, 137.67, 132.56, 129.56, 129.47, 129.06, 127.67, 122.12, 120.36, 112.55, 99.68, 79.60, 56.76, 41.18, 27.02. HRMS (ESI): m/z [M + H]+ calcd for C17H17ClN2O4: 349.0950; found: 349.0947.
1–(5-acetyl-4-hydroxy-2-methoxyphenyl)-3-benzylurea (C2). White solid, 58.28% yield, m. p.: 194–195 °C. 1H NMR (400 MHz, DMSO-d6) δ 12.48 (s, 1H), 8.54 (s, 1H), 7.97 (s, 1H), 7.38–7.24 (m, 6H), 6.57 (s, 1H), 4.30 (d, J = 5.8 Hz, 2H), 3.91 (s, 3H), 2.51 (d, J = 2.6 Hz, 3H). 13 C NMR (101 MHz, DMSO-d6) δ 203.57, 159.23, 155.89, 155.59, 140.69, 128.82 (2 C), 127.60 (2 C), 127.24, 122.25, 120.19, 112.52, 99.67, 56.78, 43.19, 27.09. HRMS (ESI): m/z [M + Na]+ calcd for C17H18N2O4: 337.1159; found: 337.1158.
1–(5-acetyl-2-methoxyphenyl)-3–(4-methylbenzyl) urea (C3). White solid, 49.78% yield, m. p.: 146–147 °C. 1H NMR (400 MHz, DMSO-d6) δ 12.47 (s, 1H), 8.54 (s, 1H), 7.94 (s, 1H), 7.21–7.12 (m, 5H), 6.56 (s, 1H), 4.25 (d, J = 5.7 Hz, 2H), 3.90 (s, 3H), 2.51 (s, 3H), 2.28 (s, 3H). 13 C NMR (101 MHz, DMSO-d6) δ 203.56, 159.21, 155.86, 155.57, 137.60, 136.27, 129.35 (2 C), 127.60 (2 C), 122.28, 120.14, 112.52, 99.65, 54.18, 42.94, 26.49, 21.55. HRMS (ESI): m/z [M + Na]+ calcd for C18H20N2O3: 351.1315; found: 351.1318.
1–(5-acetyl-2-methoxyphenyl)-3–(4-fluorobenzyl) urea (C4). White solid, 36.58% yield, m. p.: 241–242 °C. 1H NMR (400 MHz, DMSO-d6) δ 12.47 (s, 1H), 8.53 (s, 1H), 7.96 (s, 1H), 7.33 (dd, J = 8.5, 5.7 Hz, 2H), 7.22 (t, J = 5.9 Hz, 1H), 7.20–7.13 (m, 2H), 6.57 (s, 1H), 4.28 (d, J = 5.8 Hz, 2H), 3.90 (s, 3H), 2.51 (s, 3H). 13 C NMR (101 MHz, DMSO-d6) δ 203.54, 161.61 (d, J = 242.0 Hz), 159.27, 155.88, 155.63, 136.95 (d, J = 3.0 Hz), 129.53 (d, J = 8.2 Hz, 2 C), 122.18, 120.28, 115.51 (d, J = 21.3 Hz, 2 C), 112.53, 99.67, 56.77, 42.45, 27.08. HRMS (ESI): m/z [M + Na]+ calcd for C17H17FN2O3: 355.1065; found: 355.1065.
1–(5-acetyl-4-hydroxy-2-methoxyphenyl)-3–(4-methoxybenzyl) urea (C5). White solid, 32.83% yield, m. p.: 233–234 °C. 1H NMR (400 MHz, DMSO-d6) δ 12.47 (s, 1H), 8.54 (s, 1H), 7.92 (s, 1H), 7.24–7.20 (m, 2H), 7.13 (t, J = 5.8 Hz, 1H), 6.92–6.88 (m, 2H), 6.56 (s, 1H), 4.22 (d, J = 5.7 Hz, 2H), 3.90 (s, 3H), 3.73 (d, J = 2.8 Hz, 3H), 2.52 (s, 3H). 13 C NMR (101 MHz, DMSO-d6) δ 203.57, 159.18, 158.67, 155.82, 155.56, 132.54, 128.97 (2 C), 122.28, 120.14, 114.20 (2 C), 112.52, 99.65, 56.78, 55.52, 42.66, 27.09. HRMS (ESI): m/z [M + Na]+ calcd for C18H20N2O5: 367.1264; found: 367.1260.
1–(5-acetyl-4-hydroxy-2-methoxyphenyl)-3–(2-methoxybenzyl) urea (C6). White solid, 42.72% yield, m. p.: 237–239 °C. 1H NMR (400 MHz, DMSO-d6) δ 12.47 (s, 1H), 8.53 (s, 1H), 8.03 (s, 1H), 7.24 (td, J = 7.4, 1.3 Hz, 2H), 7.07 (t, J = 5.8 Hz, 1H), 7.00 (d, J = 7.6 Hz, 1H), 6.92 (td, J = 7.4, 0.9 Hz, 1H), 6.56 (s, 1H), 4.25 (d, J = 5.8 Hz, 2H), 3.90 (s, 3H), 3.83 (s, 3H), 2.51 (s, 3H). 13 C NMR (101 MHz, DMSO-d6) δ 203.57, 159.15, 157.25, 155.85, 155.58, 128.63, 128.51, 128.02, 122.33, 120.63, 120.14, 112.50, 110.92, 99.64, 56.76, 55.78, 38.51, 27.07. HRMS (ESI): m/z [M + Na]+ calcd for C18H20N2O5: 367.1264; found: 367.1261.
1–(5-acetyl-4-hydroxy-2-methoxyphenyl)-3-(furan-2-ylmethyl) urea (C7). White solid, 50.67% yield, m. p.: 231–232 °C. 1H NMR (400 MHz, DMSO-d6) δ 12.47 (s, 1H), 8.52 (s, 1H), 7.95 (s, 1H), 7.60 (d, J = 1.2 Hz, 1H), 7.15 (t, J = 5.6 Hz, 1H), 6.57 (s, 1H), 6.41 (dd, J = 3.1, 1.9 Hz, 1H), 6.27 (d, J = 3.1 Hz, 1H), 4.29 (d, J = 5.6 Hz, 2H), 3.90 (s, 3H), 2.52 (s, 3H). 13 C NMR (101 MHz, DMSO-d6) δ 203.55, 159.27, 155.60, 155.58, 153.45, 142.61, 122.10, 120.25, 112.51, 110.92, 107.01, 99.67, 56.78, 36.50, 27.08. HRMS (ESI): m/z [M + Na]+ calcd for C15H16N2O5: 327.0951; found: 327.0955.
1–(5-acetyl-4-hydroxy-2-methoxyphenyl)-3-phenethylurea (D1). White solid, 43.98% yield, m. p.: 164–165 °C. 1H NMR (400 MHz, DMSO-d6) δ 12.48 (s, 1H), 8.54 (s, 1H), 7.90 (s, 1H), 7.34–7.18 (m, 6H), 6.79 (t, J = 5.6 Hz, 1H), 6.54 (s, 1H), 3.89 (s, 3H), 3.35 (dd, J = 12.9, 6.9 Hz, 2H), 2.74 (t, J = 7.1 Hz, 2H), 2.52 (s, 3H). 13 C NMR (101 MHz, DMSO-d6) δ 203.57, 159.13, 155.84, 155.56, 140.05, 129.17 (2 C), 128.83 (2 C), 126.54, 122.34, 120.14, 112.51, 99.63, 56.75, 41.04, 36.37, 27.08. HRMS (ESI): m/z [M + Na]+ calcd for C18H20N2O4: 351.1315; found: 351.1318.
1–(5-acetyl-4-hydroxy-2-methoxyphenyl)-3–(4-fluorophenethyl) urea (D2). White solid, 44.41% yield, m. p.: 224–225 °C. 1H NMR (400 MHz, DMSO-d6) δ 12.46 (s, 1H), 8.53 (s, 1H), 7.87 (s, 1H), 7.30–7.25 (m, 2H), 7.17–7.10 (m, 2H), 6.76 (t, J = 5.6 Hz, 1H), 6.55 (s, 1H), 3.89 (s, 3H), 3.32 (dd, J = 12.9, 6.9 Hz, 2H), 2.73 (t, J = 7.1 Hz, 2H), 2.52 (s, 4H). 13 C NMR (101 MHz, DMSO-d6) δ 203.56, 161.31 (d, J = 241.5 Hz), 159.14, 155.82, 155.56, 136.17 (d, J = 3.1 Hz), 130.93 (d, J = 7.8 Hz, 2 C), 122.30, 120.14, 115.47 (d, J = 21.0 Hz, 2 C), 112.51, 99.63, 56.75, 41.04, 35.45, 27.07. HRMS (ESI): m/z [M + Na]+ calcd for C18H19FN2O4: 369.1221; found: 369.1225.
1–(5-acetyl-4-hydroxy-2-methoxyphenyl)-3–(4-methoxyphenethyl) urea (D3). White solid, 57.99% yield, m. p.: 180–181 °C. 1H NMR (400 MHz, DMSO-d6) δ 12.47 (s, 1H), 8.53 (s, 1H), 7.88 (s, 1H), 7.23–7.10 (m, 2H), 6.93–6.81 (m, 2H), 6.74 (t, J = 5.6 Hz, 1H), 6.55 (s, 1H), 3.89 (s, 3H), 3.72 (d, J = 3.7 Hz, 3H), 3.29 (dd, J = 12.9, 6.9 Hz, 2H), 2.67 (dd, J = 9.2, 5.0 Hz, 2H), 2.52 (d, J = 1.8 Hz, 3H). 13 C NMR (101 MHz, DMSO-d6) δ 203.56, 159.12, 158.13, 155.83, 155.55, 131.85, 130.10 (2 C), 122.36, 120.10, 114.23 (2 C), 112.51, 99.62, 56.74, 55.42, 41.27, 35.46, 27.07. HRMS (ESI): m/z [M + Na]+ calcd for C19H22N2O5: 381.1421; found: 384.1424.
1–(5-acetyl-4-hydroxy-2-methoxyphenyl)-3–(2-fluorophenethyl)urea (D4). White solid, 27.50% yield, m. p.: 204–205 °C. 1H NMR (600 MHz, DMSO-d6) δ 12.45 (s, 1H), 8.51 (s, 1H), 7.83 (s, 1H), 7.34–7.25 (m, 2H), 7.18–7.13 (m, 2H), 6.80 (t, J = 5.7 Hz, 1H), 6.54 (s, 1H), 3.89 (s, 3H), 3.36–3.33 (m, 2H), 2.78 (t, J = 7.1 Hz, 2H), 2.51 (s, 3H). 13 C NMR (151 MHz, DMSO-d6) δ 203.46, 161.99, 160.38, 159.17, 155.72 (d, J = 29.4 Hz), 131.62 (d, J = 5.0 Hz), 128.64 (d, J = 8.1 Hz), 126.56 (d, J = 15.9 Hz), 124.79 (d, J = 3.4 Hz), 122.24, 120.32, 115.54 (d, J = 22.0 Hz), 112.54, 99.61, 56.71, 29.68, 27.00, 18.97. HRMS (ESI): m/z [M + Na]+ calcd for C19H22N2O5: 369.1221; found: 369.1221.
2.3. Biological assays
2.3.1. Cell culture
Mouse peritoneal macrophages obtained from BeNa Culture Collection Company (Beijing, China). The human skin keratinocyte HaCaT cell line obtained from American Type Culture Collection (ATCC, Manassas, VA). HaCaT cells and RAW264.7 cells were cultured in DMEM (Hyclone, Logan, UT) supplemented with 10% foetal bovine serum (Biological Industries, Israel). These cells were cultured in a 37 °C, 5% CO2 incubator. The cells grew until they converged to 70 − 80% before treatment.
2.3.2. Determination of NO
RAW264.7 cells (7 × 10⁴ cells/well) were seeded into 48-well plate and used for experiments after 24 h. RAW264.7 cells were pre-treated with compounds (10 µM) for 1 h, co-treated with LPS (0.5 mg/mL) for 24 h. After 24 h collect cell supernatant, NO production was measured using Griess Reagent assay (Beyotime). Griess reagent were mixed at a ratio of 1:1, and reacted at room temperature for 15 min. Measurement of absorbance at 450 nm with enzyme reader. At least three independent experiments were performed for the determination of IC50 values, which were shown as mean ± SD. All experimental data were analysed by using GraphPad Prism software, version 8.0 (GraphPad Inc.).
2.3.3. Cell viability assay (MTT)
RAW264.7 cells (1 × 10⁴ cells/well) were seeded into 96-well plate and used for experiments after 24 h. Compounds (4 µM, 20 µM and 100 µM) treated cell for 24 h. Forty microliters of MTT solution (5 mg/mL, Sigma-Aldrich) was then added and incubated for an additional 4 h. After 4 h, cell culture supernatants were removed and DMSO (150 µL) was added into per well for dissolving the resulting crystals. Shaking about 1 0 ∼ 15 min and the absorbance at 492 nm was measured by a microplate reader (MQX200, Bio-Tek, Winooski, VT). At least three independent experiments were performed for the determination of IC50 values, which were shown as mean ± SD. All experimental data were analysed by using GraphPad Prism software, version 8.0 (GraphPad Inc.).
2.3.4. Hyperproliferation assay
HaCaT cells were seeded in 96-well plates and cultured at 37 °C in a humidified 5% CO2 atmosphere. When the cell confluency reached 60–70%, HaCaT cells were then starved in serum-free DMEM for 12 h before stimulated by 100 ng/mL LPS for 24 h to mimic hyperproliferative psoriatic keratinocytes. The cell viability was measured by MTT method. Results are expressed as the percentage survival of cells in the cell treated group and the untreated control group (without the tested compound and LPS).
2.3.5. Western blotting
RAW264.7 cells were seeded into 6-well plate with 2 × 10⁶ cells per well and maintained about 24 h, and then pre-treated with compound B12 (2.5, 5, 10 µM) for 1 h, co-treated with LPS (0.5 µg/mL) for 0.5 h or 24 h. Western blotting assay was performed as the method described previouslyCitation24. Briefly, the cells were lysed in 300 ml RIPA cell lysis buffer (Contains PMSF and phosphatase inhibitors, Beyotime China) and incubated on ice for 30 min. Collecting supernatant by centrifugation. The same amount of protein was separated by SDS-PAGE and transferred to PVDF membrane (GE Healthcare, Amersham, UK). The blotted membrane incubated with the primary antibodies and allowed to react for an additional 16 h at 4 °C. All antibodies obtain from Cell Signalling Technology, Boston, MA. The membranes incubated with a 1:5000 dilutions of HRP-conjugated secondary antibody (Beyotime Biotech, Nantong, China) for 1 h at room temperature. Signals were visualised using ECL system (Thermo Fisher Scientific, Waltham, MA).
HaCaT cells were seeded into 6-well plate with 2 × 10⁶ cells per well. After 24 h culture and 12 h starvation, they were stimulated with SUV irradiation. The cells were irritated with 40 KJ/m2 doses of SUV at 30 min. In order to study the effect of compound B12, the cells were starved in serum-free medium for 12 h, and then pre-treated with compound B12 (2.5, 5, 10 μM) for 6 h before SUV irradiation. Follow the same steps as above to transfer the electrophoretic band to PVDF membrane. All steps were performed in the same way as above except that the types of primary and secondary antibodies were different.
2.3.6. Animal study
Inbred 6–8-week-old female BALB/c mice were obtained from Animal Department of Anhui Medical University (China). All mice were allowed to acclimatise in the specific pathogen free (SPF) conditions for 1 week before any experiments were started. Mice were raised in a 12 h light/dark cycle with humidity (55 ± 5%) and temperature (22 ± 1 °C). All animal protocols were approved by the Ethics Committee in Animal Experimentation at Anhui Medical University (Hefei, China) following the guidelines for Care and Use of Laboratory Animals. To induce the experimental psoriatic skin inflammation, mice were randomly divided into 5 groups (n = 6): Normal, Vehicle (Imiquimod (IMQ), Sichuan Mingxin Pharmaceutical, Sichuan, China applied only), Dexamethasone treatment (IMQ with 20 mg/kg Dex), Compound B12 L (IMQ with 20 mg/kg Compound B12), and Compound B12 H (IMQ with 40 mg/kg Compound B12). The psoriatic skin inflammation was established by topically applying 62.5 mg of IMQ cream on the shaved 2 cm × 3 cm back skins. All rats were given intragastric administration once a day. During treatment for 7 days, to score the severity of inflammation of mouse skin, an objective scoring system was developed based on the clinical psoriasis area and severity index. Erythema, scaling, and thickening were scored independently from 0 to 4 as follows: 0, none; 1, slight; 2, moderate; 3, marked; 4, very marked and weight loss. The cumulative score (erythema plus scaling plus thickening) served to indicate the severity of inflammation (scale 0 ∼ 12). On the 8th day, the mice were taken eyeball blood and back skin. One-half of the samples were immediately fixed in 4% paraformaldehyde and for haematoxylin and eosin (H&E) staining. The other samples were put in a −80 °C freezer. Before used, they were placed at room temperature for 30 min. After that, they were added 1 × PBS proportionally, homogenised and centrifuged. The supernatant was collected and used for ELISA assay and Western blot assay. All animal studies were conducted according to the guidelines approved by the Laboratory Animal Centre of Anhui University. The histological image was obtained using 3DHISTECH’s Slide Converter (3DHISTECH, Hungary).
2.3.7. Human liver microsomes stability assay in vitro
The livers were homogenised initially in a Tris (0.1 M)/KCl (0.1 M)/EDTA (1 mM)/butylated sodium hydroxytoluene (BHT) (0.02 mM) buffer. Add 1.5 µL control/test compound B12 working solution to 238.5 µL liver microsome working solution, gently mix. Pre-incubate at 37 °C for 5 min. Start the reaction by adding 60 µL NADPH working solution. Mix by pipetting up and down. At each time point: 0, 5, 15, 30 and 60 min, remove 30 µL of reaction mixture to 300 µL of quenching solution. Vortex vigorously for ∼1 min and centrifuge at 4000 rpm at 4 °C for 15 min. Remove 100 µL of the supernatant and mixed with 100 µL distilled water for LC-MS/MS analysis.
2.3.8. Statistical analysis
Data were expressed as the mean ± SEM. Statistical significance was assessed by one-way ANOVA and Turkish test, and differences between the two groups were examined by SPSS (version 14.0; SPNN Inc., Chicago, IL). p < 0.05 was considered to be statistically significant. All experiments dates were repeated at least three times.
3 Results and discussion
3.1. Chemistry
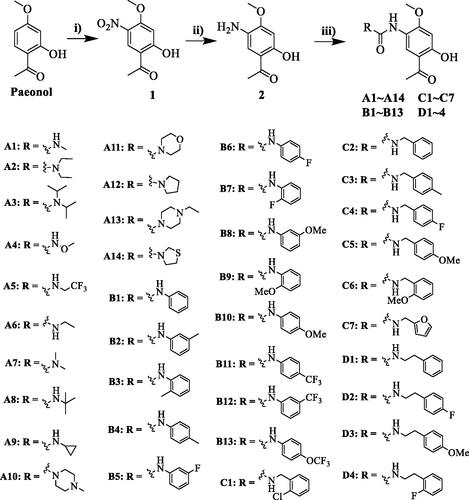
Compounds A1−A14, B1−B13, C1−C7 and D1−D4 were synthesised from paeonol as described in Scheme 1. First, nitration was achieved by treatment of paeonol with nitric acid in acetic acid, giving the nitro paeonol 1 at a 57% yieldCitation25. Subsequently, a selective reduction of 1 was performed by hydrogenation under 1 bar of hydrogen pressure using Pd/C to provide amino 2 at a 95% yield. Then 5-Amino-paeonol 2 was reacted with triphosgene in DCM to give crude 5-isocyanato-paeonol, directly reacted with various amines to give the desired compounds A1 − 14, B1 − 13, C1 − 7, and D1 − 4. Following the procedure, compounds A1−A14 substituted with alkyl amines were obtained in moderate yields; compounds B1−B13 substituted with aniline derivatives were produced in yields of 15 − 55%. The detailed synthesis procedures are described in the experimental section. The chemical structures of the compounds were confirmed by 1H NMR, 13 C NMR and HRMS.
Scheme 1. Synthesis of compounds A1−A14, B1−B13, C1−C7 and D1−D4. Reagents and conditions: (i) HNO3, CH3COOH, rt to 0 °C, 3h; (ii) H2, Pd/C, methanol, rt, overnight; (iii) amines, triphosgene, N, N-diisopropylethylamine, DCM, rt, 3 h.
3.2. Inhibiting of NO release
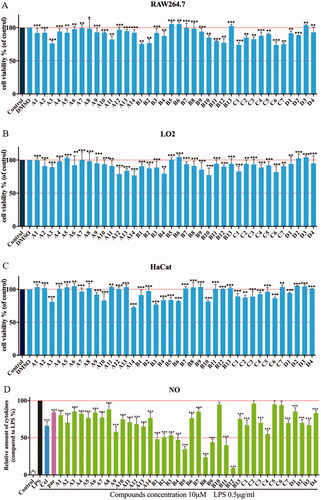
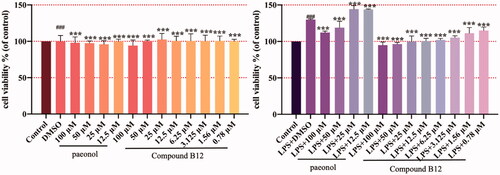
Before determining the anti-inflammatory activity of the title compounds, cytotoxic activities were evaluated by an MTT assay. As shown in C), none of compounds showed significant intrinsic cytotoxicity against RAW264.7, LO2 or HaCat cells at 100 µM. Excessive NO production plays an important role in many inflammatory diseases. Subsequently, the anti-inflammatory activity of compounds was determined in LPS-stimulated RAW264.7 cells according to NO releaseCitation24,Citation26,Citation27. As shown in , most of compounds reduced LPS-induced NO secretion at 10 µM. And some compounds exhibited stronger inhibitory activity compared than celecoxib and paeonol. Compounds A1−A8 showed weak potencies as well as paeonol, while compounds A9−A14 showed a slight increase in potency. Based on this structural optimisation, it was found that alkyl or heterocyclic/cyclic amine-modified paeonol showed unsatisfactory results.
Figure 2. Cytotoxic evaluation of all compounds in RAW264.7 cells (A), LO2 (B) and HaCaT cells (C). Inhibition of NO production by in RAW264.7 cells (D). Cell viability of all compounds were determined by MTT at 100 μM for 24 h; RAW264.7 cells were pre-treated with compounds (10 μM) for 1 h, incubated with LPS (0.5 μg/mL) for 24 h, NO production was measured using Griess Reagent assay. Paeonol (10 μM) and celecoxib (10 μM) are positive compound. The results are expressed as mean ± SD of three experiments. The concentration of DMSO is 1 0−8 M. ***p < 0.001, **p < 0.01, *p < 0.05 vs LPS group.
To improve anti-inflammatory activity and clearly explore structure-activity relationships, phenylurea, benzylurea and phenethylurea were also introduced at the 5-positon of paeonol. Compounds B1, C2, and D1, substituted with aniline, benzylamine, and phenethylamine, respectively, were synthesised and dramatically different inhibitory activities were observed (IR = 51%, 7.86% and 15.26%, respectively). Aniline-substituted B1 proved to be a privileged scaffold. Subsequently, a range of N-phenyl groups was introduced. Ortho-substituted N-phenyl compounds B3, B7 and B9 showed weak to moderate inhibitory activity. Para-substituted N-phenyl compounds B4, B6 and B10 showed moderate inhibitory activity. However, compounds B5, B8 and B12, having substituents at the meta-position of N-phenyl, showed dramatically improved activities (IR = 62.98%, 74.67%, and 95.46%, respectively). Among them, compound B12 gave the best results, with an IC50 against the NO production was 2.14 μM, which may be due to lipid solubility and strong electron-withdrawing properties of the trifluoromethyl moietyCitation28. Therefore, compound B12 was selected as the lead compound for further evaluation ().
Table 1. Inhibitory effects of compounds A1−A14, B1−B13, C1−C7 and D1−D4 against NO production and cytotoxicity against RAW264.7 and LO2 cellsa
3.3. Admet prediction
The absorption, distribution, metabolism, excretion, and toxicity (ADMET) of all compounds were predicted using the Discovery Studio 2018 (DS 2018) softwareCitation29,Citation30. The results are depicted in the 2 D graphs of ADMET PSA 2 D and ADMET AlogP98. Compound B12 exhibited suitable solubility at 25 °C (solubility level of 2). All compounds were within the 95% and 99% confidence intervals of blood–brain barrier (BBB) penetration and had suitable HIA (absorption level of 0). Moreover, compound B12 was likely to bind to plasma proteins (PPB# prediction was true). The results showed that compound B12 was a non-cytochrome P450 2D6 inhibitor (CYP2D6# prediction was false). The drugability and safety of the compounds were initially evaluated using the ADMET predictions (Supplementary Information). Anti-inflammatory activity of compound B12 was studied in the following steps.
3.4. Suppression LPS-induced iNOS and COX-2 activation
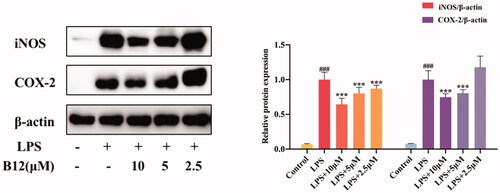
Compound B12 was selected as the title compound for the comprehensive consideration of potency, toxicity and drug-like properties. Notably, compound B12 showed the highest potency activity against NO production (IC50 = 2.14 µM) and lower cytotoxicity (IC50 > 100 µM) in RAW264.7 cells. Therefore, inhibition of compound B12 on the pro-inflammatory mediators iNOS and COX-2 was analysed by western blotting. As shown in , the expression of iNOS and COX-2 was inhibited by compound B12 in a dose-dependent manner. Thus, compound B12 could prevent LPS-induced expression of inflammatory mediators.
Figure 3. Inhibition of compound B12 on expression of pro-inflammatory mediators in LPS-stimulated RAW264.7 cells. RAW264.7 cells were pre-treated with compound B12 at 2.5, 5, 10 µM for 1 h, incubated with LPS (0.5 mg/mL) for 24 h. iNOS, COX-2 and β-actin were detected by Western blot. ###p < 0.001 compared with Control, ***p < 0.001 compared with LPS-stimulated cells; The blots are shown examples of three separate experiments.
3.5. Effect of compound B12 on LPS-induced HaCaT hyperproliferation
The changes in the cell function of keratinocytes are closely related to the occurrence and development of dermatitis. HaCaT cells are immortalised human keratinocytes with normal mutations, which is similar to primary human epidermal keratinocytes (KCs)Citation31. The LPS-induced keratinocyte line (HaCaT cell) hyperproliferation model was used to simulate the hyperproliferation of dermatitis keratinocyte epidermis in this study. Therefore, title compounds against HaCaT cells hyperproliferation were tested, with results showing that compound B12 inhibited excessive proliferation of LPS-induced HaCaT cells in a dose dependent manner, while paeonol did not have this effect ().
Figure 4. Compound B12 inhibit hyperproliferation in LPS-stimulated HaCaT cells. HaCaT cells were pre-treated with compound B12 at concentrations gradient for 6 h, incubated with LPS (100 g/mL) for 24 h. Cell viability were detected by MTT. ###p < 0.001 compared with Control, ***p < 0.001 compared with LPS-stimulated cells; The cell viability was shown examples of three separate experiments.
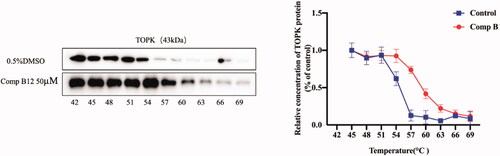
3.6. Interaction of compound B12 and TOPK through CETSA
Based on the ligand-induced thermal stabilisation of target proteins, the cellular thermal shift assay (CETSA) assay is likely to validate drug binding, off-target effects or drug resistance in cell lines. To further detect the direct binding of compound B12 with TOPK protein, CETSA was used in this studyCitation32. As shown in , TOPK could be stabilised in presence of compound B12, especially at 57 °C, and noticeable results could be observed, which indicating that compound B12 should be bound to TOPK to avoid its degradation.
Figure 5. CETSA detect thermal stability of TOPK in presence of compound B12.
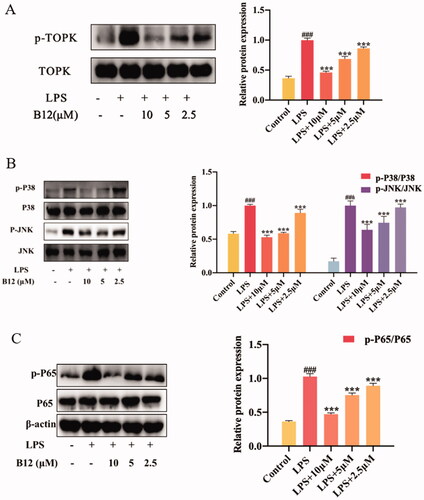
3.7. Compound B12 suppressed LPS-induced TOPK/NF-κB/p38/JNK activation
In RAW264.7 cell, TOPK is activated by LPS and activates the downstream protein pathways MAPK and NF-κCitation33,Citation34. Some of inflammatory cytokines, such as LPS, IL-6 and TNF-α can activate IκB kinase (IKK), allowing the liberated NF-κB to translocate into the nucleus and bind to target promoters to turn on transcriptions. These results indicated that compound B12 could affect TOPK phosphorylation (). Meanwhile, compound B12 inhibited P38/JNK protein phosphorylation and NF-κB p65 translocated into the nucleus (). Therefore, we believe that compound B12 may affect the phosphorylation of TOPK by targeting TOPK, and the conduction of the cell signal NF-κB/MAPK in vitro.
Figure 6. Compound B12 suppressed LPS-induced MAPK and NF-κB activation. (A) Compound B12 inhibited phosphorylation of TOPK. (B) Compound B12 inhibited phosphorylation of JNΚ and p38. (C) Compound B12 inhibited phosphorylation p65. Cells were treated with LPS (0.5 μg/mL) for 30 min. The results were showed as means ± SD (n = 3). ###p < 0.001 compared with LPS unstimulated cells; ***p < 0.001 compare with LPS-stimulated cells.
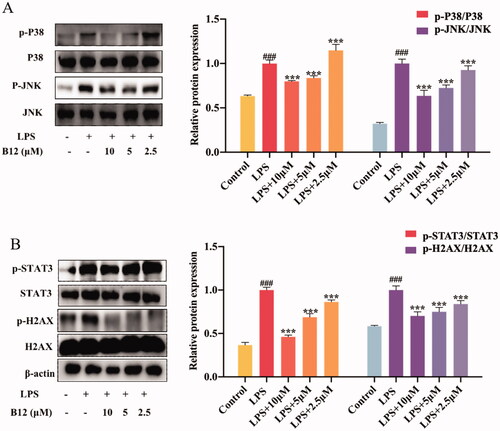
3.8. Down-regulated SUV-induced TOPK signalling pathway
Similarly, TOPK can be activated by the SUV. Histone H2AX is a substrate of TOPK and can be phosphorylated at Ser-139 (γ-H2AX) by TOPKCitation35. TOPK is also an upstream kinase of p38. And STAT3 is a downstream kinase of p38. The levels of phosphorylated γ-H2AX and STAT3 gradually decreased after pre-treatment with compound B12 from 2.5 μM to 10 μM for 6 h in HaCaT cells before 40 KJ/m2 SUV irradiation (). Results showed that compound B12 could inhibit SUV-induced DNA damage through the regulation of TOPK.
Figure 7. Compound B12 dose-dependently suppressed SUV-induced MAPK and downstream proteins activation. (A) Compound B12 inhibited phosphorylation of JNΚ and p38. (B) Compound B12 inhibited phosphorylation of STAT3 and H2AX. Cells were treated with SUV (40 kJ/m2) for 30 min. The results were showed as means ± SD (n = 3) of at least three independent experiments. ###p < 0.001 compared with LPS unstimulated cells; ***p < 0.001 compare with LPS-stimulated cells.
3.9. Anti-inflammatory activity of compound B12 in vivo
The anti-inflammatory activity of compound B12 was further evaluated in vivo. An IMQ-induced psoriasis mouse model was used to mimic the clinical manifestations of psoriasis patientsCitation36,Citation37. As shown in , severe skin lesions were occurred on the back skin, including scales, thickness and erythema during consecutive application of IMQ cream on BALB/c mice for 7 days in model the groups. Compound B12 significantly attenuated experimental symptoms and PASI score in a dose-dependent manner during treatment, as well as in the dexamethasone-treated group (). HE analysis of skin tissue was performed to assess the levels of inflammation and tissue changes. Representative histological images of the tissue sections are shown in . Mice induced by IMQ showed pathological psoriatic lesions, including loss of granular layer, epidermal hyperplasia, thickening of the acanthosis cell layer, parakeratosis, and inflammatory cell infiltration. IMQ-mice treated with compound B12 (20 mg/kg) showed moderate pathological reduction, while IMQ-mice treated with compound B12 (40 mg/kg) showed high pathological reduction as well as the positive drug dexamethasone.
Figure 8. (A) Illustration of mouse psoriasis model induced by IMQ; (B) PASI and effect of compound B12 on back skin of mice induced by IMQ (x ± s, n = 6); (C) Represent phenotypic pictures of back skins in each group; (D) H&E staining of skin tissues from mice in each group. Data were shown as mean ± SEM; n = 6 mice per group; *p < 0.05, **p < 0.01, and ***p < 0.001, compared with vehicle group.
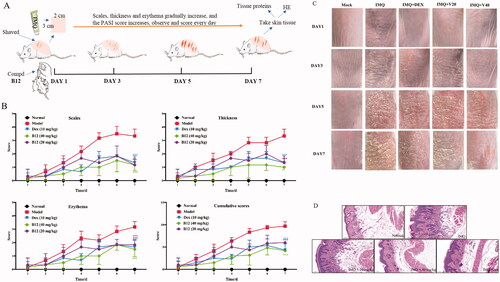
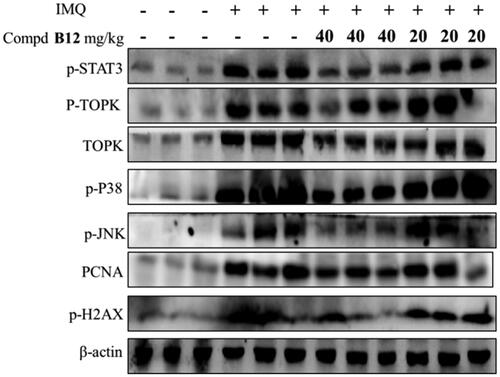
These results indicated that compound B12 successfully reduced the scales, thickness and erythema in psoriasis-like mice, histopathologically alleviated hyperkeratosis, acanthocyte proliferation and inflammatory cell infiltration. As shown in , the expression of related proteins in mouse skin tissues was decreased significantly after treatment with compound B12 in a dose-dependent manner. It is worth noting that compound B12 inhibits the expression of proliferation-related protein STAT3 and precancerous factor PCNA in skin tissues.
Figure 9. Compound B12 inhibited expression of p-STAT3, p-TOPK, TOPK, p-p38, p-JNKs, PCNA, p-H2AX in mouse skin tissues. The results were showed as means ± SD (n = 3) of at least three independent experiments.
Collectively, these results demonstrate that compound B12 could improve psoriasis-like skin inflammation in vivo.
3.10. Metabolic stability assay in liver microsomes
With the above information, the metabolic stability of compound B12 was further evaluated in human liver microsomes in vitro. As shown in , compound B12 showed acceptable stability against the metabolism of human liver microsomes with a half-life (t1/2) of 111.1 min. This result indicated that compound B12 might be selected as a promising candidate for the treatment of psoriasis-like skin inflammation.
Table 2. Metabolic stability in human liver microsomes.
4. Conclusions
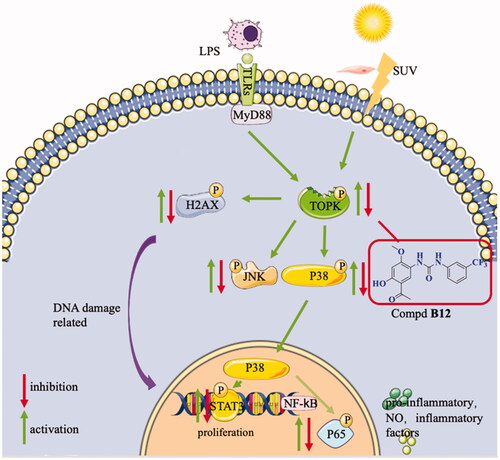
In summary, 38 new paeonol derivatives were synthesised and their anti-inflammatory activities were evaluated. Title compound B12 was found to be the most potent compound without obvious cytotoxicity. The preliminary mechanism indicated that compound B12 could interact with TOPK, to regulating its downstream pathways MAPK and NF-κB and inhibit the expression of DNA damage-related protein H2AX and proliferation-related protein STAT3 (). Anti-inflammatory studies revealed that this compound could effectively relieve histological changes in IMQ-induced murine psoriasis-like skin inflammation.
Figure 10. Proposed mechanisms of compound B12 for anti-inflammatory.
Supplemental Material
Download PDF (6.3 MB)Disclosure statement
The authors declare that they have no known competing financial interests or personal relationships that could have appeared to influence the work reported in this paper.
Additional information
Funding
References
- Jinlian L, Yingbin Z, Chunbo W. P38 mapk in regulating cellular responses to ultraviolet radiation. J Biomed Sci 2007;14:303–12.
- Han ZP, Li LZ, Huang YY, et al. Pbk/topk: a therapeutic target worthy of attention. Cells 2021;10:371.
- Matsuo Y, Park JH, Miyamoto T, et al. Topk inhibitor induces complete tumor regression in xenograft models of human cancer through inhibition of cytokinesis. Sci Transl Med 2014;6:259ra145.
- Park JH, Lin ML, Nishidate T, et al. Pdz-binding kinase/t-lak cell-originated protein kinase, a putative cancer/testis antigen with an oncogenic activity in breast cancer. Cancer Res 2006;66:9186–95.
- Zhu F, Zykova TA, Kang BS, et al. Bidirectional signals transduced by topk-erk interaction increase tumorigenesis of hct116 colorectal cancer cells. Gastroenterology 2007;133:219–31.
- Shih MC, Chen JY, Wu YC, Jan YH, et al. Topk/pbk promotes cell migration via modulation of the pi3k/pten/akt pathway and is associated with poor prognosis in lung cancer. Oncogene 2012;31:2389–400.
- Chen F, Li RW, Wang CJ, et al. T-lak cell-originated protein kinase is essential for the proliferation of hepatocellular carcinoma smmc-7721 cells. Cell Biochem Funct 2013;31:736–42.
- Fu XR, Zhao R, Yoon G, et al. 3-deoxysappanchalcone inhibits skin cancer proliferation by regulating t-lymphokine-activated killer cell-originated protein kinase in vitro and in vivo. Front Cell Dev Biol 2021;9:638174.
- Ikeda Y, Park JH, Miyamoto T, et al. T-lak cell-originated protein kinase (topk) as a prognostic factor and a potential therapeutic target in ovarian cancer. Clin Cancer Res 2016;22:6110–7.
- Ishikawa C, Senba M, Mori N. Mitotic kinase pbk/topk as a therapeutic target for adult T-cell leukemia/lymphoma. Int J Oncol 2018;53:801–14.
- Cuadrado A, Nebreda AR. Mechanisms and functions of p38 mapk signalling. Biochem J 2010;429:403–17.
- Guan PP, Wang XB, Jiang Y, et al. The anti-inflammatory effects of jiangrines from jiangella alba through inhibition of p38 and NF-κB signaling pathways. Bioorg Chem 2020;95:103507.
- Su XD, Jang HJ, Li HX, et al. Identification of potential inflammatory inhibitors from aster tataricus. Bioorg Chem 2019;92:103208.
- Li SQ, Zhu F, Zykova T, et al. T-lak cell-originated protein kinase (topk) phosphorylation of mkp1 protein prevents solar ultraviolet light-induced inflammation through inhibition of the p38 protein signaling pathway. J Biol Chem 2011;286:29601–9.
- Lau CH, Chan CM, Chan YW, et al. Pharmacological investigations of the anti-diabetic effect of cortex moutan and its active component paeonol. Phytomedicine 2007;14:778–84.
- Nizamutdinova IT, Oh HM, Min YN, et al. Paeonol suppresses intercellular adhesion molecule-1 expression in tumor necrosis factor-alpha-stimulated human umbilical vein endothelial cells by blocking p38, erk and nuclear factor-kappab signaling pathways. Int Immunopharmacol 2007;7:343–50.
- Xue P, Wang Y, Zeng F, et al. Paeonol suppresses solar ultraviolet-induced skin inflammation by targeting t-lak cell-originated protein kinase. Oncotarget 2017;8:27093–104.
- Sun GP, Wang H, Xu SP, et al. Anti-tumor effects of paeonol in a hepa-hepatoma bearing mouse model via induction of tumor cell apoptosis and stimulation of il-2 and tnf-alpha production. Eur J Pharmacol 2008;584:246–52.
- Jin X, Wang J, Xia ZM, et al. Anti-inflammatory and anti-oxidative activities of paeonol and its metabolites through blocking mapk/erk/p38 signaling pathway. Inflammation 2016;39:434–46.
- Tang K, Jiang Y, Zhang HW, et al. Design, synthesis of cinnamyl-paeonol derivatives with 1, 3-dioxypropyl as link arm and screening of tyrosinase inhibition activity in vitro. Bioorg Chem 2021;106:104512.
- Huang LG, Zhang BS, Yang Y, et al. Synthesis and anti-inflammatory activity of paeonol analogues in the murine model of complete freund's adjuvant induced arthritis. Bioorg Med Chem Lett 2016;26:5218–21.
- Hu YS, Han X, Yu PJ, et al. Novel paeonol derivatives: design, synthesis and anti-inflammatory activity in vitro and in vivo. Bioorg Chem 2020;98:103735.
- Ghosh AK, Brindisi M. Urea derivatives in modern drug discovery and medicinal chemistry. J Med Chem 2020;63:2751–88.
- Chen LZ, Sun WW, Bo L, et al. New arylpyrazoline-coumarins: synthesis and anti-inflammatory activity. Eur J Med Chem 2017;138:170–81.
- Yao RS, Li F, Deng SS, Zou GY. Synthesis of mononitrified and dinitrified derivatives of paeonol(in Chinese). J Hefei Univ Technol 2009;32:177–80.
- Nagy G, Clark JM, Buzas EI, et al. Nitric oxide, chronic inflammation and autoimmunity. Immunol Lett 2007;111:1–5.
- Philkhana SC, Verma AK, Jachak GR, et al. Identification of new anti-inflammatory agents based on nitrosporeusine natural products of marine origin. Eur J Med Chem 2017;135:89–109.
- Muller K, Faeh C, Diederich F. Fluorine in pharmaceuticals: looking beyond intuition. Science 2007;317:1881–6.
- Grover J, Kumar V, Singh V, et al. Synthesis, biological evaluation, molecular docking and theoretical evaluation of admet properties of nepodin and chrysophanol derivatives as potential cyclooxygenase (cox-1, cox-2) inhibitors. Eur J Med Chem 2014;80:47–56.
- Wu MF, Ma J, Ji LJ, et al. Design, synthesis, and biological evaluation of rutacecarpine derivatives as multitarget-directed ligands for the treatment of alzheimer's disease. Eur J Med Chem 2019;177:198–211.
- Finch PW, Murphy F, Cardinale I, Krueger JG. Altered expression of keratinocyte growth factor and its receptor in psoriasis. Am J Pathol 1997;151:1619–28.
- Molina DM, Jafari R, Ignatushchenko M, et al. Monitoring drug target engagement in cells and tissues using the cellular thermal shift assay. Science 2013;341:84–7.
- Seol MA, Park JH, Jeong JH, et al. Role of topk in lipopolysaccharide-induced breast cancer cell migration and invasion. Oncotarget 2017;8:40190–203.
- Park JH, Jeong YJ, Won HK, et al. Activation of topk by lipopolysaccharide promotes induction of inducible nitric oxide synthase through NF-κB activity in leukemia cells. Cell Signal 2014;26:849–56.
- Kuo LJ, Yang LX. Gamma-h2ax - a novel biomarker for DNA double-strand breaks. In Vivo 2008;22:305–9.
- Gilliet M, Conrad C, Geiges M, et al. Psoriasis triggered by toll-like receptor 7 agonist Imiquimod in the presence of dermal plasmacytoid dendritic cell precursors. Arch Dermatol 2004;140:1490–5.
- Flutter B, Nestle FO. Tlrs to cytokines: mechanistic insights from the Imiquimod mouse model of psoriasis. Eur J Immunol 2013;43:3138–46.