
Abstract
Despite extensive efforts over 40 years, few effective KRAS inhibitors have been developed to date, mainly due to the undruggable features of KRAS proteins. In addition to the direct approach to KRAS via covalent inhibition, modulation of the prenyl-binding protein PDEδ that binds with farnesylated KRAS has emerged as an alternative strategy to abrogate KRAS activity. For the verification of new therapeutic strategies, chemical probes with the dual functions of visualisation and pharmacological inhibition against oncogenic proteins are enormously valuable to understand cellular events related to cancer. Here, we report indolizino[3,2-c]quinoline (IQ)-based fluorescent probes (PD3 and PD3-B) for PDEδ inhibition. By using the unique fluorescent characteristics of the IQ scaffold, a fluorescence polarisation (FP)-based binding assay identified PD3 as the most effective PDEδ probe among the tested PD analogues, with a low Kd value of 0.491 µM and long retention time in the binding site of PDEδ. In particular, a FP-based competition assay using deltarasin verified that PD3 occupies the farnesylation binding site of PDEδ, excluding the possibility that the FP signals resulted from non-specific hydrophobic interactions between the ligand and protein in the assay. We also designed and synthesised PD3-B (5), an affinity-based probe (ABP) from the PD3 structure, which enabled us to pull down PDEδ from bacterial lysates containing a large number of intrinsic bacterial proteins. Finally, KRAS relocalization was verified in PANC-1 cells by treatment with PD3, suggesting its potential as an effective probe to target PDEδ.
1. Introduction
RAS is a well-known proto-oncogene and the most frequently mutated gene in various cancer types, such as pancreatic, colorectal, and lung cancerCitation1. The mutations usually occur in codons G12, G13 or Q61, and most of them are missense gain-of-function mutationsCitation2. RAS protein is a GTPase that cycles between an active state (GTP-bound form) and an inactive state (GDP-bound form). The most well-known downstream pathways are the MAPK (RAF/MEK/ERK) and PI3K (PI3K/AKT/mTOR) signalling cascades, and the increased flux through downstream signalling is a key property of oncogenic mutation of RASCitation3,Citation4. Despite extensive efforts over 40 years, there is only 1 FDA-approved RAS inhibitor, AMG-510 (sotorasib), which is mainly due to the undruggable feature of RAS proteins, including (1) high affinity for GDP and GTP and (2) lack of a well-defined hydrophobic pocketCitation5,Citation6. Recent advances provide directions for targeting RAS with direct approaches. The covalent inhibitor of KRAS G12C (AMG-510) was approved in May 2021 for the treatment of advanced or metastatic cancers and became the first approved drug directly targeting RAS. Additionally, another KRAS G12C inhibitor, MRTX-849, is in clinical trialsCitation7,Citation8. However, other KRAS mutants have not been directly targeted by covalent inhibitors and elicited several groups to find alternative routes by inhibiting the protein that binds to KRASCitation9. Furthermore, inhibitors of farnesyltransferase (FT) showed therapeutic potential in a preclinical study, but their low efficacy in clinical studies hampered their further development as anticancer drugsCitation10.
One alternative route to target KRAS is the inhibition of protein–protein interactions of KRAS with other proteins. Phosphodiesterase 6 delta subunit (PDEδ) is a prenyl-binding protein that is highly conserved in various speciesCitation11. PDEδ was first found to be a noncatalytic subunit of PDE. Later, it was reported to interact with various proteins, including retinis pigmentosa GTPase regulator (RPGR)Citation12, a large number of prenylated G proteins, such as Rac, Rap, Rhe, RAS and RhoCitation13,Citation14, and nonprenylated G proteins, such as Arl2 and Arl3Citation15,Citation16. PDEδ was identified as a trafficking chaperone of RAS subfamily proteins such as HRAS, NRAS, KRAS4a and KRAS4b and has been implicated in the regulation of the activity of prenylated RAS and other prenylated proteins by modulating their spatial localisation in cellsCitation13,Citation14,Citation17,Citation18.
The enrichment of RAS on the plasma membrane (PM) is essential for signalling activity. This PM localisation is dependent on posttranslational modification (PTM) at the C-terminal hypervariable region (HVR) of RAS, which is required for binding to the PMCitation19,Citation20. All RAS proteins undergo farnesylation and carboxymethylation at HVR. The guanine nucleotide dissociation inhibitor (GDI)-like pocket of PDEδ directly binds to farnesylated RAS and stabilises the modified proteins in the cytosol. This process is essential for the PM localisation of RAS and RAS-mediated signalling to affect abnormal oncogenic signalling. In addition, the increased activity of PDEδ promotes RAS signalling by localising RAS at the plasma membraneCitation19,Citation20.
Thus, an efficient way to abrogate KRAS signalling is to block the distribution of KRAS by disrupting the interaction between farnesylated KRAS and PDEδ in the PDEδ binding site. Several small molecule inhibitors targeting PDEδ have been reportedCitation21–28. Deltarasin, the first reported PDEδ inhibitor, attenuated RAS oncogenic signalling by occupying the prenyl binding pocket of PDEδ and inhibited the proliferation of human pancreatic carcinoma cells both in vitro and in vivoCitation21. In addition, the elevated expression of PDEδ has been reported in several human cancer cell lines, including breast, colon, and hepatocellular cancer cell linesCitation29–31, and the level of PDEδ is strongly correlated with the expression of RAS as well as RAS activity in colorectal cell linesCitation30. Taken together, these observations indicate that it is tremendously important to study the expression level, precise function, and cellular localisation of PDEδ by using chemical probes to verify the novel therapeutic strategy for KRAS.
Here, we report indolizino[3,2-c]quinoline (IQ)-based fluorescent probes (PDs) as a novel scaffold for PDEδ inhibition with low Kd values and long half-lives. By using the unique fluorescent characteristics of PDs, we confirmed the target specificity against PDEδ in bacterial lysate. We also investigated KRAS relocalization in PANC-1 cells by treatment with the PD3. Finally, PD3-B, a biotin-conjugated analog of PD3, was synthesised, which verified target engagement of PD3 by pull down experiments.
2. Results and discussion
2.1. In silico docking study
Our research group has developed a new chemical scaffold, indolizino[3,2-c] quinoline (IQ) derivatives, to explore their functions and biological applicationsCitation32–36. During our initial in silico studies to identify the target proteins of IQs, we found that some IQ derivatives, named as PDs, could act as PDEδ probes due to their structural similarity to deltarasin (). To verify the possibility of PDs as probes of PDEδ, a molecular docking study was conducted on the prenyl binding site of PDEδ. The representative compound PD3, which has a basic chemical structure of an IQ scaffold, was docked to the crystal structure of PDEδ complexed with deltarasin (PDB: 4JV8). Then, the docked pose of PD3 was overlaid with both the farnesyl group (PDB: 3T5G) and deltarasin (PDB: 4JV8) in the prenyl binding pocket of PDEδ (). PD3 (white colour) was well overlaid with the deltarasin (green colour) as well as the farnesyl group (magenta colour) in the prenyl binding pocket of PDEδ. Interestingly, the hydrophobic part of the PD3 was well matched with the hydrophobic region (shown in brown) of PDEδ (), and the hydrophilic part of PD3 was also well matched with the hydrophilic region (shown in blue) of the PDEδ binding site. Binding of PD3 is mediated by hydrophobic interactions with Met20, Ala47, Leu63, Val145, Leu147, Leu109 and Val59 and stabilised by hydrogen bonding between nitrogen on ring A and Arg61. These results indicated the possible use of PD derivatives as PDEδ probes.
Figure 1. Design strategy of PDEδ probes by molecular docking study. (A) The chemical structures of Deltarasin and indolizino[3,2-c]quinoline (IQ) scaffold; (B) Superimposition of farnesyl (magenta), Deltarasin (green) and PD3 (white) in the prenyl binding site of PDEδ. Farnesyl: obtained from a cocrystal complex with PDEδ (PDB: 3T5G), deltarasin: obtained from a cocrystal complex with PDEδ (PDB: 4JV8), PD3: obtained from a docking result in this study; (C) Predicted binding mode of PD3 in the prenyl binding site of PDEδ. The surface of the PDEδ binding site was generated by hydrophobicity. Colour spectrum: the hydrophobic regions in brown and the hydrophilic ones in blue.
![Figure 1. Design strategy of PDEδ probes by molecular docking study. (A) The chemical structures of Deltarasin and indolizino[3,2-c]quinoline (IQ) scaffold; (B) Superimposition of farnesyl (magenta), Deltarasin (green) and PD3 (white) in the prenyl binding site of PDEδ. Farnesyl: obtained from a cocrystal complex with PDEδ (PDB: 3T5G), deltarasin: obtained from a cocrystal complex with PDEδ (PDB: 4JV8), PD3: obtained from a docking result in this study; (C) Predicted binding mode of PD3 in the prenyl binding site of PDEδ. The surface of the PDEδ binding site was generated by hydrophobicity. Colour spectrum: the hydrophobic regions in brown and the hydrophilic ones in blue.](/cms/asset/6d60ec83-18e0-4f72-acab-6a997f12a584/ienz_a_2086865_f0001_c.jpg)
2.2. Biochemical characterisations
2.2.1. Fluorescence measurement
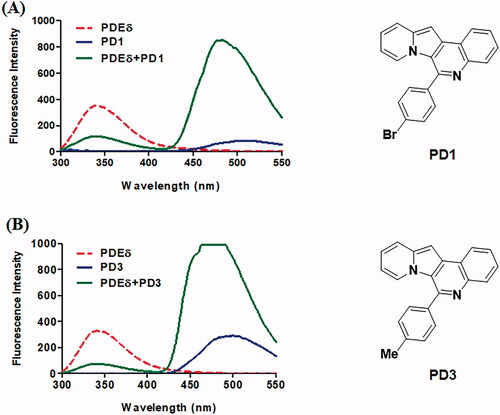
With the structural rationale for the binding to PDEδ from the molecular docking studies, we measured the fluorescence responses of the PDs after incubation with recombinant PDEδ proteins to confirm the binding of PDs to PDEδ. We envisioned that the hydrophobic environment of the prenyl binding pocket of PDEδ, as depicted in , could enhance the fluorescent signal due to the solvatochromic characteristics of IQ scaffoldCitation32. In addition, tryptophan residues near the binding site of PDEδ and the fluorophore of PDs could act as a fluorescence resonance energy transfer (FRET) pair. Hence, the fluorescence emission of PDs with or without PDEδ was measured upon excitation at 280 nm. All recoded spectra of PDs are depicted in Supplemental Figure S1. To compare the binding abilities of PD derivatives to the target protein, same concentration (2 µM) of PD compound was treated and then fluorescence intensity was measured in Spectrofluorometer FP-6500. Indeed, the fluorescence characteristics of PDs were significantly changed after incubation with PDEδ ( and Supplemental Figure S1). The emission maxima of PDEδ at approximately 340 nm (red dotted line) decreased significantly after incubation with PDEδ, and the emission maxima of PDs at approximately 500 nm (blue line) in Tris buffer were shifted to 475 nm along with a drastic enhancement in fluorescence intensity (green line) upon excitation at 280 nm. Especially, some compounds (PD3 and PD6) exceeded the maximum detection limit of Spectrofluorometer. These data suggested that a dramatic increase in the fluorescence intensity of PDs upon binding with PDEδ could be utilised to confirm the target specificity of PDs in bacterial lysates. Meanwhile, PD2 and PD10 were excluded from further study because of low fluorescence intensity (PD2) or lack of binding with PDEδ (PD10).
Figure 2. Representative emission spectra of PD1 (A) and PD3 (B). All emission spectra were taken in 20 mM Tris buffer (pH 7.5) at Ex 280 nm. Red dotted line: 2 μM PDE δ, blue line: 2 μM PD, green line: 2 μM PDE δ after incubation with 2 μM PD. Although the curve of PD3 (B) was saturated, it was necessary to compare the binding abilities of each PD compound in the same condition as the initial screen.
2.2.2. Determination of Kd
To evaluate the binding affinities of PDs to PDEδ, we also carried out a fluorescence polarisation (FP)-based binding assay after incubation of PDs with PDEδ. Twenty-five compounds were screened based on their affinities to PDEδ, and Kd values were obtained in the range of 0.2–3.0 µM (Supplemental Figure S2). shows a representative hyperbolar binding curve of the PDs titrated with PDEδ. Fluorescence polarisation was efficiently induced with the unique optical properties of PDs as fluorescence probes. The absorption and emission maxima of the measured PD compounds are summarised in . In the presence of 0.5 µM PD compounds, the polarisation value (mP value) increased following treatment with purified PDEδ in a dose-dependent manner until treatment with excess PDEδ induced saturation of binding. Among the tested compounds, 8 compounds were selected for further evaluation and SAR analysis. The binding curves for the selected 8 compounds are shown with their Kd values in Supplemental Figure S3.
Figure 3. Binding affinities of PDs measured by fluorescence polarisation. (A) Representative binding curve of PDs (PD3) titrated with PDEδ. The FP value was measured in PBS buffer (pH 7.2) containing 8 concentrations (0, 0.5, 1, 2, 4, 8, 16 and 32 μM) of PDEδ mixed with 0.5 μM PDs. Ex: 440 nm, Em: 526 nm; (B) Kd value and half-life of each compound; (C, D) Kinetic trace of PD3 and PD7 in the competition assay. PD3 was shown as a compound with the longest retention time (slow dissociation), whereas PD7 was shown as a compound with the shortest retention time (fast dissociation). The half-life was obtained by a competition binding assay using excess deltarasin. The optimal concentration of PDEδ for the competition assay was determined using the Kd value and PD concentration (0.5 μM) for making more than 68% of the binding complex. Ex: 430 nm, Em: 520 nm.
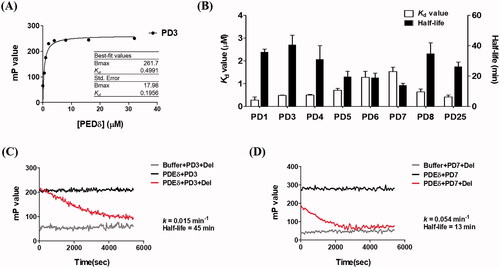
Table 1. Optical properties of PDs along with binding parameters to PDEδ. 
2.2.3. Measurement of the half-life using competition assay
To confirm that the PD compound occupies the same farnesylation binding site as deltarasin in PDEδ and to exclude the possibility that the FP signal resulted from non-specific hydrophobic interactions, we carried out a FP-based competition assay. PDs (0.5 µM) were incubated with the purified PDEδ protein for 2 h to ensure complete binding between the compound and the protein. Then, deltarasin was added to replace the PD compound in the prenyl binding pocket of PDEδ, which decreased the FP due to the free rotation of the released PD compound. As shown in , the reverse correlation between Kd values and half-lives was observed ( and ). In other words, compounds with tight binding exhibited longer retention times (half-lives) in the PDEδ protein when competing with deltarasin. The rate constants and half-lives were measured only when the increased concentration of deltarasin produced concentration-independent kinetic parameters, which reflects complete displacement of the binding site with the deltarasin. The kinetic trace was fit to a single exponential decay to generate the dissociation rate constant and half-life. Given that the Kd value is a ratio of koff/kon in a simple bimolecular binding model, the measured half-life and Kd are not always matched due to the contribution from the association rate constant. (PD3) and 3 D (PD7) show a representative kinetic trace obtained in the competition assay. PD3, with a Kd value of 0.491 µM, showed much slower dissociation from the PDEδ protein (k = 0.015 min−1; half-life = 45 min) than PD7, with a Kd value of 1.541 µM (k = 0.054 min−1; half-life = 13 min).
2.2.4. Structure-activity relationship analysis and docking studies of PDs
As shown in , bulky substituents at the R group showed decreased binding affinities with relatively high Kd values and short half-lives (PD6 and PD7). PD8 showed a higher affinity for PDEδ and a longer half-life than PD7 (0.643 vs. 1.541 µM for Kd; 35 vs. 14 min for half-life). As depicted in , the binding pocket of PDEδ has a deep and narrow hydrophobic cleft, in which bulky groups cannot fit. Only –Br, –CH3 groups attached to the 4-position of the phenyl ring or smaller thiophen ring can fit in the binding site. The steric clash in the binding pocket impeded tight binding in the case of the naphthyl group attached at the 1 position (PD7), whereas PD8 had a favourable interaction due to the different orientation of the naphthyl unit. The docking scores of PD7 and PD8 are well correlated with their binding affinities. PD8, which has higher binding affinity to PDEδ, has higher total scores along with lower clash compared to PD7 (Supplemental Table S1). Additionally, PD analogues showed high lipophilicities with AlogP values between 4 and 6 () and the calculated AlogP depends on the type of E ring of PDs. It is suggested that lipophilicity of PD compounds can be optimised by introducing various substituents at PD scaffold for further medicinal applications. Among the compounds, PD3 showed the longest half-life and PD1 showed the highest affinity for PDEδ. Between PD3 and PD1, we selected PD3 due to its higher emission intensity upon binding to the target and lower LogP value than those of PD1, suitable for investigating target specificity and engagement. Also, PD1 has a bromo phenyl ring at the E ring, which may cause phototoxicity during cell-based assays.
2.3. Target validation of PD3 using in-gel fluorescence
Next, we assessed the target specificity of PD3 using in-gel fluorescence. The fluorescence of PD3 was examined after incubation with the fractions of protein samples that were obtained during the purification process for PDEδ protein from the bacterial lysate (). Among those fractions, eluates E1, E2, and E3 and the soluble lysate fraction showed high concentrations of PDEδ (20 kDa), whereas the washing final (wf) fraction did not contain PDEδ in SDS–PAGE (). Strong cyan fluorescence was detected in eluates E1, E2, and E3 and the soluble lysate fraction after treatment with 0.5 mM PD3, whereas the fluorescence of the washing 1 (w1) and wf fractions was hardly detected ().
Figure 4. Evaluation of target specificity. (A) SDS–PAGE of fraction samples during the purification of PDEδ protein. Sol: Soluble, FT: Flow through, W1: Washing 1, WF: Washing final, M: Marker, E1–5: Elution 1-5, PDEδ: 20 kDa; (B) Fluorescence image of mixture of PD3 and fraction samples on 96-well plate (Ex. 312 nm). Lane 1: 0.5 mM PD3. Lane 2: 0.1 mM PD3. (C) Top: fluorescence image of a 12% Native gel. Fluorescence was measured by ImageQuantTM LAS 4000 with a 605DF40 EtBr filter (Ex. 312 nm). Lane 1: lysate with DMSO, Lane 2: lysate with 5 µM PD3, Lane 3: lysate with 50 µM PD3, M: marker, Lane 4: purified PDEδ with DMSO, Lane 5: purified PDEδ with 5 µM PD3, Lane 6: purified PDEδ with 50 µM PD3. Bottom: band intensity of fluorescence image. (D) Coomassie staining of the same 12% native gel.
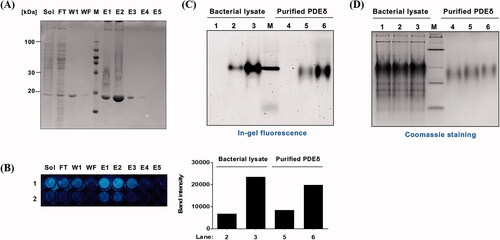
We also conducted native gel electrophoresis to further verify the specific binding of PD3 to native PDEδ using in-gel fluorescence scanning. Since the native gel does not use SDS, the tertiary structure of the protein would be retained during electrophoresis. We assumed that PD3 bound within the tertiary structure would be identified on the native gel. PD3 was incubated with bacterial lysate containing the overexpressed PDEδ protein (, lanes 1–3) or purified PDEδ (, lanes 4–6), and then these samples were run in a native gel to avoid denaturation of the protein. The in-gel fluorescence shown in (Ex: 312 nm, Em: 585–625 nm) was compared to the same gel stained with Coomassie that visualised the protein bands (), which confirmed the formation of the PD3-target protein complex. As expected, the fluorescence band was detected at the location of PDEδ and only detected in the lane with PD3 (lanes 2, 3, 5, and 6). The quantification data of the in-gel fluorescence showed increased fluorescence intensity in a concentration-dependent manner in both PDEδ-overexpressing bacterial lysate ( bottom, lanes 2 and 3) and purified PDEδ samples ( bottom, lanes 5 and 6). Taken together, our gel fluorescence data revealed that PD3 specifically binds to PDEδ in bacterial lysates that also contain a large number of other bacterial proteins.
2.4. Design and synthesis of PD3-B
To confirm whether PDs also specifically bind to PDEδ in the complex proteome of bacterial lysate, we designed PD3-B (5), an affinity-based probe (ABP) based on the PD3 structure, for selective profiling of the target protein of PD3. PD3-B contains a biotin module that would furnish the strong biotin-streptavidin interaction for the pull-down experiment.
The preparation of biotin-conjugated PD3-B (5) is described in Scheme S1. The starting compound PD3 (1) was synthesised as previously describedCitation32. First, iodine was introduced by NIS for the next coupling reaction. Then, the Pd-catalyzed Stille cross-coupling reaction between stannane and iodinated PD3 (2) was conducted under reflux conditions. Next, the TMS group of 3 was deprotected by potassium carbonate in MeOH. Finally, biotin-PEG3-azide was conjugated with 4 by a copper(I)-catalyzed azide-alkyne cycloaddition (CuAAC) reaction using CuSO4 and sodium ascorbate to yield PD3-B.
2.5. Pull-down experiment
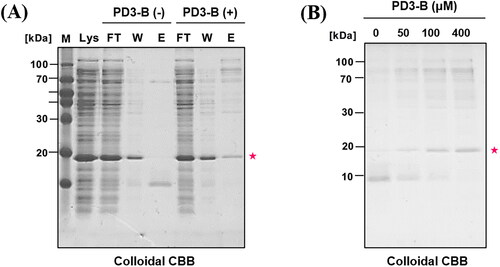
We subsequently investigated whether PD3-B (5) specifically identifies PDEδ in the complex proteome of bacterial lysate using an affinity pull-down experiment (. 100 µM PD3-B (5) was initially incubated with NeutrAvidin resin before incubation with bacterial lysate (150 µg) overexpressing PDEδ. For elution of the bound proteins, an elution buffer (2% SDS in PBS) was added to the resin and gently eluted at room temperature due to the noncovalent interaction between PD3-B (5) and the target protein PDEδ. The eluted samples were subjected to SDS–PAGE (18% polyacrylamide gel), and then the gels were stained with colloidal Coomassie brilliant blue solution to visualise the bound proteins. DMSO was used as a negative control. Surprisingly, PDEδ (20 kDa) was only detected in PD3-B (5) and not in the DMSO control lane after elution of the bound protein (, lane E). In addition, the intensity of the PDEδ band increased depending on the concentration of PD3-B (5) (). The data suggested that PD3 can bind to PDEδ with high selectivity for various proteins in the bacterial lysate.
Figure 5. Affinity pull-down assay of bacterial lysate (PDEδ overexpressed) with PD3-B. NeutrAvidin resin was incubated with PD3-B (100 μM) followed by bacterial lysate (150 μg) in PBS buffer. Then, bound proteins were eluted by adding elution buffer (2% SDS in PBS) at room temperature. The eluted samples were subjected to SDS–PAGE (18% polyacrylamide gel). The gels were stained with colloidal Coomassie brilliant blue solution. (A) Colloidal CBB staining of SDS–PAGE gel. Lys: bacterial lysate, FT: flow through in step 1. W: washing sample in step 1, E1: elution sample in step 2. PDEδ: 20 kDa; (B) Concentration-dependent pull down of bacterial lysate by PD3-B.
Notably, the target protein band (PDEδ) of PD3 was detected on the gel stained with colloidal Coomassie brilliant blue without the formation of a covalent bond. In general, an affinity-based probe (ABP) contains a functional group to generate a covalent bond with the target protein for tight binding. The binding affinity of PD3-B (5), a noncovalent ABP, was sufficiently tight to elicit the target protein in the pull-down experiments. These results are consistent with the observed high affinity (Kd = 0.491 µM) and long half-life (41 min) of PD3 to PDEδ in the fluorescence polarisation assays.
2.6. Localisation change of KRAS by PD3
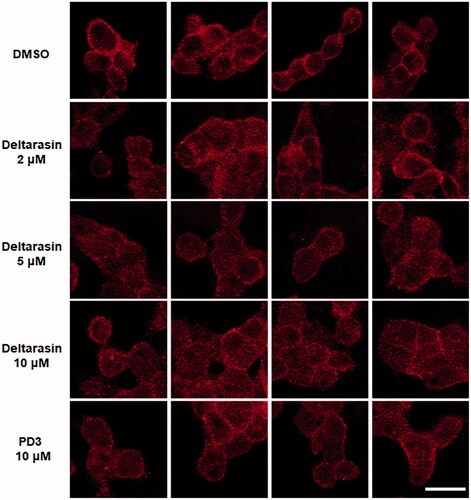
Finally, we investigated whether PD3 changes KRAS localisation by inhibiting the interaction of KRAS with PDEδ in human pancreatic cancer cells. PDEδ binds the farnesylated RAS proteins and stabilises themCitation19. Therefore, PDEδ activity leads to the accumulation of RAS at the plasma membrane (PM); conversely, downmodulation of PDEδ enhances RAS diffusion in the cytoplasm. To confirm the effect of PD3 on the relocalization of RAS, we carried out immunofluorescence staining of PANC-1 cells with an anti-RAS antibody (. As a positive control, treatment with deltarasin reduced the amount of RAS at the PM. Conversely, in the DMSO-treated control group, RAS was mainly localised in the PM of PANC-1 cells. In particular, the red fluorescence was effectively reduced at the PM by treatment with 10 µM PD3 in the same way as the positive control deltarasin. It is supposed that PD3 can induce changes in RAS localisation from the plasma membrane by interrupting the protein–protein interaction of KRAS-PDEδ.
Figure 6. Immunofluorescence of PANC-1 cells with an anti-Pan-RAS antibody (red). DMSO was used as a negative control, and deltarasin was used as a positive control. Ex: 633 nm, Em: ≥638 nm. The scale bar represents 20 µm.
3. Conclusion
In this work, we explored the PD series as novel chemical probes that target PDEδ to modulate KRAS activity. Our molecular docking studies suggested the possibility of PDs binding with PDEδ by demonstrating that the farnesyl group and deltarasin are well overlaid with PD in the prenyl binding site of PDEδ. Next, we checked the interaction of PDs with PDEδ by using the dramatic increase in PD fluorescence due to FRET. We also evaluated the binding affinity and kinetic parameters of PDs bound to PDEδ to quantify the interaction of the PD-PDEδ complex. When the Kd value was lowered, the half-life increased, and the SAR results were in accordance with the docking results.
Among the tested compounds, PD3 showed a high affinity for PDEδ (Kd = 0.491 µM) with the longest half-life (41 min.). In addition, PD3 specifically binds to PDEδ in the bacterial lysate during native gel electrophoresis. With sufficient binding affinity to PDEδ guaranteed, we designed PD3-B (5), an affinity-based probe from the PD3 structure, for selective profiling of target proteins of PD3. We confirmed that PD3-B (5) can bind highly selectively to PDEδ out of various proteins in bacterial lysates in a pull-down experiment. Finally, our fluorescent imaging data revealed that PD3 can induce changes in KRAS localisation from the plasma membrane by interrupting the protein–protein interaction of KRAS-PDEδ. Taken together, our results suggest that PD3 and PD3-B (5) are effective chemical probes for PDEδ with high binding affinity and high selectivity.
4. Experimental
4.1. Chemistry
4.1.1. General information for synthesis
Starting materials, reagents and solvents were purchased from Alfa Aesar (Ward Hill, MA), TCI chemicals (Tokyo, Japan) and Sigma–Aldrich (Saint Louis, MO). Both 1H and 13 C NMR spectra were recorded on a JEOL JNM spectrometer (400 MHz for 1H NMR and 100 MHz for 13 C NMR). Chemical shifts were expressed in ppm (δ) and were referenced to the residual solvent peak. Analytical thin-layer chromatography (TLC) was performed using precoated silica gel (E. Merck Kiesegel 60F254, layer thickness 0.25 mm), and chromatography was performed using silica gel 60 (40–60 µm). Mass spectra were recorded on a 6130 Single Quadrupole LC/MS (Agilent Technologies, Santa Clara, CA), and high-resolution mass spectra (HRMS) were collected under fast atom bombardment (FAB) conditions on a JMS-700 MStation (JEOL, Tokyo, Germany). HPLC analysis was performed on a YL9100 reversed-phase HPLC (Younglin, Gyeonggi-do, South Korea). The synthetic methods and optical properties of the IQ series were previously published by our research groupCitation32.
4.1.2. Procedure for synthesis of 5 (PD3-B)
4.1.2.1. 12-iodo-6-(p-tolyl)indolizino[3,2-c]quinoline (2)
A solution of the 6-(p-tolyl)indolizino[3,2-c]quinoline (130 mg, 0.42 mmol) in DCM (4 ml) was treated with N-iodosuccinimide (114 mg, 0.51 mmol). The mixture was stirred at room temperature for 2 h. The resulting residue was diluted with H2O and extracted with DCM followed by drying over Na2SO4. The solvent was removed and the residue was purified via column chromatography (SiO2, 10: 2: 1, hexane: DCM: EtOAc) to afford 12-iodo-6-(p-tolyl)indolizino[3,2-c]quinoline as a yellow solid (150 mg, 82%). 1H NMR (400 MHz, DMSO-d6) δ 9.56 (m, 1H), 8.12 (m, 1H), 7.85 (d, J = 7.2 Hz, 1H), 7.77 (m, 3H), 7.55 (d, J = 8.4 Hz, 2H), 7.46 (d, J = 8.4 Hz, 2H), 7.36 (m, 1H), 6.78 (m, 1H), 2.49 (s, 3H, overlapped with DMSO-d6 solvent peak); LCMS (ESI) m/z 435.0 [M + H]+.
4.1.2.2. 6-(p-tolyl)-12-((trimethylsilyl)ethynyl)indolizino[3,2-c]quinoline (3)
A mixture of 12-iodo-6-(p-tolyl)indolizino[3,2-c]quinoline (70 mg, 0.16 mmol), tributyl(trimethyl-silylethynyl)tin (75 mg, 0.19 mmol), Pd(PPh3)4 (19 mg, 0.016 mmol) and CuI (3 mg, 0.016 mmol) was dissolved in 3.2 mL of anhydrous THF followed by stirring for 2 h at 80 °C. The solvent was removed by evaporation followed by purification with flash chromatography (SiO2, 10: 2: 1, hexane: DCM: EtOAc) gave 6-(p-tolyl)-12-((trimethylsilyl)ethynyl)indolizino[3,2-c]quinoline (50 mg, 77%) as a yellow oil. 1H NMR (400 MHz, DMSO-d6) δ 9.23 (dd, J = 8.0, 1.6 Hz, 1H), 8.12 (dd, J = 8.0, 1.6 Hz, 1H), 7.93 (d, J = 7.2 Hz, 1H), 7.84 (d, J = 8.8 Hz, 1H), 7.78 (td, J = 7.2, 1.6 Hz, 1H), 7.71 (td, J = 8.0, 1.2 Hz, 1H), 7.57 (d, J = 7.6 Hz, 2H), 7.44 (m, 3H), 6.86 (td, J = 6.8, 1.6 Hz, 1H), 2.49 (s, 3H, overlapped with DMSO-d6 solvent peak), 0.39 (s, 9H); LCMS (ESI) m/z 367.0 [M + H]+.
4.1.2.3. 12-ethynyl-6-(p-tolyl)indolizino[3,2-c]quinoline (4)
To a solution of 6-(p-tolyl)-12-((trimethylsilyl)ethynyl)indolizino[3,2-c]quinoline (45 mg, 0.11 mmol) in 2 mL of MeOH was added K2CO3 (31 mg, 0.22 mmol), followed by stirring for 3 h at room temperature. The solvent was removed by evaporation and the resulting residue was diluted with H2O. The product was extracted with DCM, followed by drying over Na2SO4. The desired product was purified by column chromatography (SiO2, 10: 2: 1, hexane: DCM: EtOAc) to 12-ethynyl-6-(p-tolyl)indolizino[3,2-c]quinoline (20 mg, 54%) as a yellow solid. 1H NMR (400 MHz, DMSO-d6) δ 9.21 (dd, J = 8.0, 1.6 Hz, 1H), 8.11 (d, J = 8.0 Hz, 1H), 7.92 (d, J = 8.4 Hz, 1H), 7.88 (d, J = 8.4 Hz, 1H), 7.75 (m, 2H), 7.57 (d, J = 7.6 Hz, 2H), 7.47 (d, J = 7.6 Hz, 2H), 7.41 (m, 1H), 6.84 (m, 1H), 4.78 (s, 1H), 2.49 (s, 3H, overlapped with DMSO-d6 solvent peak); 13 C NMR (100 MHz, DMSO-d6) δ 148.84, 143.61, 141.71, 139.36, 136.68, 130.19 (2 C), 129.91, 129.72, 129.06 (2 C), 128.67, 127.34, 126.92, 126.40, 123.58, 122.62, 120.27, 118.34, 112.70, 87.41, 87.18, 78.28, 21.62; LCMS (ESI) m/z 333.10 [M + H]+; HRMS (FAB) m/z calcd for C24H17N2 333.1392 ([M + H]+), found 333.1398.
4.1.2.4. 5-((3aS,4R,6aR)-2-oxohexahydro-1H-thieno[3,4-d]imidazol-4-yl)-N-(2–(2–(2-(2-(4–(6-(p-tolyl) indolizino[3,2-c]quinolin-12-yl)-1H-1,2,3-triazol-1-yl)ethoxy)ethoxy)ethoxy)ethyl)pentanamide (5)
To a solution of 12-ethynyl-6-(p-tolyl)indolizino[3,2-c]quinoline (10 mg, 0.03 mmol) in 0.5 mL of t-BuOH and 0.5 ml of H2O was added CuSO4·5H2O (4 mg, 0.02 mmol), sodium ascorbate (6 mg, 0.03 mmol) and Azide-PEG3-biotin (13 mg, 0.03 mmol). The resulting mixture was stirred for 5 h at room temperature. The solvent was removed by evaporation and the residue was purified via column chromatography (SiO2, 10: 1, DCM: MeOH). The final mixture purified by preparative HPLC (H2O with 0.1% TFA/ACN with 0.1% TFA, 80/20 to 0/100 in 55 min, flow rate = 1.0 ml/min) afforded pure 5-((3aS,4R,6aR)-2-oxohexahydro-1H-thieno[3,4-d]imidazol-4-yl)-N-(2–(2–(2-(2-(4–(6-(p-tolyl) indolizino[3,2-c]quinolin-12-yl)-1H-1,2,3-triazol-1-yl)ethoxy)ethoxy)ethoxy)ethyl)pentanamide (3.6 mg, 15%) as a yellow solid. 1H NMR (400 MHz, MeOH-d4) δ 8.53 (s, 1H), 8.43 (dd, J = 8.4, 0.8 Hz, 1H), 8.10 (m, 2H), 7.88 (m, 2H), 7.82 (d, J = 8.4 Hz, 2H), 7.69 (m, 4H), 7.05 (td, J = 6.8, 1.6 Hz, 1H), 4.85 (m, 2H, overlapped with water peak), 4.43 (m, 1H), 4.22 (m, 1H), 4.07 (t, J = 4.8 Hz, 2H), 3.73 (m, 2H), 3.64 (m, 2H), 3.53 (m, 2H), 3.42 (m, 2H), 3.30 (m, 6H, overlapped with MeOH-d4 solvent peak), 3.11 (m, 3H), 2.85 (m, 1H), 2.63 (m, 1H), 2.60 (s, 3H), 2.04 (t, J = 7.2 Hz, 2H), 1.55 (m, 4H), 1.31 (m, 2H); 13 C NMR (100 MHz, MeOH-d4) δ 174.54, 164.69, 145.56, 144.24, 143.34, 138.02, 134.09, 131.70, 131.61, 130.91, 130.87 (2 C), 128.62 (2 C), 127.97, 127.52, 127.06, 126.44, 125.28, 120.89, 119.90, 119.63, 118.25, 114.71, 101.61, 70.22, 70.14, 70.06, 69.82, 69.11, 69.04, 61.97, 60.26, 55.60, 50.53, 39.68, 38.81, 35.23, 28.30, 28.08, 25.43, 20.39; LCMS (ESI) m/z 777.34 [M + H]+; HRMS (FAB) m/z calcd for C42H49N8O5S 776.3547([M + H]+), found 777.3559.
4.2. Computational study
Molecular modelling study was carried out with the Sybyl-X 2.1.1 (Tripos Inc, St Louis, MO). The X-ray structure of human PDEδ (PDB ID: 4JV8) complexed with rac-S1 was retrieved from the RCSB (Research Collaboratory for Structural Bioinformatics) Protein Data Bank and the protein structure was prepared for docking studies. All water molecules and crystallised ligands were removed and hydrogen atoms were added to the crystal structure. The energy minimisation of protein was conducted using gradient minimisation (Powell’s method) applied the Tripos force field when the RMSD reached 0.001 kcal/mol·Å. 2 D structure of the docking ligands were drawn by ChemBioDraw ultra 13.0 (CambridgeSoft Corporation, Cambridge, MA) and optimised using “Ligand Preparation” in Sybyl-X 2.1.1. Docking experiments were performed by Surflex-Dock GeomX mode. The protomol was generated with a threshold parameter of 0.5 Å and a bloat parameter of 0 Å. The docking result was validated by examination of the RMSD of the re-docked ligand (rac-S1/Deltarasin) compared to the co-crystallised ligand. Binding mode were further analysed using Discovery Studio 4.0 Visualiser (Dassault Systèmes, San Diego, CA).
4.3. Biochemical experiment
4.3.1. Cloning
The cDNA encoding human PDEδ was purchased from the Korea Human Gene Bank (Daejeon, South Korea). The corresponding DNA oligomers contained a NheI or BamHI restriction site were synthesised by Cosmogenetech Inc. (Seoul, South Korea). A forward (5′-GGTTGCTAGCATGTCAGCCAAGGACGAGCG-3′) and a reverse (5′-GGTTGGATCCTCAAACATAGAAAAGTCTCACTCTGGATGTGC-3′) primer were used for the PCR amplification. The resulting PCR fragments were digested with NheI (NEB, Ipswich, MA) or BamHI (NEB, Ipswich, MA) and ligated together with a pET28a(+) vector cut that contained the same restriction enzyme cleavage using T4 ligase (NEB, Ipswich, MA). The sequence of resulting clone was verified and transformed into the E. coli BL21(DE3) strain.
4.3.2. Protein expression and purification
The transformed BL21(DE3) cells were grown in a rotary shaker at 37 °C to a density of 0.8 (OD600), and the protein expression was induced with 0.2 mM of isopropyl β-D-thiogalactopyranoside (IPTG) at 18 °C for 16 h. The resulting cell pellet was resuspended in 25 mM tris(hydroxymethyl)aminomethane (Tris) buffer [pH 8.0, 500 mM NaCl, 10 mM imidazole, 10% Glycerol, 1:100 protease inhibitor cocktail (Roche, Penzberg, Upper Bavaria, Germany)] and cells were lysed by sonication. Cell debris were removed by centrifugation and PDEδ was purified from supernatants through Nickel-nitrilotriacetic (Ni+-NTA) acid affinity chromatography (Qiagen, Hilden, Düsseldorf, Germany). The protein was eluted in 25 mM Tris buffer (pH 8.0, 500 mM NaCl, 250 mM imidazole 10% glycerol). After elution, the proteins were subsequently dialysed into 25 mM Tris buffer (pH 7.5, 500 mM NaCl, 10% glycerol, 1 mm DTT) for 4 h and concentrated by centrifugation.
4.3.3. Fluorescence measurement
The fluorescence changes were measured to determine the interaction between PD compounds and PDEδ protein. The fluorescence spectra were obtained under Tris buffer [20 mM Tris-HCl (pH 7.5), 100 mM NaCl] at 20 °C. The concentration of PDEδ was 2 µM. After the addition of 2 µM PD compound, the mixture was gently inverted 3 times and then incubated for 1 min. The emission spectra were recorded on Spectrofluorometer FP-6500 (JASCO, Tokyo, Japan) at Ex 280 nm. The band width was 3 nm for excitation and 5 nm for emission.
4.3.4. Fluorescence polarisation assay
PDEδ was diluted to make a series of two-fold dilutions with a starting concentration of 32 µM. The diluted solution was mixed with PBS buffer [137 mM NaCl, 2.7 mM KCl, 10 mM Na2HPO4, 2 mM KH2PO4 (pH 7.2)] and then the mixture was loaded on a 96 well black plate (SPL life Science, Gyeonggi-do, Republic of Korea). Compounds were transferred to the wells of assay plate and the final concentration of compounds was fixed to 0.5 µM. After the addition of the compound, the assay plates were incubated for 2 h at 4 °C. FP values were detected by SpectraMax M5 microplate reader (Molecular Devices, San Jose, CA) at the maximum absorption and emission wavelengths of PD compounds in assay buffer. Kd values were determined by previously reported methodCitation37.
4.3.5. Competition binding assay
Deltarasin, a well-known PDEδ inhibitor, was purchased from Chemietek (Indianapolis, IN) for the competition assay. Assay buffer and the plate were the same as used in fluorescence polarisation assay. The optimal concentration of PDEδ was determined based on the Kd values and ligand concentration (0.5 µM) to ensure the formation of ligand-protein complex. The mixture of PDEδ and compounds were incubated for 2 h at 4 °C. After adding deltarasin to the mixture, FP was immediately recorded by SpectraMax M5 microplate reader (Molecular Devices, San Jose, CA) with excitation at 430 nm and emission at 520 nm. In SpectraMax M5 microplate reader, single excitation and emission wavelengths need to be used for testing all compounds. Therefore, Ex 430/Em 520 was used for competition binding assay. The selected ex/em wavelengths have only a difference of less than 10 nm from the maximum wavelengths, and there was no critical issue for conducting assay. The kinetic trace was fit to a single exponential decay to generate dissociation rate constant and half-life.
4.3.6. Target specificity
The binding specificity of the PD3 was measured using the protein fractions that can be obtained during purification of PDEδ. 0.5 mM PD3 was mixed with each fraction: soluble, flow through, washing, washing final and elution 1–5 fractions. The mixture was transferred to the 96 well clear bottom plate (SPL life Science, Gyeonggido, Republic of Korea). UV light (312 nm) was irradiated by transilluminator (Vilber, Lourmat, France) and then the image was detected by Cannon EOS 550 D camera. The mixture of PD3 and each fraction was separated by 21% SDS-PAGE separated, followed by in-gel fluorescence measurement using ImageQuantTM LAS 4000 (GE Healthcare Life Science, Illinois, CA) with a 605DF40 EtBr filter. The equipment has a limited number of filters for fluorescence measurement, so we selected the most suitable filter for the measurement.
4.3.7. Native gel analysis
PD3 (5 or 50 µM) was added to the bacterial lysate (390 µM) or purified PDEδ protein (22.9 µM) and the mixture was incubated for 2 h at 4 °C. The samples were loaded on each lane and separated by 12% native PAGE in a running buffer [25 mM Tris-HCl (pH 8.0), 500 mM NaCl, 10 mM imidazole, 10% Glycerol] with 1/4 pellet of protease inhibitor (Roche, Penzberg, Upper Bavaria, Germany). The gels were run at 70 V for 2.5 h, followed by in-gel fluorescence measurement. The same gel was stained by Coomassie brilliant blue to visualise protein bands.
4.3.8. Pull down experiment
NeutrAvidin UltraLink resin (100 µL, Thermo, Waltam, MA) was washed with PBS buffer (300 µL) 3 times before use. PD3-B (100 µM) in PBS buffer (500 µL) and NeutrAvidin UltraLink resin were incubated for 2 h at rt in Pierce Spin Columns (Thermo Fisher Scientific, Waltam, MA) with gentle shaking (40 rpm) and then washed with washing buffer (0.05% SDS in PBS buffer, 300 µL and 4 times). The beads were coated with BSA solution (500 µL) for 1 h at 4 °C with 40 rpm shaking, followed by washing with washing solution. The beads were incubated with bacterial lysate overexpressing PDEδ (150 µg) for overnight at 4 °C with 40 rpm shaking. After completed incubation, samples were centrifuged at 2000 rpm for 2 min, the flow through sample was removed, and the beads were washed with following conditions: 2 times with 0.1% SDS in PBS (300 µL), once with 2 M Urea in PBS (300 µL) and three times with PBS (300 µL). Bound proteins were eluted in an elution buffer (2% SDS in PBS) for 5 min. at room temperature followed by centrifugation (2000 rpm, 2 min). The samples were heated to 95 °C for 5 min in 1X standard SDS loading buffer and loaded on a 18% polyacrylamide gel and run at 150 V. The gels were stained by colloidal Coomassie brilliant blue solution for overnight at room temperature. DMSO was used for negative control for pull down experiment.
4.3.9. Immunofluorescence staining
PANC-1 cells were seeded with cover slip in a 6-well cell culture plate (SPL life Science, Gyeonggi-do, Republic of Korea) and incubated for 24 h under 37 °C and 5% CO2 prior to the experiment. Subsequently, the negative control DMSO, positive control deltrasin (2, 5, 10 µM) and test compound PD3 (10 µM) were processed for 18 h. Cells were washed 3 times with PBS [137 mM NaCl, 2.7 mM KCl, 10 mM Na2HPO4, 2 mM KH2PO4 (pH 7.2)] and fixed with 4% paraformaldehyde for 5 min. Then, cells were washed additional 3 times with PBS and permeabilized with PBS/0,1% Triton for 5 min. After an additional PBS washing step, cells were incubated in blocking buffer (5% BSA, 0.3% Triton X-100/PBS) for 1.5 h and washed 3 times with PBS before incubation with anti-pan RAS mouse monoclonal antibody (Calbiochem, San Diego, CA; OP40-100UG; 1:200) in blocking buffer. After 2 h incubation, cells were washed 3 times with PBS/0.1%Tween-20 and incubated with an Alexa-647 Donkey-anti-Mouse antibody (Invitrogen, Waltham, MA; 1:1000) as a secondary antibody. All steps were performed at room temperature. After final washing step with PBS/0.1%Tween-20, cells were stored in PBS for microscope. The fluorescence images were detected by confocal microscope (TCS-SP8 confocal laser scanning microscope, Leica, Germany). Fluorescence signal was obtained by excitation at 633 nm and emission at ≥638 nm.
Supplemental Material
Download PDF (601.6 KB)Acknowledgement
We acknowledge Seunggun Park for the contribution in the kinetic experiment.
Disclosure statement
No potential conflict of interest was reported by the author(s).
Appendix A. Supplementary Material
Additional information
Funding
References
- Cox AD, Fesik SW, Kimmelman AC, et al. Drugging the undruggable RAS: mission possible? Nat Rev Drug Discov 2014;13:1656–51.
- Hobbs GA, Der CJ, Rossman KL. RAS isoforms and mutations in cancer at a glance. J Cell Sci 2016;129:1287–92.
- Gibbs JB, Sigal IS, Poe M, Scolnick EM. Intrinsic GTPase activity distinguishes normal and oncogenic ras p21 molecules. Proc Natl Acad Sci U S A 1984;81:5704–8.
- Scheffzek K, Ahmadian MR, Kabsch W, et al. The Ras-RasGAP complex: structural basis for GTPase activation and its loss in oncogenic Ras mutants. Science 1997;277:333–8.
- Papke B, Der CJ. Drugging RAS: Know the enemy. Science 2017;355:1158–63.
- Lanman BA, Allen JR, Allen JG, et al. Discovery of a covalent inhibitor of KRASG12C (AMG 510) for the treatment of solid tumors. J Med Chem 2020;63:52–65.
- Fell JB, Fischer JP, Baer BR, et al. Identification of the clinical development candidate MRTX849, a covalent KRASG12C inhibitor for the treatment of cancer. J Med Chem 2020;63:6679–93.
- Molina-Arcas M, Samani A, Downward J. Drugging the undruggable: advances on RAS targeting in cancer. Genes (Basel) 2021;12:899.
- Ryan MB, Corcoran RB. Therapeutic strategies to target RAS-mutant cancers. Nat Rev Clin Oncol 2018;15:709–20.
- Berndt N, Hamilton AD, Sebti SM. Targeting protein prenylation for cancer therapy. Nat Rev Cancer 2011;11:775–91.
- Li N, Florio SK, Pettenati MJ, et al. Characterization of human and mouse rod cGMP phosphodiesterase delta subunit (PDE6D) and chromosomal localization of the human gene. Genomics 1998;49:76–82.
- Watzlich D, Vetter I, Gotthardt K, et al. The interplay between RPGR, PDEδ and Arl2/3 regulate the ciliary targeting of farnesylated cargo. Embo Rep 2013;14:465–72.
- Nancy V, Callebaut I, El Marjou A, de Gunzburg J. The delta subunit of retinal rod cGMP phosphodiesterase regulates the membrane association of Ras and Rap GTPases. J Biol Chem 2002;277:15076–84.
- Baehr W. Membrane protein transport in photoreceptors: the function of PDEδ: the proctor lecture. Invest Ophthalmol Vis Sci 2014;55:8653–66.
- Hanzal-Bayer M, Renault L, Roversi P, et al. The complex of Arl2-GTP and PDE delta: from structure to function. Embo J 2002;21:2095–106.
- Linari M, Hanzal-Bayer M, Becker J. The delta subunit of rod specific cyclic GMP phosphodiesterase, PDE delta, interacts with the Arf-like protein Arl3 in a GTP specific manner. Febs Lett 1999;458:55–9.
- Ismail SA, Chen YX, Rusinova A, et al. Arl2-GTP and Arl3-GTP regulate a GDI-like transport system for farnesylated cargo. Nat Chem Biol 2011;7:942–9.
- Weise K, Kapoor S, Werkmuller A, et al. Dissociation of the K-Ras4B/PDEδ complex upon contact with lipid membranes: membrane delivery instead of extraction. J Am Chem Soc 2012;134:11503–10.
- Chandra A, Grecco HE, Pisupati V, et al. The GDI-like solubilizing factor PDEδ sustains the spatial organization and signalling of Ras family proteins. Nat Cell Biol 2011;14:148–58.
- Schmick M, Vartak N, Papke B, et al. KRas localizes to the plasma membrane by spatial cycles of solubilization, trapping and vesicular transport. Cell 2014;157:459–71.
- Zimmermann G, Papke B, Ismail S, et al. Small molecule inhibition of the KRAS-PDEδ interaction impairs oncogenic KRAS signalling. Nature 2013;497:638–42.
- Zimmermann G, Schultz-Fademrecht C, Kuchler P, et al. Structure guided design and kinetic analysis of highly potent benzimidazole inhibitors targeting the PDEδ prenyl binding site. J Med Chem 2014;57:5435–48.
- Papke B, Murarka S, Vogel HA, et al. Identification of pyrazolopyridazinones as PDEδ inhibitors. Nat Commun 2016;7:11360.
- Jiang Y, Zhuang C, Chen L, et al. Structural biology-inspired discovery of novel KRAS-PDEδ inhibitors. J Med Chem 2017;60:9400–6.
- Martin-Gago P, Fansa EK, Klein CH, et al. A PDE6delta-KRas inhibitor chemotype with up to seven H-bonds and picomolar affinity that prevents efficient inhibitor release by Arl2. Angew Chem Int Ed Engl 2017;56:2423–8.
- Leung EL, Luo LX, Li Y, Liu ZQ, et al. Identification of a new inhibitor of KRAS-PDEδ interaction targeting KRAS mutant nonsmall cell lung cancer. Int J Cancer 2019;145:1334–45.
- Siddiqui FA, Alam C, Rosenqvist P, et al. PDE6D inhibitors with a new design principle selectively block K-Ras activity. ACS Omega 2020;5:832–42.
- Dong G, Chen L, Zhang J, et al. Discovery of turn-on fluorescent probes for detecting PDEδ protein in living cells and tumor slices. Anal Chem 2020;92:9516–22.
- Dong H, Claffey KP, Brocke S, Epstein PM. Expression of phosphodiesterase 6 (PDE6) in human breast cancer cells. Springerplus 2013;2:680.
- Klein CH, Truxius DC, Vogel HA, et al. PDEδ inhibition impedes the proliferation and survival of human colorectal cancer cell lines harboring oncogenic KRas. Int J Cancer 2019;144:767–76.
- Dietrich P, Hellerbrand C, Bosserhoff A. The delta subunit of rod-specific photoreceptor cGMP phosphodiesterase (PDE6D) contributes to hepatocellular carcinoma progression. Cancers (Basel) 2019;11:398.
- Park S, Kwon DI, Lee J, Kim I. When indolizine meets quinoline: diversity-oriented synthesis of new polyheterocycles and their optical properties. ACS Comb Sci 2015;17:459–69.
- Kwon S, Lee Y, Jung Y, et al. Mitochondria-targeting indolizino[3,2-c]quinolines as novel class of photosensitizers for photodynamic anticancer activity. Eur J Med Chem 2018;148:116–27.
- Lim B, Baek B, Jang K, et al. Novel turn-on fluorescent biosensors for selective detection of cellular Fe3+ in lysosomes: thiophene as a selectivity-tuning handle for Fe3+ sensors. Dyes Pigments 2019;169:51–9.
- Park J, Lim B, Lee NK, et al. Dual-functioning IQ-LVs as lysosomal viscosity probes with red-shifted emission and inhibitors of autophagic flux. Sens Actuat B Chem 2020;309:127764.
- Park J, Lee JH, Lim B, et al. Fine tuning of the HOMO–LUMO gap of 6-(thiophen-2-yl) indolizino[3,2-c]quinolines and their self-assembly to form fluorescent organic nanoparticles: rational design and theoretical calculations. ChemPhotoChem 2021;5:58–67.
- Lea WA, Simeonov A. Fluorescence polarization assays in small molecule screening. Expert Opin Drug Discov 2011;6:17–32.