
Abstract
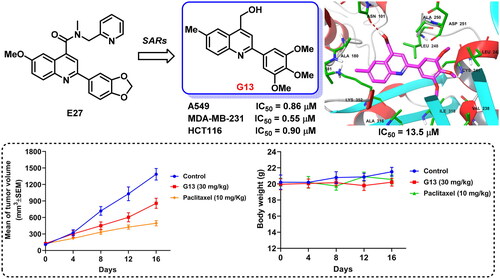
The colchicine binding site of tubulin is a promising target for discovering novel antitumour agents. Previously, we identified 2-aryl-4-amide-quinoline derivatives displayed moderate tubulin polymerisation inhibitory activity and broad-spectrum in vitro antitumour activity. In this study, structure based rational design and systematic structural optimisation were performed to obtain analogues C1∼J2 bearing diverse substituents and scaffolds. Among them, analogue G13 bearing a hydroxymethyl group displayed good tubulin polymerisation inhibitory activity (IC50 = 13.5 μM) and potent antiproliferative activity (IC50 values: 0.65 μM∼0.90 μM). G13 potently inhibited the migration and invasion of MDA-MB-231 cells, and displayed potent antiangiogenic activity. It efficiently increased intracellular ROS level and decreased MMP in cancer cells, and obviously induced the fragmentation and disassembly of the microtubules network. More importantly, G13 exhibited good in vivo antitumour efficacy in MDA-MB-231 xenograft model (TGI = 38.2%; i.p., 30 mg/kg).
GRAPHICAL ABSTRACT
Introduction
Microtubules play crucial roles in a wide range of cell events such as cell division, mitotic spindle formation, cell morphology and motility, and represent one of the most valuable antitumour targets for decadesCitation1,Citation2. Microtubules composed by α-tubulin and β-tubulin heterodimers are highly dynamic cytoskeletal fibres and a major component of the cytoskeleton, which function as highways in intracellular transport of organelles, vesicles, proteins, and signalling moleculesCitation3,Citation4. They show two types of non-equilibrium dynamics (i.e. dynamic instability and treadmilling), and both of them are crucial for cell division and mitosisCitation2. Due to the vital roles of microtubules in cell events, microtubule targeting agents (MTAs) that regulate microtubule dynamics display excellent anti-proliferative activity. Based on the effects on microtubule dynamics, MTAs can be classified into two categories as microtubule-stabilizing and -destabilizing agentsCitation1,Citation5. Microtubule-stabilizing agents (MTSAs) such as taxanes and epothilones bind to polymerised tubulin proteins and promote microtubule polymerisationCitation6, while microtubule-destabilizing agents (MTDAs) such as colchicine and vinca alkaloids inhibit microtubule polymerisationCitation6. Despite of the opposite effects on microtubule polymerisation, both MTSAs and MTDAs have been successfully developed as chemotherapeutic drugs and widely used in clinic for cancer therapy.
A large number of chemically diverse MTAs have been reported to bind to distinct binding sites on tubulin. The taxane, laulimalide/peloruside, colchicine, vinblastine, maytansine, gatorbulin-1, pironetin, and cevipabulin sites are the eight distinct tubulin-ligand binding sites that have been reported so far ()Citation7–13. Agents targeting taxane and laulimalide/peloruside binding sites on β-tubulin display microtubule-stabilizing effect, while agents targeting colchicine, vinblastine, maytansine, gatorbulin-1, and pironetin sites directly inhibit tubulin polymerisation. Cevipabulin binds to two spatially independent sites: vinblastine site and cevipabulin site (a novel site on α-tubulin)Citation11. Agents binding to the cevipabulin site promote microtubule polymerisation and tubulin degradationCitation11. Up to now, three of identified tubulin-ligand binding sites have been successfully targeted to develop cancer chemotherapeutic drugs. For instance, taxanes and vincristine antitumour drugs, binding to taxane and vinblastine sites, respectively, have achieved great success in clinic cancer treatment. The natural product maytansine (targeting maytansine site) is approved as the cytotoxic part of an antibody-drug conjugate (i.e. trastuzumab emtansine)Citation14. On the contrary, agents binding to the remaining tubulin-ligand sites have not been approved so far. In addition, the approved MTAs have been acquired serious drug resistance over the long-term treatmentCitation15. Overexpression of transporter proteins such as P-glycoprotein (P-gp), multidrug resistance-associated protein 1 (MRP1) and MRP2, specific tubulin isotypes (especially βIII isoform), and tubulin protein mutations are the main mechanisms that contribute to developing the drug resistance against MTAsCitation16–18. Therefore, there is an urgent need to develop novel tubulin targeted chemotherapeutic drugs that are efficient to suppress the resistant phenotypes.
Figure 1. (A) Eight distinct tubulin-ligand binding sites that have been reported so far. (B) Schematic representation of the colchicine binding site in tubulin (PDB code: 4O2B). (C) Representative colchicine binding site inhibitors.
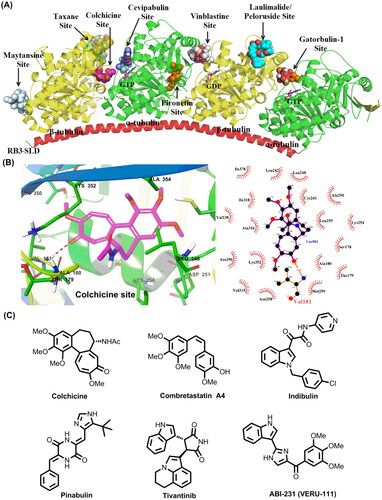
The colchicine binding site is located at the interface between α and β-tubulin heterodimers, and has been extensively studied for discovering novel tubulin targeted antitumour agents ()Citation19. Colchicine binding site inhibitors (CBSIs) are reported to display excellent anti-proliferative activity with IC50 values at nanomolar level, and valuable antitumour properties such as reducing cellular motility, impeding protein assembly, and exerting antiangiogenic effectCitation17. Moreover, extensive preclinical and clinical studies have strongly suggested CBSIs are effective in suppressing the multi-drug resistance mediated by the overexpression of βIII tubulin or transporter proteins such as P-gp, MRP1 and MRP2Citation16–18. Colchicine, an alkaloid isolated from the plant Colchicum autumnale, displays excellent submicromolar antiproliferative activities with wide-scope mechanisms of actionCitation20,Citation21. Unfortunately, it has a narrow therapeutic index and induces systemic toxicities and multi-organ dysfunction at high doses that hamper the therapeutic application in cancer treatmentCitation22,Citation23. In addition to colchicine and its derivatives, numerous structurally diverse CBSIs have been reported so far ()Citation1,Citation5,Citation16,Citation17,Citation24–30. Several inhibitors are actively undergoing clinical trials for the therapy of various solid tumours. For instance, ABI-231 (Sabizabulin, VERU-111) is a potent, orally bioavailable CBSI that is currently undergoing several clinical trials for the therapy of metastatic castration-resistant prostate cancer (Phase 3)Citation31 and metastatic breast cancer (Phase 2)Citation32. Based on the results of phase 1 b/2, oral 63 mg daily dosing of ABI-231 is well tolerated and associated with significant and durable objective tumour responses in patientsCitation33. Taken together, CBSIs display encouragingly in-vitro and -vivo antiproliferative activity with wide-scope molecular mechanisms, which are promising to surmount drug resistance faced by the available microtubule-targeting drugs.
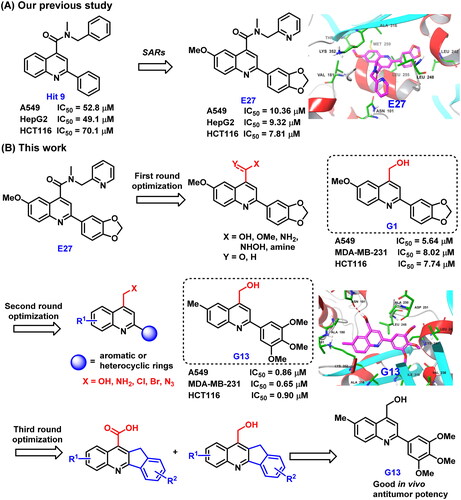
In our previous study, structure based virtual screening against colchicine binding site was performed to indentify 2-aryl-4-amide-quinoline hit 9 () displayed moderate tubulin polymerisation inhibitory activity (IC50 = 25.3 μM) and broad-spectrum in vitro antiproliferative activity (IC50 values: 49.1 μM∼70.1 μM)Citation34. After the preliminary structural optimisation, analogue E27 () was identified to display improved enzymatic inhibition activity (IC50 = 16.1 μM) and antitumour activity (IC50 values: 7.81 μM∼10.36 μM). Guided by the binding mode of E27 with tubulin, we envisioned that the 4-amide long side chain could be truncated and optimised to improve the molecular interactions to the binding site (). Therefore, structure based rational design and structural optimisation were performed in this study (). A series of novel analogues with diverse substituents and scaffolds were synthesised. Biological evaluation identified analogue G13 () bearing 4-hydroxymethyl and 2–(3′,4′,5′-3OMe-phenyl) groups displayed improved enzymatic inhibition activity (IC50 = 13.5 μM) and potent in vitro antitumour potency (IC50: 0.65 μM∼0.90 μM). More strikingly, G13 exhibited good in vivo antitumour potency in MDA-MB-231 xenograft model with low toxicity (TGI = 38.2%; i.p., 30 mg/kg). Altogether, this study provided a valuable lead compound for developing novel tubulin-targeted antitumour agents.
Figure 2. (A) Our previous study identified 2-aryl-4-amide-quinoline derivatives as the novel colchicine binding site inhibitors. (B) Rational drug design and structural optimisation were performed to identify analogue G13 displaying potent antitumour activity.
Results and discussion
Structure based rational design
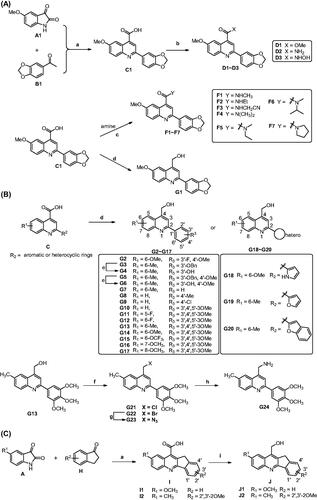
The predicted binding mode of E27 with tubulin revealed the hydrophobic amide side chain of E27 could be truncated and optimised to form a preferable interaction with tubulin (). Therefore, we firstly focussed on the optimisation of the hydrophobic amide side chain of E27 to prepare truncated methyl ester derivative D1, amide derivatives D2 and F1∼F7, hydroxamic acid derivative D3, and hydroxymethyl derivative G1 in first round optimisation (Scheme 1(A)). Structure activity relationship studies (SARs) revealed compound G1 bearing a hydroxymethyl group displayed the best tubulin inhibition activity and greatly improved in vitro antitumour activity. To account the essential role of the hydroxymethyl group, molecular docking was performed to visualise the binding mode of G1 with tubulin. The hydroxyl group of G1 formed a hydrogen bond with residue Asn101 that greatly improved the binding affinity of G1 with tubulin. Therefore, the hydroxymethyl group was retained in subsequent optimisation process. In second round optimisation, we investigated the effects of diverse R1 and R2 groups on antitumour activity. We varied the attached position and electronic properties of substituents to synthesise analogues G2∼G20 (Scheme 1(B)). Moreover, the hydroxyl group of G13 was transformed to obtain halogen derivatives G21 and G22, azide derivative G23 and amino derivative G24 (Scheme 1(B)). To explore the effect of rotatable substituents at C2 position of the quinoline scaffold on activity, analogues I1∼J2 containing a non-rotatable restrained rigid planar structure were synthesised in third round optimisation (Scheme 1(C)).
Scheme 1. Reagents and conditions: (a) 33% KOH, EtOH, 80 °C ∼ 100 °C, 24 h; HCl, H2O, rt, pH = 2. (b) For D1 and D2: SOCl2, DCM, reflux 6 h, then methanol or ammonia added; For D3: CDI, THF, NH2OH·HCl, rt. (c) Amine, EDC, DMAP, DCM, rt. (d) LiAlH4, THF, 0 °C. (e) For G21: SOCl2, DCM, 0 °C; For G22: NBS, PPh3, DCM, rt. (g) DMF, NaN3, rt. (h) THF/H2O, PPh3. (i) NaBH4/BF3·OEt2, THF, rt.
Chemical synthesis of analogues C1∼J2
The synthetic procedure was depicted in Scheme 1. Accordingly to our previous report, 5-methoxyisatin (A1) and 3′,4′-(methylenedioxy)acetophenone (B1) were dissolved in ethanol solvent and refluxed to obtain the intermediate C1Citation34. In DCM solvent, intermediate C1 was refluxed with SOCl2 to afford acid chloride derivative. Then the solvent and excess SOCl2 were evaporated under reduced pressure and the residue was reacted with methanol or ammonia in DCM at room temperature to afford methyl ester derivative D1 and primary amide derivative D2, respectively. In the presence of N,N'-carbonyldiimidazole (CDI), C1 was reacted with hydroxylamine hydrochloride to afford hydroxamic acid derivative D3. Using EDC/DMAP as the condensation reagents, C1 was reacted with various primary or secondary amine to afford amide derivatives F1∼F7. Moreover, the carboxyl group of C1 was reduced by LiAlH4 in THF at 0 °C to afford analogue G1 bearing a hydroxymethyl group. The synthetic route for analogues G2∼G20 was similar to that of G1 (Scheme 1(B)). In the presence of SOCl2 or PPh3/NBS, the hydroxyl group of G13 was transformed to chlorine (G21) and bromine (G22). Moreover, the bromine atom of G22 was reacted with NaN3 to afford azide derivative G23, which further reduced in the presence of PPh3 to obtain amino derivative G24. Furthermore, analogues I1∼J2 bearing a restrained rigid plane structure were designed and synthesised (Scheme 1(C)). In the presence of KOH, substituted isatin was reacted with 2,3-dihydro-1H-inden-1-one to afford indeno[1,2-b]quinoline analogues I1∼I2. Moreover, the carboxyl group of I1∼I2 was reduced by NaBH4/BF3·OEt2 in THF at room temperature to afford analogues J1∼J2 bearing a hydroxymethyl group.
In vitro antitumour activity
CCK-8 method was used to evaluate in vitro antiproliferative activity of analogues C1∼J2 against three cancer cell lines including HCT116 (colon cancer cell), A549 (lung cancer cell) and MDA-MB-231 (triple-negative breast cancer cell). Cisplatin and colchicine were used for comparison. As shown in , compounds C1 and D1, bearing a carboxyl and methyl ester group, respectively, were inactive against three cancer cell lines (IC50 > 50 μM). Compound D2 bearing a primary amide group displayed weak activity against A549 (IC50 = 46.56 μM). In contrast, compound D3 bearing a hydroxamic acid group displayed broad-spectrum and moderate antitumour activity (IC50: 35.25 μM∼38.26 μM). We further synthesised analogues F1∼F7 containing a secondary or tertiary amide group. Among them, F5 and F6 bearing an asymmetric tertiary amide group displayed the best anti-proliferative activity (IC50: 8.00 μM∼30.52 μM). More strikingly, compound G1 bearing a hydroxymethyl group displayed greatly improved antitumour activity with IC50 values ranging from 5.64 μM to 8.02 μM, indicating the hydroxyl group might form an essential interaction with surrounding residues. Based on the above SARs, we further synthesised analogues G2∼G20 bearing the hydroxymethyl group. SARs revealed the attached position and properties of R1 and R2 substituents had significant effects on antitumour activity. Among the analogues, compounds G13∼G15, bearing a 3′,4′,5′-3OMe phenyl group at C2 position of quinoline scaffold, displayed the best antitumour activity with IC50 values lower than 5 μM. For instance, IC50 values of G13 against HCT116, A549 and MDA-MB-231 were 0.90 μM, 0.86 μM and 0.65 μM, respectively, which were more potent than that of CDDP. Compounds G18∼G20 bearing a heterocyclic substituent also displayed moderate to good antiproliferative activity. For instance, IC50 values for G18 containing a pyrrole group are ranging from 8.19 μM to 12.71 μM. Furthermore, the hydroxyl group of G13 was transformed to chlorine (G21), bromine (G22), azide (G23), and amino (G24). These analogues displayed broad-spectrum and moderate to good antitumour activity. Analogues I1∼J2 bearing a restrained rigid plane structure displayed decreased antitumour activity, indicating the restrained rigid plane structure was not favourable for antitumour activity. Among the derivatives, G13 displayed the best antitumour activity. The cytotoxicity of G13 on human embryonic kidney cell 293 T was evaluated using CCK-8 method. It displayed moderate inhibitory activity against 293 T (IC50 = 18.12 μM). Taken together, G13 was selected for further biological evaluation.
Table 1. In vitro antitumour activity of compounds C1∼J2 (IC50, μM).
Structure–activity relationships for analogues C1∼J2
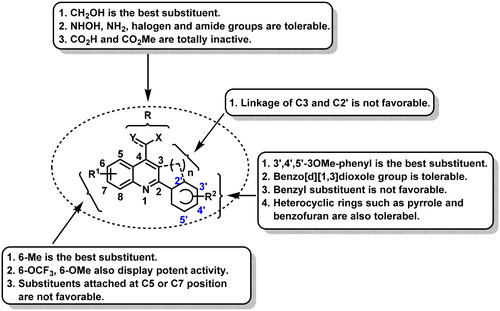
Summary of SARs for analogues C1∼J2 was depicted in . For R group at C4 position of the quinoline scaffold, the hydroxymethyl substituent significantly improved the antitumour activity. The hydroxamic acid, amino, amide, or halogen group was also tolerable, but displayed less potent activity. In contrast, when the R group was a carboxylic acid or methyl ester group, compounds were inactive. For R1 and R2 groups, we observed the attachment position and electronic properties of substituents had significant effects on activity. For R1 group, substituents attached at C6 position was more favourable than C5 or C7 position. 6-Methyl was the best substituent and greatly improved the activity. 6-Trifluoromethoxy and 6-methoxy were also favourable for activity. For R2 group, the best substituent was 3′,4′,5′-3OMe phenyl, which is the most common structure feature in numerous potent CBSIs such as colchicine, combretastatin A4 and ABI-231. Benzo[d][1,3]dioxole moiety was also tolerable, but displayed less potent activity. Larger groups like benzyl substituent were detrimental to activity. Furthermore, analogues G18∼G20 bearing a heterocyclic substituent displayed moderate to good antiproliferative activity, indicating the heterocyclic substituents were also tolerable. Four rings confused analogues I1∼J2 displayed moderate to weak antitumour activity, indicating the linkage of C3 and C2’ by sp3 carbon atom was not favourable for activity.
Figure 3. Summary of SARs for analogues C1∼J2.
Tubulin inhibition activity and the binding mode of G13 with tubulin
The tubulin inhibition activity was performed according to our previous reportsCitation34,Citation35. Colchicine was used as the positive control. As depicted in , compound G13 displayed the potent tubulin polymerisation inhibitory activity with an IC50 value of 13.5 μM. In contrast, colchicine displayed a more potent enzymatic inhibition activity (IC50 = 8.1 μM), which was consistent with the more potent cytotoxicity ().
Figure 4. (A) Tubulin polymerisation inhibitory activity of G13. (B) Tubulin polymerisation inhibitory activity of colchicine. (C) The binding mode of G13 with tubulin. (D) The overlapped binding modes of G13 (pink) and colchicine (blue).
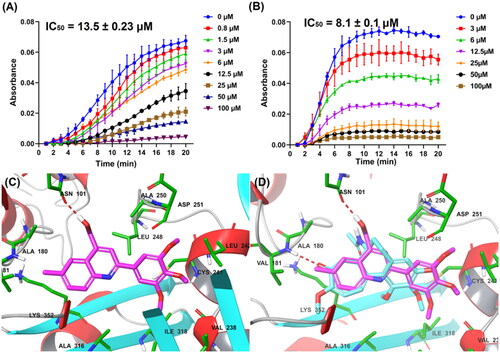
To clarify the binding mode of G13 with tubulin, molecular docking using Glide within Schrodinger software was performed according to our previous reportCitation34. As depicted in , G13 was observed to be well-fitted into the colchicine binding site. The hydroxymethyl group of G13 formed a hydrogen bond with residue Asn101, thus greatly improving the binding affinity and accounting the essential role for antitumour activity. 3′,4′,5′-3OMe-phenyl moiety of G13 was well overlapped with the 3OMe-phenyl moiety of colchicine (), and formed mainly hydrophobic interactions with surrounding residues including Leu242, Ile318, Val238, and Ile378. 6-Methyl-quinoline moiety of G13 was well overlapped with the tropone scaffold of colchicine and formed additional hydrophobic interactions with residues Ala180, Val181 and Val182, thus improving the activity.
G13 potently suppressed the migration and invasion of MDA-MB-231 cells
The migration and invasion of cancer cells play an essential role in cancer metastasis, which is the most common cause for patients death. For investigating the effects of G13 on anti-migratory activity against cancer cells, wound healing assay was performed using MDA-MB-231 cells. As depicted in , G13 potently suppressed the migration of MDA-MB-231 cells in a concentration dependant manner. Cells treated with G13 at 0.5 μM or 1 μM displayed obvious declined migration capability with the wound closure (%) of 19.3% and 7.1%, respectively. Colchicine at 0.5 μM displayed potent anti-migratory activity (4.0%), which was consistent with the potent in vitro antitumour activity.
Figure 5. (A) The wound healing assay was performed using MDA-MB-231 cells treated with G13 (0.5 μM or 1 μM) or colchicine (0.5 μM) for 24 h. The black and green dash lines indicated the edge of the scratch at 0 h and 24 h, respectively. (B) The wound closure area was measured by ImageJ software. (C) The transwell invasion assay was performed using MDA-MB-231 cells treated with G13 (0.5 μM, 1 μM or 5 μM) or colchicine (0.5 μM) for 24 h. (D) The relative migration rate was calculated by comparing with the control group. (E) The tube formation assay was performed using HUVECs treated with G13 (0.1 μM, 0.5 μM or 1 μM) for 6 h, then capillary-like networks were captured by the inverted microscope. Scale bar = 200 μm. The results are presented as the mean ± standard deviation. *p < .05, **p < .01, ***p < .001, and ****p < .0001, determined with unpaired t test.
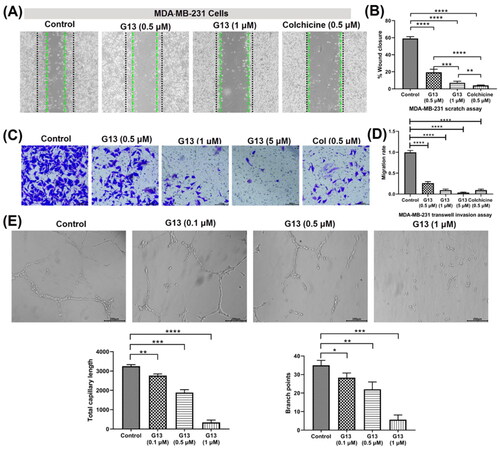
Transwell cell invasion assay is commonly used to measure cell chemotaxis and the invasion ability of cells through extracellular matrix, which are always found in cancer metastasis or embryonic developmentCitation36. For investigating the effects of G13 on anti-metastasis activity against cancer cells, transwell cell invasion assay was performed using MDA-MB-231 cells. As shown in , G13 potently decreased the invasion of MDA-MB-231 cells in a dose dependant manner. At 1 μM, G13 displayed a comparable inhibitory effect with that of colchicine at 0.5 μM. More strikingly, G13 at 5 μM almost totally inhibited cell invasion, which was superior to that of colchicine at 0.5 μM.
G13 displayed potent antiangiogenic activity
CBSIs have been reported to display potent antiangiogenic effect, which is important to prevent the tumour recurrence and metastasisCitation37. To investigate the effects of G13 on the formation of new blood vessels, tube formation assay using human umbilical vein endothelial cells (HUVECs) was performed. As shown in , HUVECs in the control group formed the intact capillary-like networks. After treating with G13 at 1 μM for 6 h, most HUVECs were observed to form spherical and small clusters. In contrast, G13 showed weak antiangiogenic activity at the concentration of 0.1 μM. The total capillary length and branch points were analysed by Angiogenesis Analyser installed in ImageJ software. This assay indicated G13 displayed obvious antiangiogenic effect in a concentration-dependent manner, which has promising applications in discovery of novel drugs that prevent the tumour recurrence and metastasis.
G13 induced the remarkable ultrastructural alterations of intercellular organelles
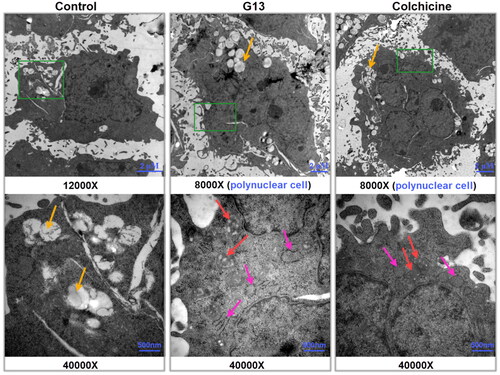
Transmission electron microscope (TEM) has been widely used to directly visualise the ultrastructural alterations of the intercellular organelles at high magnification, thus representing a valuable tool to explore the molecular mechanismCitation38. To investigate the effect of G13 on intercellular organelles, MDA-MB-231 cells were treated with 0.1% DMSO (control group), G13 (5 μM), or colchicine (5 μM) for 48 h, then collected and captured using TEM. As depicted in , cells in control group displayed an intact nucleus, normal cellular morphology, and undamaged intercellular organelles. Moreover, cells showed a lot of apparent fat droplets (yellow arrows). In contrast, cells treated with G13 showed the severe damage of mitochondria as seen by the swollen structure and the enlarged cristae spaces (red arrows). In addition, the rough endoplasmic reticulum became dilation (pink arrows). Similar alterations of mitochondria and endoplasmic reticulum were observed in colchicine treated cells. More strikingly, treatment with G13 or colchicine led to the formation of many polyploidy cancer cells (). It has been reported that tubulin inhibitors can induce mitotic arrest and result in formation of polynuclear cells, which are generally considered to be non-dividing cells or at the edge of apoptosisCitation39,Citation40. Taken together, the TEM results indicated G13 induced the remarkable alterations of the mitochondria and endoplasmic reticulum, blocked mitotic to form polynuclear cells, and eventually triggered apoptosis.
Figure 6. Transmission electron micrographs of MDA-MB-231 cells treated with 0.1% DMSO (control group), G13 (5 μM) or colchicine (5 μM) for 48 h. The green area in the top micrographs was enlarged below the micrographs. The yellow arrows illustrated a lot of fat droplets in cells. The red arrows illustrated the ultrastructural alterations of mitochondria. The pink arrows indicated the endoplasmic reticulum became dilation. Cells treated with G13 or colchicine resulted in the formation of polynuclear cells.
G13 caused severe damage to the microtubule network in MDA-MB-231 cells
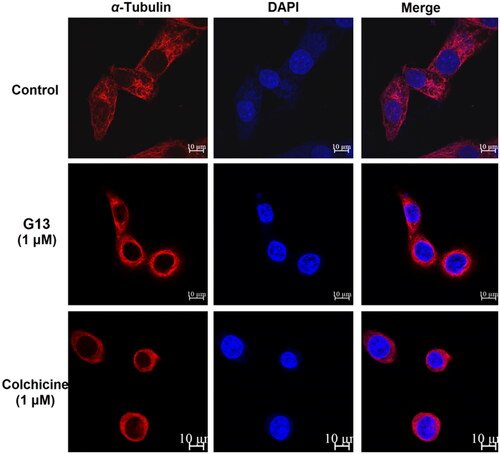
CBSIs interact with tubulin monomers and prevent their polymerisation into microtubule network. Due to the dynamic character of microtubule network, cells treated with CBSIs have been reported to display the fragmentation and disassembly of the microtubule networkCitation1,Citation41. For visualising the effect of G13 on microtubule network, immunofluorescent assay was performed according to our previous reportCitation34. Alexa-594 fluorescent labelled α-tubulin antibodies fluoresce red to visualise the microtubule network, and DAPI fluoresces blue to visualise the nucleus. As shown in , MDA-MB-231 cells treated with 0.1% DMSO (control group) showed an intact organised microtubule network extending throughout all cells. In contrast, cells treated with G13 at 1 μM showed the fragmentation and disassembly of the microtubule network indicating a serious damage was induced. Similarly, cells treated with colchicine at 1 μM showed severe damage of the microtubule network. This assay revealed G13 potently prevented the polymerisation of tubulin monomers and resulted in the depolymerisation and disassembly of the microtubule network.
Figure 7. MDA-MB-231 cells were treated with 0.1% DMSO (control group), G13 (1 μM) or colchicine (1 μM) for 24 h, then the change of microtubule networks was visualised using confocal immunofluorescent microscopy. Scale bar = 10 μm.
G13 potently induced apoptosis in MDA-MB-231 cells
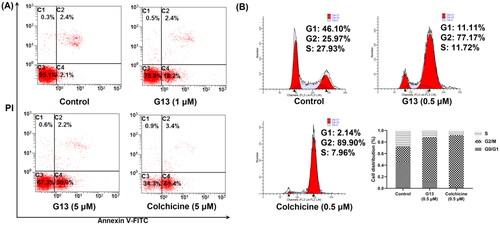
CBSIs bind tightly with tubulin monomers to perturb microtubule dynamics, thus leading to cell cycle arrest, apoptosis and ultimately cell death. To evaluate the effect of G13 on cell apoptosis, MDA-MB-231 cells were treated and detected by flow cytometry. As depicted in , both G13 and colchicine induced a significant apoptosis in MDA-MB-231 cells. After treating with G13 at 1 μM or 5 μM for 24 h, the apoptotic rates were 20.6% and 32.2%, respectively. Colchicine at 5 μM induced a higher apoptotic rate (64.4%), which was consistent with the more potent cytotoxicity. In contrast, cells treated with 0.1% DMSO (control group) displayed a low apoptotic rate (4.5%). This assay revealed G13 potently induced cell apoptosis, thus leading to cancer cell death.
Figure 8. Induction of apoptosis and cell-cycle arrest by G13 in MDA-MB-231 cells. (A) MDA-MB-231 cells were treated with 0.1% DMSO (control group), G13 (1 μM or 5 μM) or colchicine (5 μM) for 24 h, stained with annexin V-FITC/PI apoptosis detection kit and analysed by flow cytometry. (B) Cell cycle analysis after treatment with 0.1% DMSO (control group), G13 (0.5 μM) or colchicine (0.5 μM) for 24 h. The data are representative of two independent experiments.
G13 caused G2/M cell cycle arrest in MDA-MB-231 cells
CBSIs have been shown to induce mitotic arrest and block the cell cycle at the G2/M phase in various human carcinoma cellsCitation34,Citation41,Citation42. Therefore, the effect of G13 on cell cycle progression of MDA-MB-231 cells was investigated by flow cytometry assay. As depicted in , cells treated with G13 at 0.5 μM for 24 h showed an obvious G2/M cell cycle arrest with a ratio of 77.17%, which was lower than that of colchicine group (89.90%). In contrast, the ratio of G2/M phase for the control group was 25.97%. Taken together, this assay revealed G13 potently induced an obvious G2/M arrest in MDA-MB-231 cells, which was consistent with the effect of CBSIs.
G13 decreased MMP and increased intracellular ROS level in MDA-MB-231 cells
TEM results indicated G13 induced the severe damage of mitochondria. The alteration of mitochondrial membrane potential (MMP, ΔΨm) can change the outer and inner membrane permeability of mitochondrial and lead to cytochrome c release and caspases activation, thus efficiently inducing cell apoptosisCitation43. To explore the effects of G13 on MMP, JC-1 dye was used to assess the MMP alteration in MDA-MB-231 cellsCitation34. As depicted in , cells treated with 0.1% DMSO displayed well-defined integral mitochondrial membranes (monomers: aggregates = 5.05: 94.7). After treating with G13 at 1 μM or 5 μM, cells with high MMP were decreased to 63.6% and 56.5%, respectively. Accordingly, cells with low MMP were increased to 33.8% and 43.4%, respectively. This assay revealed G13 decreased MMP in a concentration dependent manner which effectively induced the apoptosis of cancer cells.
Figure 9. The effect of G13 on MMP and intracellular ROS level in MDA-MB-231 cells. (A) MDA-MB-231 cells were treated with 0.1% DMSO (control group), or G13 (1 μM or 5 μM) for 24 h, stained with JC-1 dye and analysed by flow cytometry. (B) ROS level was detected after treatment with 0.1% DMSO (control group), or G13 (1 μM or 5 μM) for 24 h. The data are representative of two independent experiments.
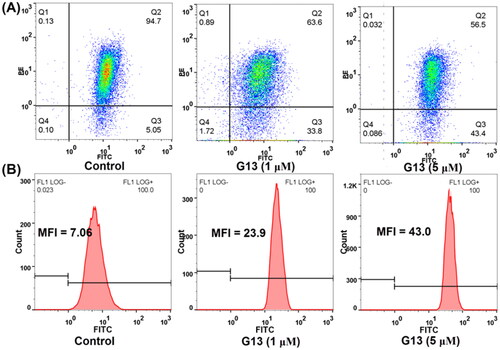
The intracellular reactive oxygen species (ROS) level plays an important role in triggering cell apoptosis. To explore the effect of G13 on intracellular ROS level, MDA-MB-231 cells were treated with G13 at 1 μM or 5 μM for 24 h, then added the oxidation-sensitive dye 2′,7′-dichlorodihydrofluorescein diacetate (DCFH-DA) to monitor the change of intracellular ROS level. DCFH-DA can be oxidised by intracellular ROS to afford the fluorescent product 2′,7′-dichlorofluorescein (DCF), which can be detected by flow cytometry to quantify the intracellular ROS level. As depicted in , cells treated with G13 at 1 μM or 5 μM showed an obvious increase of intracellular ROS level with the mean fluorescence intensity (MFI) value of 23.9 and 43, respectively. In contrast, MFI value of the control group was 7.06. This assay revealed G13 efficiently increased the intracellular ROS level, thus triggering the cell apoptosis.
G13 exhibited good in vivo antitumour efficacy in MDA-MB-231 xenograft model
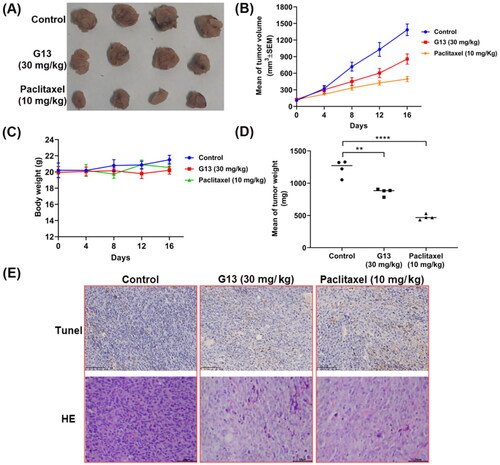
G13 displayed potent in vitro antitumour activity and valuable antitumour properties. To evaluate in vivo antitumour potency of G13, MDA-MB-231 xenograft nude mice model was used in this study. After the tumour size was about 100 mm3, the mice were randomly separated into three groups (n = 4) and administrated by paclitaxel or G13 once three days via intraperitoneal (i.p.) injection. Control group was treated by saline. The body weight and tumour size were measured once four days. As depicted in , G13 displayed good in vivo antitumour potency at the dose of 30 mg/kg with the tumour growth inhibition (TGI) value of 38.2%. Paclitaxel at the dose of 10 mg/kg displayed potent in vivo antitumour potency (TGI = 64.3%). More importantly, no obvious body weight change was observed in G13 treated group, indicating G13 was well tolerated and had a low toxicity (). Furthermore, the tumours were dissected and performed TUNEL and H&E staining. As shown in , images of TUNEL and H&E staining showed more apoptotic cells and necrotic cells in G13 and paclitaxel treated group as compared with the control group. Taken together, in vivo antitumour assay revealed G13 exhibited good in vivo antitumour activity with a low toxicity, and it significantly induced in vivo tumour necrosis and apoptosis, thus representing a promising lead structure for further optimisation.
Figure 10. In vivo antitumour potency of G13 in MDA-MB-231 xenograft model. (A) Picture of dissected tumour tissue. (B) Change in tumour size. (C) Change in body weight. (D) Tumour weight. (E) TUNEL and H&E staining pictures of dissected tumour tissue. **p < .01, ****p < .0001, as determined by unpaired t test.
Conclusion
CBSIs are promising to surmount drug resistance faced by the available microtubule-targeting drugs. For improving antitumour efficacy of our previous reported lead structure, herein, structure based drug design and structural optimisation were performed to afford a series of analogues with diverse substituents and scaffolds. Among them, analogue G13 displayed potent tubulin polymerisation inhibitory activity (IC50 = 13.5 μM) and excellent in vitro antiproliferative activity. G13 potently inhibited the migration and invasion of MDA-MB-231 cells, and exerted potent antiangiogenic activity. More importantly, it exhibited good in vivo antitumour efficacy in MDA-MB-231 xenograft models (TGI = 38.2%; i.p., 30 mg/kg). Despite of the fact that hundreds of diverse molecules have been reported to interact with the colchicine site, compound G13 displayed a number of preferable advantages, including good drug-like properties with a low molecular weight (M.W. = 339) and a suitable clogP value (3.45), as well as an easy-to-modify chemical structure, thus representing a good lead structure for further modification. Taken together, our work highlights G13 is a valuable lead compound for the development of novel tubulin-targeted antitumour agents. Further structural modification and antitumour evaluation are currently underway in our lab.
Experimental
Chemistry
1H NMR and 13C NMR spectra were recorded on Bruker AVANCE400 spectrometer (Bruker Company, Germany), using TMS as an internal standard and CDCl3 or DMSO-d6 as solvents. Chemical shift are given in ppm (δ). The mass spectra were recorded on an Esquire 3000 LC-MS mass spectrometer. Silica gel thin-layer chromatography was performed on precoated plates GF-254. All solvents and reagents were analytically pure, and no further purification was needed. All starting materials were commercially available.
Chemical synthesis of compounds C1∼J2
2-(Benzo[d][1,3]dioxol-5-yl)-6-methoxyquinoline-4-carboxylic acid (C1)
A solution of 5-methoxyindoline-2,3-dione (150 mg, 0.85 mmol), KOH (143 mg, 2.55 mmol), and 1-(benzo[d][1,3]dioxol-5 -yl)ethan-1-one (140 mg, 0.85 mmol) in EtOH (15 mL) was refluxed at 80 °C for 24 h. Then hydrochloric acid solution was added to adjust pH to 2. Compound C1 was obtained as yellow solid (186 mg, yield = 68%) via filtration. 1H-NMR (400 MHz, DMSO-d6): δ 3.92 (s, 3H), 6.14 (s, 2H), 7.09 (d, J = 8.1 Hz, 1H), 7.52 (dd, J = 2.9 Hz, 9.1 Hz, 1H), 7.79 (dd, J = 2.3 Hz, 8.2 Hz, 1H), 7.83 (s, 1H), 8.09–8.11 (m, 2H), 8.41 (s, 1H). HRMS (ESI positive) m/z calcd for C18H14NO5 (M + 1): 324.0872, found 324.0877.
Methyl-2-(benzo[d][1,3]dioxol-5-yl)-6-methoxyquinoline-4-carboxylate (D1)
A solution of C1 (40 mg, 0.12 mmol) and SOCl2 (44 mg, 0.37 mmol) in DCM (5 mL) was refluxed for 6 h. Then the solvent was evaporated and the residue was dissolved in DCM (5 mL). Methanol (50 μL) was added and the mixture was stirred at room temperature for 30 min. After reaction, the solvent was evaporated under reduced pressure and the product D1 was obtained as white solid (26 mg, yield = 64%) by column chromatography. 1H-NMR (400 MHz, DMSO-d6): δ 3.99 (s, 3H), 4.08 (s, 3H), 6.07 (s, 2H), 6.97 (d, J = 8.2 Hz, 1H), 7.44 (d, J = 8.2 Hz, 1H), 7.71 (d, J = 8.2 Hz, 1H), 7.76 (s, 1H), 8.22 (d, J = 2.6 Hz, 1H), 8.37 (s, 1H). HRMS (ESI positive) m/z calcd for C19H16NO5 (M + 1): 338.1028, found 338.1036.
2-(Benzo[d][1,3]dioxol-5-yl)-6-methoxyquinoline-4-carboxamide (D2)
A solution of C1 (40 mg, 0.12 mmol) and SOCl2 (44 mg, 0.37 mmol) in DCM (5 mL) was refluxed for 6 h. Then the solvent was evaporated and the residue was dissolved in DCM (5 mL). Ammonia (100 μL) was added and the mixture was stirred at room temperature for 30 min. After reaction, the solvent was evaporated under reduced pressure and the product D2 was obtained as white solid (23 mg, yield = 58%) by column chromatography. 1H-NMR (400 MHz, DMSO-d6): δ 3.88 (s, 3H), 6.12 (s, 2H), 7.08 (d, J = 8.1 Hz, 1H), 7.45 (dd, J = 2.9 Hz, 9.1 Hz, 1H), 7.67 (d, J = 2.7 Hz, 1H), 7.81 (d, J = 1.7 Hz, 1H), 7.83–7.87 (m, 2H), 7.99 (d, J = 9.2 Hz, 1H), 8.07 (s, 1H), 8.30 (s, 1H). HRMS (ESI positive) m/z calcd for C18H15N2O4 (M + 1): 323.1032, found 323.1033.
2-(Benzo[d][1,3]dioxol-5-yl)-N-hydroxy-6-methoxyquinoline-4-carboxamide (D3)
A solution of compound C1 (20 mg, 0.062 mmol) and 1,1′-carbonyldiimidazole (15 mg, 0.093 mmol) in THF (2 mL) was stirred at room temperature for 1 h. Then hydroxylamine hydrochloride (9 mg, 0.124 mmol) was added and the solution was stirred for further 12 h. After reaction, the solvent was evaporated under reduced pressure and the product D3 was obtained as yellow solid (14 mg, yield = 67%). 1H-NMR (400 MHz, DMSO-d6): δ 3.88 (s, 3H), 6.13 (s, 2H), 7.09 (d, J = 8.0 Hz, 1H), 7.47 (d, J = 9.2 Hz, 1H), 7.58 (s, 1H), 7.80–7.83 (m, 2H), 7.99–8.01 (m, 2H), 9.47 (s, 1H), 11.40 (s, 1H). HRMS (ESI positive) m/z calcd for C18H15N2O5 (M + 1): 339.0981, found 339.0988.
2-(Benzo[d][1,3]dioxol-5-yl)-6-methoxy-N-methylquinoline-4-carboxamide (F1)
Compound C1 (40 mg, 0.12 mmol), methylamine (3.7 mg, 0.12 mmol), EDCI (23 mg, 0.12 mmol) and DMAP (3 mg) were added in DCM (5 mL). The mixture was stirred at room temperature for 6 h. After reaction, the solvent was evaporated under reduced pressure and the product F1 was obtained as white solid (30 mg, yield = 74%) by column chromatography. The synthetic procedure for compounds F2∼F7 was similar to that of F1. 1H-NMR (400 MHz, DMSO-d6): δ 2.90 (d, J = 4.6 Hz, 3H), 3.88 (s, 3H), 6.12 (s, 2H), 7.08 (d, J = 8.0 Hz, 1H), 7.45 (dd, J = 2.7 Hz, 9.2 Hz, 1H), 7.61 (d, J = 2.6 Hz, 1H), 7.82 (d, J = 9.1 Hz, 1H), 7.84 (s, 1H), 7.99 (d, J = 9.2 Hz, 1H), 8.07 (s, 1H), 8.77 (d, J = 4.6 Hz, 1H). HRMS (ESI positive) m/z calcd for C19H17N2O4 (M + 1): 337.1188, found 337.1193.
2-(Benzo[d][1,3]dioxol-5-yl)-N-ethyl-6-methoxyquinoline-4-carboxamide (F2)
Yellow solid (24 mg), yield = 57%. 1H-NMR (400 MHz, DMSO-d6): δ 1.23 (t, J = 7.2 Hz, 3H), 3.87 (s, 3H), 6.12 (s, 2H), 7.09 (d, J = 8.1 Hz, 1H), 7.46 (dd, J = 2.6 Hz, 9.2 Hz, 1H), 7.58 (d, J = 2.8 Hz, 1H), 7.82–7.85 (m, 2H), 7.98 (d, J = 9.2 Hz, 1H), 8.03 (s, 1H), 8.86 (t, J = 5.6 Hz, 1H). HRMS (ESI positive) m/z calcd for C20H19N2O4 (M + 1): 351.1345, found 351.1349.
2-(Benzo[d][1,3]dioxol-5-yl)-N-(cyanomethyl)-6-methoxyquinoline-4-carboxamide (F3)
White solid (32 mg), yield = 74%. 1H-NMR (400 MHz, DMSO-d6): δ 3.88 (s, 3H), 4.18 (d, J = 2.8 Hz, 2H), 6.13 (s, 2H), 7.09 (d, J = 8 Hz, 1H), 7.47 (dd, J = 2.6 Hz, 9 Hz, 1H), 7.58 (d, J = 2.4 Hz, 1H), 7.84 (d, J = 11.6 Hz, 2H), 7.99 (s, 1H), 8.02 (s, 1H), 9.35 (d, J = 5.6 Hz, 1H). HRMS (ESI positive) m/z calcd for C20H16N3O4 (M + H): 362.1141 found 362.1143.
2-(Benzo[d][1,3]dioxol-5-yl)-6-methoxy-N,N-dimethylquinoline-4-carboxamide (F4)
Yellow solid (27 mg), yield = 64%. 1H-NMR (400 MHz, DMSO-d6): δ 2.82 (s, 3H), 3.13 (s, 3H), 3.86 (s, 3H), 6.12 (s, 2H), 6.93 (br, 1H), 7.06 (d, J = 7.2 Hz, 1H), 7.47 (d, J = 9.2 Hz, 1H), 7.84 (d, J = 9.2 Hz, 2H), 7.99 (s, 2H). 13C-NMR (100 MHz, CDCl3): 34.88, 38.77, 55.67, 101.39, 102.37, 107.60, 108.51, 115.92, 121.40, 122.81, 123.89, 131.56, 142.07, 144.54, 148.47, 148.83, 153.96, 158.36, 168.96. HRMS (ESI positive) m/z calcd for C20H19N2O4 (M + H): 351.1345, found 351.1348.
2-(Benzo[d][1,3]dioxol-5-yl)-N-ethyl-6-methoxy-N-methylquinoline-4-carboxamide (F5)
Pale solid (31 mg), yield = 70%. 1H-NMR (400 MHz, DMSO-d6): δ 1.01 (t, J = 7.1 Hz), 1.28 (t, J = 7.1 Hz), 2.78 (s), 3.13 (s), 3.87 (s), 5.76 (s, 1H), 6.12 (s, 2H), 6.93 (dd, J = 2.8 Hz, 4.4 Hz, 1H), 7.06 (d, J = 8.0 Hz, 1H), 7.47 (d, J = 9.2 Hz, 1H), 7.84–7.86 (m, 2H), 7.99–8.02 (m, 2H). HRMS (ESI positive) m/z calcd for C21H21N2O4 (M + H): 365.1501, found 365.1505.
2-(Benzo[d][1,3]dioxol-5-yl)-N-isopropyl-6-methoxy-N-methylquinoline-4-carboxamide (F6)
Pale solid (31 mg), yield = 67%. 1H-NMR (400 MHz, DMSO-d6): δ 1.08 (dd, J = 22.2 Hz, 6.5 Hz), 1.23–1.28 (m), 2.63 (s), 3.02 (s), 3.86 (s, 3H), 6.12 (s, 2H), 6.90 (dd, J = 12.1 Hz, 2.1 Hz, 1H), 7.06 (d, J = 8.0 Hz, 1H), 7.47 (d, J = 9.2 Hz, 1H), 7.85 (br, 2H), 7.98–8.02 (m, 2H). HRMS (ESI positive) m/z calcd for C22H23N2O4 (M + 1): 379.1658, found 379.1660.
(2-(Benzo[d][1,3]dioxol-5-yl)-6-methoxyquinolin-4-yl)(pyrrolidin-1-yl)methanone (F7)
Pale solid (29 mg), yield = 63%. 1H-NMR (400 MHz, DMSO-d6): δ 1.82 (t, J = 6.8 Hz, 2H), 1.93 (t, J = 6.8 Hz, 2H), 3.16 (t, J = 6.6 Hz, 2H), 3.65 (t, J = 7.0 Hz, 2H), 3.87 (s, 3H), 6.11 (s, 2H), 7.04 (d, J = 2.6 Hz, 1H), 7.06 (d, J = 8.0 Hz, 1H), 7.47 (dd, J = 9.2 Hz, 2.8 Hz, 1H), 7.84–7.86 (m, 2H), 8.01 (d, J = 9.2 Hz, 1H), 8.04 (s, 1H). HRMS (ESI positive) m/z calcd for C22H21N2O4 (M + 1): 377.1501, found 377.1502.
(2-(Benzo[d][1,3]dioxol-5-yl)-6-methoxyquinolin-4-yl)methanol (G1)
A solution of compound C1 (40 mg, 0.12 mmol) and LiAlH4 (0.24 mmol) in THF (3 mL) was stirred at 0 °C for 15 min. Then the solution was warmed to room temperature and stirred for further 30 min. After reaction, the solvent was evaporated under reduced pressure and the product G1 was obtained as white solid (27 mg, yield = 73%) by column chromatography. The synthetic procedure for compounds G2, G3, G5, G7∼G20 was similar to that of G1. 1H-NMR (400 MHz, CDCl3): δ 3.88 (s, 3H), 5.12 (s, 2H), 5.98 (s, 2H), 6.87 (d, J = 7.9 Hz, 1H), 7.12 (d, J = 2.4 Hz, 1H), 7.31 (dd, J = 2.4 Hz, 9.2 Hz, 1H), 7.58 (d, J = 9.3 Hz, 1H), 7.65 (s, 1H), 7.81 (s, 1H), 8.01 (d, J = 9.1 Hz, 1H). HRMS (ESI positive) m/z calcd for C18H16NO4 (M + 1): 310.1079, found 310.1084.
(2-(3-Fluoro-4-methoxyphenyl)-6-methoxyquinolin-4-yl)methanol (G2)
White solid (22 mg), yield = 58%. 1H-NMR (400 MHz, DMSO-d6): δ 3.93 (s, 6H), 5.04 (d, J = 7.6 Hz, 2H), 5.61 (t, J = 5.2 Hz, 1H), 7.32–7.41 (m, 3H), 7.97–8.08 (m, 4H). HRMS (ESI positive) m/z calcd for C18H17FNO3 (M + 1): 314.1192, found 314.1195.
(2-(3-(Benzyloxy)phenyl)-6-methylquinolin-4-yl)methanol (G3)
White solid (30 mg), yield = 70%. 1H-NMR (400 MHz, CDCl3): δ 2.55 (s, 3H), 5.20 (s, 2H), 5.21 (s, 2H), 7.06 (dd, J = 2.0 Hz, 8.0 Hz, 1H), 7.34–7.44 (m, 4H), 7.50 (d, J = 7.2 Hz, 2H), 7.56 (d, J = 8.8 Hz, 1H), 7.66 (s, 1H), 7.70 (d, J = 7.9 Hz, 1H), 7.85 (s, 1H), 7.95 (s, 1H). 13C-NMR (100 MHz, CDCl3): 21.92, 62.12, 70.16, 113.73, 115.99, 116.27, 117.97, 120.19, 121.65, 124.85, 127.51, 127.64, 127.98, 128.59, 129.58, 129.79, 130.05, 131.72, 136.44, 137.04, 141.15, 156.10, 159.32. HRMS (ESI positive) m/z calcd for C24H22NO2 (M + 1): 356.1651, found 356.1655.
3-(4-(Hydroxymethyl)-6-methylquinolin-2-yl)phenol (G4)
A solution of compound G3 (20 mg, 0.056 mmol) and Pd/C (5 mg) in MeOH (3 mL) was stirred under hydrogen atmosphere at room temperature for 12 h. After reaction, the target compound G4 was obtained as pale solid (12 mg, yield = 81%) by column chromatography. The synthetic procedure for compound G6 was similar to that of G4. 1H-NMR (400 MHz, DMSO-d6): δ 2.52 (s, 3H), 5.05 (s, 2H), 5.65 (s, 1H), 6.88 (d, J = 8.0 Hz, 1H), 7.33 (t, J = 7.8 Hz, 1H), 7.60 (t, J = 7.7 Hz, 2H), 7.67 (s, 1H), 7.81 (s, 1H), 7.95 (d, J = 8.5 Hz, 1H), 8.03 (s, 1H), 9.63 (s, 1H). HRMS (ESI positive) m/z calcd for C17H16NO2 (M + 1): 266.1181, found 266.1180.
(2-(3-(benzyloxy)-4-methoxyphenyl)-6-methylquinolin-4-yl)methanol (G5)
Pale solid (28 mg), yield = 60%. 1H-NMR (400 MHz, DMSO-d6): δ 2.52 (s, 3H), 3.87 (s, 3H), 5.05 (d, J = 5.6 Hz, 2H), 5.23 (s, 2H), 5.59 (d, J = 5.5 Hz, 1H), 7.16 (d, J = 8.5 Hz, 1H), 7.36 (t, J = 7.3 Hz, 1H), 7.47–7.39 (m, 2H), 7.54 (d, J = 7.5 Hz, 2H), 7.59 (d, J = 8.7 Hz, 1H), 7.79–7.81 (m, 2H), 7.94 (d, J = 8.5 Hz, 1H), 7.98 (s, 1H), 8.07 (s, 1H). HRMS (ESI positive) m/z calcd for C25H24NO3 (M + 1): 386.1756, found 386.1745.
5-(4-(Hydroxymethyl)-6-methylquinolin-2-yl)-2-methoxyphenol (G6)
Pale solid (11 mg), yield = 67%. 1H-NMR (400 MHz, DMSO-d6): δ 2.50 (s, 3H), 3.85 (s, 3H), 5.04 (d, J = 5.6 Hz, 2H), 5.59 (t, J = 5.6 Hz, 1H), 7.07 (d, J = 8.5 Hz, 1H), 7.57 (d, J = 8.6 Hz, 1H), 7.64 (d, J = 8.3 Hz, 1H), 7.77 (d, J = 7.6 Hz, 2H), 7.92 (d, J = 8.6 Hz, 1H), 8.01 (s, 1H), 9.24 (s, 1H). HRMS (ESI positive) m/z calcd for C18H18NO3 (M + 1): 296.1287, found 296.1273.
(6-Methyl-2-phenylquinolin-4-yl)methanol (G7)
Pale solid (22 mg), yield = 73%. 1H-NMR (400 MHz, DMSO-d6): δ 2.53 (s, 3H), 5.06 (s, 2H), 5.62 (s, 1H), 7.47–7.62 (m, 4H), 7.83 (s, 1H), 7.99 (d, J = 8.5 Hz, 1H), 8.11 (s, 1H), 8.23 (d, J = 7.6 Hz, 2H). 13C-NMR (100 MHz, CDCl3): 21.90, 62.10, 116.19, 121.65, 124.75, 127.46, 128.77, 129.21, 130.02, 131.70, 136.36, 139.64, 145.72, 146.64, 156.40. HRMS (ESI positive) m/z calcd for C17H16NO (M + 1): 250.1232, found 250.1229.
(2-(P-tolyl)quinolin-4-yl)methanol (G8)
Pale solid (23 mg), yield = 76%. 1H-NMR (400 MHz, CDCl3): δ 2.43 (s, 3H), 5.23 (s, 2H), 7.30 (d, J = 7.9 Hz, 2H), 7.57–7.49 (m, 1H), 7.77–7.69 (m, 1H), 7.90 (d, J = 8.4 Hz, 1H), 7.98 (s, 1H), 8.06 (d, J = 7.9 Hz, 2H), 8.25 (d, J = 8.5 Hz, 1H). 13C-NMR (100 MHz, CDCl3): 21.31, 61.92, 115.98, 122.61, 124.68, 126.15, 127.42, 129.41, 129.50, 130.11, 136.67, 139.50, 146.53, 147.99, 157.26. HRMS (ESI positive) m/z calcd for C17H16NO (M + 1): 250.1232, found 250.1227.
(2-(4-Chlorophenyl)quinolin-4-yl)methanol (G9)
Brown solid (18 mg), yield = 56%. 1H-NMR (400 MHz, DMSO-d6): δ 5.09 (d, J = 5.5 Hz, 2H), 5.67 (t, J = 5.5 Hz, 1H), 7.64 (br, 3H), 7.79 (t, J = 7.7 Hz, 1H), 8.06–8.11 (m, 2H), 8.17 (s, 1H), 8.29 (d, J = 8.4 Hz, 2H). 13C-NMR (100 MHz, CDCl3): 60.83, 114.59, 121.56, 123.73, 125.59, 127.78, 127.96, 128.65, 129.29, 134.62, 136.91, 145.75, 146.99, 154.96. HRMS (ESI positive) m/z calcd for C16H13ClNO (M + 1): 270.0686, found 270.0691.
(2-(3,4,5-Trimethoxyphenyl)quinolin-4-yl)methanol (G10)
White solid (25 mg), yield = 64%. 1H-NMR (400 MHz, DMSO-d6): δ 3.75 (s, 3H), 3.93 (s, 6H), 5.09 (d, J = 4.7 Hz, 2H), 5.64 (t, J = 4.7 Hz, 1H), 7.55 (s, 2H), 7.56–7.62 (m, 1H), 7.77 (t, J = 8.0 Hz, 1H), 8.09 (m, 2H), 8.16 (s, 1H). HRMS (ESI positive) m/z calcd for C19H20NO4 (M + 1): 326.1392, found 326.1393.
(5-Fluoro-2-(3,4,5-trimethoxyphenyl)quinolin-4-yl)methanol (G11)
Pale solid (23 mg), yield = 59%. 1H-NMR (400 MHz, DMSO-d6): δ 3.76 (s, 5H), 3.93 (s, 6H), 5.15 (d, J = 4.9 Hz, 2H), 5.70 (t, J = 4.9 Hz, 1H), 7.38 (dd, J = 12.1 Hz, 7.5 Hz, 1H), 7.52 (s, 2H), 7.77 − 7.70 (m, 1H), 7.94 (d, J = 8.0 Hz, 1H), 8.27 (s, 1H). HRMS (ESI positive) m/z calcd for C19H19FNO4 (M + 1): 344.1298, found 344.1290.
(6-Fluoro-2-(3,4,5-trimethoxyphenyl)quinolin-4-yl)methanol (G12)
Brown solid (21 mg), yield = 51%. 1H-NMR (400 MHz, DMSO-d6): δ 3.75 (s, 3H), 3.93 (s, 6H), 5.03 (d, J = 4.8 Hz, 2H), 5.67 (t, J = 4.7 Hz, 1H), 7.53 (s, 2H), 7.67 (dt, J = 2.8 Hz, 9.0 Hz, 1H), 7.85 (dd, J = 10.3 Hz, 2.8 Hz, 1H), 8.20–8.12 (m, 2H). HRMS (ESI positive) m/z calcd for C19H19FNO4 (M + 1): 344.1298, found 344.1290.
(6-Methyl-2-(3,4,5-trimethoxyphenyl)quinolin-4-yl)methanol (G13)
White solid (27 mg), yield = 66%. 1H-NMR (400 MHz, DMSO-d6): δ 3.75 (s, 3H), 3.93 (s, 6H), 5.06 (d, J = 5.5 Hz, 2H), 5.67 (t, J = 5.5 Hz, 1H), 7.52 (s, 2H), 7.60 (d, J = 8.7 Hz, 1H), 7.85 (s, 1H), 7.98 (d, J = 8.4 Hz, 1H), 8.11 (s, 1H). HRMS (ESI positive) m/z calcd for C20H22NO4 (M + 1): 340.1549, found 340.1541.
(6-Methoxy-2-(3,4,5-trimethoxyphenyl)quinolin-4-yl)methanol (G14)
White solid (25 mg), yield = 59%. 1H-NMR (400 MHz, DMSO-d6): δ 3.74 (s, 3H), 3.92 (s, 9H), 5.05 (d, J = 5.5 Hz, 2H), 5.62 (t, J = 5.5 Hz, 1H), 7.34 (d, J = 2.8 Hz, 1H), 7.41 (dd, J = 9.2 Hz, 2.7 Hz, 1H), 7.50 (s, 2H), 8.00 (d, J = 9.2 Hz, 1H), 8.11 (s, 1H). 13C-NMR (100 MHz, DMSO-d6): 55.52, 56.02, 60.11, 60.29, 78.61, 102.04, 104.21, 115.78, 121.46, 125.68, 131.10, 134.64, 138.72, 143.18, 147.04, 153.06, 153.17, 157.04. HRMS (ESI positive) m/z calcd for C20H22NO5 (M + 1): 356.1498, found 356.1493.
(6-(Trifluoromethoxy)-2-(3,4,5-trimethoxyphenyl)quinolin-4-yl)methanol (G15)
Yellow solid (20 mg), yield = 40%. 1H-NMR (400 MHz, DMSO-d6): δ 3.75 (s, 3H), 3.93 (s, 6H), 5.06 (d, J = 5.3 Hz, 2H), 5.71 (t, J = 5.3 Hz, 1H), 7.57 (s, 2H), 7.76 (d, J = 9.2 Hz, 1H), 8.08 (s, 1H), 8.20–8.25 (m, 2H). HRMS (ESI positive) m/z calcd for C20H19F3NO5 (M + 1): 410.1215, found 410.1202.
(7-Methoxy-2-(3,4,5-trimethoxyphenyl)quinolin-4-yl)methanol (G16)
White solid (22 mg), yield = 51%. 1H-NMR (400 MHz, DMSO-d6): δ 3.75 (s, 3H), 3.93 (s, 6H), 3.95 (s, 3H), 5.03 (d, J = 5.5 Hz, 2H), 5.57 (t, J = 5.5 Hz, 1H), 7.22 (dd, J = 9.0 Hz, 2.0 Hz, 1H), 7.45 (d, J = 2.0 Hz, 1H), 7.54 (s, 2H), 7.99 (d, J = 8.4 Hz, 1H), 8.00 (s, 1H). HRMS (ESI positive) m/z calcd for C20H22NO5 (M + 1): 356.1498, found 356.1492.
(8-Methoxy-2-(3,4,5-trimethoxyphenyl)quinolin-4-yl)methanol (G17)
Yellow solid (24 mg), yield = 56%. 1H-NMR (400 MHz, CDCl3): δ 3.90 (s, 3H), 4.00 (s, 6H), 4.12 (s, 3H), 5.25 (s, 2H), 7.12 (d, J = 7.4 Hz, 1H), 7.38 (s, 2H), 7.44 − 7.54 (m, 2H), 8.10 (s, 1H). HRMS (ESI positive) m/z calcd for C20H22NO5 (M + 1): 356.1498, found 356.1490.
(6-Methoxy-2-(1H-pyrrol-2-yl)quinolin-4-yl)methanol (G18)
Brown solid (25 mg), Yield = 81%. 1H-NMR (400 MHz, DMSO-d6): δ 3.90 (s, 3H), 4.98 (s, 2H), 5.58 (br, 1H), 6.19 (s, 1H), 6.84 (s, 1H), 6.92 (s, 1H), 7.25 (s, 1H), 7.35 (d, J = 9.1 Hz, 1H), 7.85–7.89 (m, 2H), 11.51 (s, 1H). HRMS (ESI positive) m/z calcd for C15H15N2O2 (M + 1): 255.1134, found 255.1133.
(2-(Furan-2-yl)-6-methylquinolin-4-yl)methanol (G19)
Yellow solid (24 mg), yield = 83%. 1H-NMR (400 MHz, DMSO-d6): δ 5.03 (d, J = 5.3 Hz, 2H), 5.63 (t, J = 5.5 Hz, 1H), 6.72 (s, 1H), 7.28 (d, J = 3.3 Hz, 1H), 7.59 (d, J = 8.7 Hz, 1H), 7.77 (s, 1H), 7.89–7.92 (m, 2H), 7.97 (s, 1H). HRMS (ESI positive) m/z calcd for C15H14NO2 (M + 1): 240.1025, found 240.1032.
(2-(Benzofuran-2-yl)-6-methylquinolin-4-yl)methanol (G20)
Yellow solid (18 mg), yield = 51%. 1H-NMR (400 MHz, DMSO-d6): δ 2.54 (s, 3H), 5.09 (s, 2H), 7.33 (t, J = 7.6 Hz, 1H), 7.43 (t, J = 7.8 Hz, 1H), 7.65 (d, J = 8.7 Hz, 1H), 7.72–7.81 (m, 3H), 7.84 (s, 1H), 8.01 (d, J = 8.5 Hz, 1H), 8.19 (s, 1H). HRMS (ESI positive) m/z calcd for C19H16NO2 (M + 1): 290.1181, found 290.1180.
4-(Chloromethyl)-6-methyl-2–(3,4,5-trimethoxyphenyl)quinoline (G21)
To a solution of G13 (20 mg, 0.059 mmol) in DCM (5 mL), SOCl2 (172 μL) was added and the mixture stirred at 0 °C for 3 h. After reaction, the solvent was evaporated under reduced pressure and the product G21 was obtained as yellow solid (11 mg, yield = 52%) by column chromatography. 1H-NMR (400 MHz, CDCl3): δ 2.66 (s, 3H), 3.96 (s, 3H), 4.11 (s, 6H), 5.16 (s, 2H), 7.60 (s, 2H), 7.83 (d, J = 8.1 Hz, 1H), 7.89 (s, 1H), 8.15 (s, 1H), 9.56 (d, J = 8.4 Hz, 1H). HRMS (ESI positive) m/z calcd for C20H21ClNO3 (M + 1): 358.1210, found 358.1201.
4-(Bromomethyl)-6-methyl-2-(3,4,5-trimethoxyphenyl)quinoline (G22)
G13 (40 mg, 0.12 mmol), NBS (43 mg, 0.24 mmol) and PPh3 (62 mg, 0.24 mmol) were added in THF (3 mL) at 0 °C. Then the solution was warmed to room temperature and stirred for 24 h. After reaction, the solvent was evaporated under reduced pressure and the product G22 was obtained as yellow solid (26 mg, yield = 54%) by column chromatography. 1H-NMR (400 MHz, CDCl3): δ 2.66 (s, 3H), 3.96 (s, 3H), 4.12 (s, 7H), 4.98 (s, 2H), 7.55 (s, 2H), 7.82–7.88 (m, 2H), 8.14 (s, 1H), 9.62 (d, J = 6.4 Hz, 1H). 13C-NMR (100 MHz, CDCl3): 21.95, 51.88, 56.39, 60.96, 104.92, 118.11, 121.71, 124.95, 130.24, 132.11, 135.04, 136.91, 139.67, 140.29, 147.01, 153.64, 155.96. HRMS (ESI positive) m/z calcd for C20H21BrNO3 (M + 1): 402.0705, found 402.0706.
4-(Azidomethyl)-6-methyl-2-(3,4,5-trimethoxyphenyl)quinoline (G23)
A solution of G22 (20 mg, 0.05 mmol), NaN3 (6.5 mg, 0.1 mmol) and H2O (30 μL) in DMF (1 mL) was stirred at room temperature for 24 h. After reaction, the solvent was evaporated under reduced pressure and the product G23 was obtained as pale solid (11 mg, yield = 60%) by column chromatography. 1H-NMR (400 MHz, CDCl3): δ 2.59 (s, 3H), 3.92 (s, 3H), 4.02 (s, 6H), 4.89 (s, 2H), 7.39 (s, 2H), 7.60 (d, J = 8.5 Hz, 1H), 7.71 (s, 1H), 7.79 (s, 1H), 8.11 (d, J = 8.6 Hz, 1H). HRMS (ESI positive) m/z calcd for C20H21N4O3 (M + 1): 365.1614, found 365.1610.
(6-Methyl-2-(3,4,5-trimethoxyphenyl)quinolin-4-yl)methanamine (G24)
A solution of G23 (30 mg, 0.08 mmol), PPh3 (44 mg, 0.17 mmol) and H2O (200 μL) in THF (3 mL) was stirred at room temperature for 24 h. After reaction, the solvent was evaporated under reduced pressure and the product G24 was obtained as white solid (12 mg, yield = 44%) by column chromatography. 1H-NMR (400 MHz, DMSO-d6): δ 2.53 (s, 3H), 3.75 (s, 3H), 3.93 (s, 6H), 4.26 (s, 2H), 7.56–7.60 (m, 3H), 7.90 (s, 1H), 7.97 (d, J = 8.6 Hz, 1H), 8.14 (s, 1H). HRMS (ESI positive) m/z calcd for C20H23N2O3 (M + 1): 339.1709, found 339.1699.
8-Methoxy-11H-indeno[1,2-b]quinoline-10-carboxylic acid (I1)
A solution of 5-methoxyindoline-2,3-dione (200 mg, 1.14 mmol), 2,3-dihydro-1H-inden-1-one (150 mg, 1.14 mmol) and KOH (191 mg, 3.41 mmol) in EtOH (15 mL) was refluxed at 80 °C for 24 h. Then hydrochloric acid solution was added to adjust pH to 2. Compound I1 was obtained via filtration as brown solid (189 mg, yield = 57%). The synthetic procedure for I2 was similar to that of I1. 1H-NMR (400 MHz, DMSO-d6): δ 3.90 (s, 3H), 4.22 (s, 2H), 7.44 (d, J = 9.2 Hz, 1H), 7.52 (br, 2H), 7.70 (d, J = 6.4 Hz, 1H), 7.90 (s, 1H), 8.13–8.03 (m, 2H). HRMS (ESI positive) m/z calcd for C18H14NO3 (M + 1): 292.0974, found 292.0966.
2,3-Dimethoxy-8-methyl-11H-indeno[1,2-b]quinoline-10-carboxylic acid (I2)
Brown solid (165 mg), yield = 43%. 1H-NMR (400 MHz, DMSO-d6): δ 3.87 (s, 3H), 3.88 (s, 3H), 3.91 (s, 3H), 4.07 (s, 2H), 7.30 (s, 1H), 7.42 (d, J = 9.0 Hz, 1H), 7.55 (s, 1H), 7.86 (s, 1H), 7.99 (d, J = 9.0 Hz, 1H). HRMS (ESI positive) m/z calcd for C20H18NO4 (M + 1): 336.1236, found 336.1229.
(8-Methoxy-11H-indeno[1,2-b]quinolin-10-yl)methanol (J1)
To a solution of I1 (37 mg, 0.127 mmol) and NaBH4 (14.2 mg, 0.375 mmol) in THF (3 mL), BF3·OEt2 (60 μL) was added and the mixture was stirred at 0 °C for 15 min. Then the solution was warmed to room temperature and stirred for additional 16 h. After reaction, NaOH (20 mg, 0.5 mmol) in H2O (2 mL) was added and the mixture was stirred for 3 h. The solvent was evaporated under reduced pressure and product J1 was obtained as yellow solid (11 mg, yield = 31%) by column chromatography. The synthetic procedure for J2 was similar to that of J1. 1H-NMR (400 MHz, DMSO-d6): δ 3.94 (s, 3H), 4.19 (s, 2H), 5.07 (s, 2H), 5.46 (br, 1H), 7.40 (dd, J = 2.8 Hz, 9.0 Hz, 1H), 7.53–7.49 (m, 2H), 7.59 (d, J = 2.8 Hz, 1H), 7.71–7.68 (m, 1H), 8.02 (d, J = 9.1 Hz, 1H), 8.06–8.10 (m, 1H). 13C-NMR (100 MHz, DMSO-d6): 32.88, 55.44, 58.18, 103.49, 120.30, 120.86, 125.71, 126.65, 127.29, 129.54, 130.51, 133.12, 139.90, 140.14, 143.69, 144.69, 156.73, 158.43. HRMS (ESI positive) m/z calcd for C18H16NO2 (M + 1): 278.1181, found 278.1178.
(2,3-Dimethoxy-8-methyl-11H-indeno[1,2-b]quinolin-10-yl)methanol (J2)
Pale solid (12 mg), yield = 29%. 1H-NMR (400 MHz, DMSO-d6): δ 2.53 (s, 3H), 3.88 (s, 3H), 3.91 (s, 3H), 4.06 (s, 3H), 5.03 (s, 2H), 7.31 (s, 1H), 7.51–7.58 (m, 2H), 7.94 (d, J = 8.5 Hz, 1H), 8.01 (s, 1H). HRMS (ESI positive) m/z calcd for C20H20NO3 (M + 1): 322.1443, found 322.1438.
Biological evaluation
In vitro antitumour assay
In vitro antitumour assay was performed using CCK-8 method. A549, HCT116 and MDA-MB-231 cells were used in this assay. Cells were cultured in the 96-well plates with a density of 8 × 10³ cells per well, and incubated in 5% CO2 incubator at 37 °C for 24 h. Then fresh medium containing compounds was added, and the cells were cultured for additional 72 h. After the treatment, 10 μL of CCK-8 was added to the well, and the plate was kept at 37 °C for 1 h. The absorbance (OD) at 450 nm was determined using a SYNERGY|LX multi-mode reader (BioTeK). IC50 values were calculated using the logit method.
Wound healing assay
MDA-MB-231 cells were cultured in six-well plates at a density of 5 × 10⁵ cells per well, and incubated in 5% CO2 incubator at 37 °C for 24 h. A wound was made using a sterile 200 μL pipet tip and washed three times with PBS to remove cell debris. The fresh medium containing compounds was added, and the wound area was captured by the inverted microscope at 0 h and 24 h, and measured by Image J software.
Trans/ invasion assay
The matrigel (Corning) was mixed with serum-free medium at a ratio of 1: 8. Then the mixture (10 μL) was added on the upper surface of the chamber membrane. The plate was kept in 5% CO2 incubator at 37 °C for 2 h. MDA-MB-231 cells (3 × 10⁴) suspended in RPMI-1640 medium containing 1% foetal bovine serum (FBS) and compounds were seeded in the upper chamber. To the lower chamber of the 24-well plate, 800 μL of medium containing 20% FBS was added. After the incubation for 24 h, the cells were fixed with 4% paraformaldehyde, and stained with 0.1% crystal violet. The cells on the upper surface of the membrane was removed using a cotton swab. The invade cells were captured by the inverted microscope, and counted by Image J software.
Endothelial tube formation assay
The matrigel (Corning) was mixed with serum-free medium at the ratio of 1: 1. Then the mixture (10 μL) was added to the 24-well plate, and the plate was kept in 5% CO2 incubator at 37 °C for 1 h. Then HUVECs (5 × 10⁴) suspended in 200 μL ECM medium containing compounds was added to the plate, and cultured at 37 °C for 6 h. The capillary networks were captured by the inverted microscope.
Tubulin polymerisation inhibition assay
This assay was performed according to our previous reportsCitation34. Tubulin protein isolated from pig brain was dissolved in PEM buffer containing 1 mM GTP, 5% glycerol and compounds. Colchicine was used as the positive control. The absorbance of the mixture at 340 nm was recorded at 37 °C using a SPECTRA MAX 190 spectrophotometer. The plateau absorbance values were used for the calculation. This assay was performed twice, and IC50 values were calculated accordingly.
Cell cycle assay
MDA-MB-231 cells were cultured in the six-well plate with a density of 2 × 10⁵ cells per well, and incubated in 5% CO2 incubator at 37 °C for 24 h. Then fresh medium containing compounds was added, and the cells were cultured for additional 24 h. Cells were treated using PI/RNase staining kit (Elabscience) following the manufacturer’s protocol and subjected to flow-cytometric analysis using Beckman Coulter EPICS XL/XL-MCL instrument.
Cell apoptosis assay
MDA-MB-231 cells were cultured in the six-well plate with a density of 2 × 10⁵ cells per well, and incubated in 5% CO2 incubator at 37 °C for 24 h. Then fresh medium containing compounds was added, and the cells were cultured for additional 24 h. Cells were treated with annexin V-FITC/PI apoptosis detection kit (Elabscience) following the manufacturer’s instruction and subjected to flow-cytometric analysis using Beckman Coulter EPICS XL/XL-MCL instrument.
Cellular reactive oxygen species detection assay
MDA-MB-231 cells were cultured in the six-well plate with a density of 2 × 10⁵ cells per well, and incubated in 5% CO2 incubator at 37 °C for 24 h. Then fresh medium containing compounds was added, and the cells were cultured for additional 24 h. Cells were treated with ROS detection kit (Elabscience, E-BC-K138-F) following the manufacturer’s protocol, and subjected to flow-cytometric analysis using Beckman Coulter EPICS XL/XL-MCL instrument.
Mitochondrial membrane potential assay
MDA-MB-231 cells were cultured in the six-well plate with a density of 2 × 10⁵ cells per well, and incubated in 5% CO2 incubator at 37 °C for 24 h. Then the medium was replaced by fresh medium containing compounds, and the cells were cultured for additional 24 h. Mitochondrial membrane depolarisation was determined using JC-1 detection kit (Solarbio, M8650) following the manufacturer’s protocol. The cells were subjected to flow-cytometric analysis using Beckman Coulter EPICS XL/XL-MCL instrument.
Transmission electron microscopy assay
MDA-MB-231 cells were cultured in the six-well plate at a density of 2 × 10⁵ cells per well, and incubated in 5% CO2 incubator at 37 °C for 24 h. Then the medium was replaced by fresh medium containing compounds, and the cells were cultured for additional 48 h. The cells were digested with trypsin, and washed three times by PBS. The cells were fixed by 2.5% glutaraldehyde (500 μL), and submitted for TEM observation (JEM-1400, Japan Tokyo).
Immunofluorescent assay
This assay was performed according to our previous reportCitation34. Briefly, 2 × 10⁵ MDA-MB-231 cells were cultured on glass coverslips in the six-well plate at 37 °C for 24 h. Then compound G13 or 0.1% DMSO were added, and the cells were incubated for additional 24 h. Colchicine was used as the positive control. Anti-α-tubulin antibody (CST, #2125) and Alexa Fluor 594 donkey anti-rabbit IgG (Yeasen, 34212ES60) were used to visualise the microtubules. The nucleus was visualising using DAPI with prolong gold antifade reagent (CST, #8961). The photographs of cells were captured using the Zeiss 810 Confocal microscope.
In vivo antitumour assay
MDA-MB-231 xenograft nude mice model was used to evaluate in vivo antitumour potency of G13. About 3 × 10⁶ MDA-MB-231 cells were subcutaneously inoculated into the right flank of nude mice. About seven days after the implantation, the tumour grew larger than 100 mm3. Then the mice were randomly separated into three groups (n = 4), and administrated with G13 (30 mg/kg) dissolved in 5% DMF/1% Tween-80/94% saline or paclitaxol (10 mg/kg) dissolved in EtOH/Cremophor EL/saline once three days via i.p. injection. The mice in the control group were administrated with 0.9% saline via i.p. injection. The tumour size and body weight of nude mice were recorded once four days. About 16 days after the treatment, the mice were sacrificed and the tumours were excised, weighted and performed H&E and TUNEL staining. The tumour volume was calculated using the following formula: V = a × b2/2, a and b represent the length and the width of tumour, respectively. This assay was conducted under the supervision of the Ethics Committee of the Air Force Medical University.
Molecular docking
Molecular docking was performed according to our previous reportCitation34. The glide docking program with SP precision mode in Schrodinger software was used for the molecular simulation. Briefly, the crystal structure of colchicine in complex with tubulin (PDB code: 4O2B) was downloaded from RCSB. The binding pocket was defined as all the residues within 12 Å around the centroid of colchicine in tubulin. The other parameters were used without any change.
Supplemental Material
Download PDF (1.7 MB)Disclosure statement
The authors report no conflicts of interest.
Additional information
Funding
References
- Wang Q, Arnst KE, Wang Y, Kumar G, Ma D, White SW, Miller DD, Li W, Li W. Structure-guided design, synthesis, and biological evaluation of (2-(1H-indol-3-yl)-1H-imidazol-4-yl)(3,4,5-trimethoxyphenyl) methanone (ABI-231) analogues targeting the colchicine binding site in tubulin. J Med Chem. 2019;62(14):6734–6750.
- Jordan MA, Wilson L. Microtubules as a target for anticancer drugs. Nat Rev Cancer. 2004;4(4):253–265.
- Stanton RA, Gernert KM, Nettles JH, Aneja R. Drugs that target dynamic microtubules: a new molecular perspective. Med Res Rev. 2011;31(3):443–481.
- Downing KH, Nogales E. Tubulin structure: insights into microtubule properties and functions. Curr Opin Struct Biol. 1998;8(6):785–791.
- Hwang DJ, Wang J, Li W, Miller DD. Structural optimization of indole derivatives acting at colchicine binding site as potential anticancer agents. ACS Med Chem Lett. 2015;6(9):993–997.
- Loong HH, Yeo W. Microtubule-targeting agents in oncology and therapeutic potential in hepatocellular carcinoma. Onco Targets Ther. 2014;7:575–585.
- Prota AE, Bargsten K, Diaz JF, Marsh M, Cuevas C, Liniger M, Neuhaus C, Andreu JM, Altmann KH, Steinmetz MO. A new tubulin-binding site and pharmacophore for microtubule-destabilizing anticancer drugs. Proc Natl Acad Sci U S A. 2014;111(38):13817–13821.
- Menchon G, Prota AE, Lucena-Agell D, Bucher P, Jansen R, Irschik H, Muller R, Paterson I, Diaz JF, Altmann KH, et al. A fluorescence anisotropy assay to discover and characterize ligands targeting the maytansine site of tubulin. Nat Commun. 2018;9(1):2106.
- Muhlethaler T, Gioia D, Prota AE, Sharpe ME, Cavalli A, Steinmetz MO. Comprehensive analysis of binding sites in tubulin. Angew Chem Int Ed Engl. 2021;60(24):13331–13342.
- Yang J, Wang Y, Wang T, Jiang J, Botting CH, Liu H, Chen Q, Yang J, Naismith JH, Zhu X, et al. Pironetin reacts covalently with cysteine-316 of alpha-tubulin to destabilize microtubule. Nat Commun. 2016;7:12103.
- Yang J, Yu Y, Li Y, Yan W, Ye H, Niu L, Tang M, Wang Z, Yang Z, Pei H, et al. Cevipabulin-tubulin complex reveals a novel agent binding site on alpha-tubulin with tubulin degradation effect. Sci Adv. 2021;7:eabg4168.
- Matthew S, Chen QY, Ratnayake R, Fermaintt CS, Lucena-Agell D, Bonato F, Prota AE, Lim ST, Wang X, Diaz JF, et al. Gatorbulin-1, a distinct cyclodepsipeptide chemotype, targets a seventh tubulin pharmacological site. Proc Natl Acad Sci U S A. 2021;118:e2021847118.
- Steinmetz MO, Prota AE. Microtubule-targeting agents: strategies to hijack the cytoskeleton. Trends Cell Biol. 2018;28(10):776–792.
- Bouchard H, Viskov C, Garcia-Echeverria C. Antibody–drug conjugates—a new wave of cancer drugs. Bioorg Med Chem Lett. 2014;24(23):5357–5363.
- Kavallaris M. Microtubules and resistance to tubulin-binding agents. Nat Rev Cancer. 2010;10(3):194–204.
- Lu Y, Chen J, Xiao M, Li W, Miller DD. An overview of tubulin inhibitors that interact with the colchicine binding site. Pharm Res. 2012;29(11):2943–2971.
- Gracheva IA, Shchegravina ES, Schmalz HG, Beletskaya IP, Fedorov AY. Colchicine alkaloids and synthetic analogues: current progress and perspectives. J Med Chem. 2020;63(19):10618–10651.
- Kavallaris M, Tait AS, Walsh BJ, He L, Horwitz SB, Norris MD, Haber M. Multiple microtubule alterations are associated with Vinca alkaloid resistance in human leukemia cells. Cancer Res. 2001;61(15):5803–5809.
- Prota AE, Danel F, Bachmann F, Bargsten K, Buey RM, Pohlmann J, Reinelt S, Lane H, Steinmetz MO. The novel microtubule-destabilizing drug BAL27862 binds to the colchicine site of tubulin with distinct effects on microtubule organization. J Mol Biol. 2014;426(8):1848–1860.
- Nerlekar N, Beale A, Harper RW. Colchicine–a short history of an ancient drug. Med J Aust. 2014;201(11):687–688.
- Karamanou M, Tsoucalas G, Pantos K, Androutsos G. Isolating colchicine in 19th century: an old drug revisited. Curr Pharm Des. 2018;24(6):654–658.
- Finkelstein Y, Aks SE, Hutson JR, Juurlink DN, Nguyen P, Dubnov-Raz G, Pollak U, Koren G, Bentur Y. Colchicine poisoning: the dark side of an ancient drug. Clin Toxicol. 2010;48(5):407–414.
- Mulkareddy V, Sokach C, Bucklew E, Bukari A, Sidlak A, Harrold IM, Pizon A, Reis S. Colchicine toxicity: the fatal masquerader. JACC Case Rep. 2020;2(4):678–680.
- Lu Y, Chen J, Wang J, Li CM, Ahn S, Barrett CM, Dalton JT, Li W, Miller DD. Design, synthesis, and biological evaluation of stable colchicine binding site tubulin inhibitors as potential anticancer agents. J Med Chem. 2014;57(17):7355–7366.
- Banerjee S, Arnst KE, Wang YX, Kumar G, Deng SS, Yang L, Li GB, Yang JB, White SW, Li W, et al. Heterocyclic-fused pyrimidines as novel tubulin polymerization inhibitors targeting the colchicine binding site: structural basis and antitumor efficacy. J Med Chem. 2018;61(4):1704–1718.
- Fu D-J, Liu S-M, Li F-H, Yang J-J, Li J. Antiproliferative benzothiazoles incorporating a trimethoxyphenyl scaffold as novel colchicine site tubulin polymerisation inhibitors. J Enzyme Inhib Med Chem. 2020;35(1):1050–1059.
- Wang G, Liu W, Fan M, He M, Li Y, Peng Z. Design, synthesis and biological evaluation of novel thiazole-naphthalene derivatives as potential anticancer agents and tubulin polymerisation inhibitors. J Enzyme Inhib Med Chem. 2021;36(1):1694–1702.
- Chen L, Ji T-Y, Huo X-S, Zeng Z-Y, Ye W-X, Dai C-C, Zhang Y-Q, You W-W, Zhao P-L. Rational design, synthesis and biological evaluation of novel 2-(substituted amino)-[1,2,4]triazolo[1,5-a]pyrimidines as novel tubulin polymerization inhibitors. Eur J Med Chem. 2022;244:114864.
- Huo XS, Jian XE, Ou-Yang J, Chen L, Yang F, Lv DX, You WW, Rao JJ, Zhao PL. Discovery of highly potent tubulin polymerization inhibitors: Design, synthesis, and structure-activity relationships of novel 2,7-diaryl-[1,2,4]triazolo[1,5-a]pyrimidines. Eur J Med Chem. 2021;220:113449.
- Ma W, Chen P, Huo X, Ma Y, Li Y, Diao P, Yang F, Zheng S, Hu M, You W, et al. Development of triazolothiadiazine derivatives as highly potent tubulin polymerization inhibitors: Structure-activity relationship, in vitro and in vivo study. Eur J Med Chem. 2020;208:112847.
- ClinicalTrials.gov Identifier: NCT04844749.
- ClinicalTrials.gov Identifier: NCT05079360.
- Markowski MC, Tutrone R, Pieczonka C, Barnette KG, Getzenberg RH, Rodriguez D, Steiner MS, Saltzstein DR, Eisenberger MA, Antonarakis ES. A phase Ib/II study of sabizabulin, a novel oral cytoskeleton disruptor, in men with metastatic castration-resistant prostate cancer with progression on an androgen receptor-targeting agent. Clin Cancer Res. 2022;28(13):2789–2795.
- Liu W, Jia H, Guan M, Cui M, Lan Z, He Y, Guo Z, Jiang R, Dong G, Wang S. Discovery of novel tubulin inhibitors targeting the colchicine binding site via virtual screening, structural optimization and antitumor evaluation. Bioorg Chem. 2022;118:105486.
- Wang S, Fang K, Dong G, Chen S, Liu N, Miao Z, Yao J, Li J, Zhang W, Sheng C. Scaffold diversity inspired by the natural product evodiamine: discovery of highly potent and multitargeting antitumor agents. J Med Chem. 2015;58(16):6678–6696.
- Kramer N, Walzl A, Unger C, Rosner M, Krupitza G, Hengstschläger M, Dolznig H. In vitro cell migration and invasion assays. Mutat Res. 2013;752(1):10–24.
- Romagnoli R, Baraldi PG, Salvador MK, Prencipe F, Lopez-Cara C, Schiaffino Ortega S, Brancale A, Hamel E, Castagliuolo I, Mitola S, et al. Design, synthesis, in vitro, and in vivo anticancer and antiangiogenic activity of novel 3-arylaminobenzofuran derivatives targeting the colchicine site on tubulin. J Med Chem. 2015;58(7):3209–3222.
- Al-Bahlani S, Al-Dhahli B, Al-Adawi K, Al-Nabhani A, Al-Kindi M. Platinum-based drugs differentially affect the ultrastructure of breast cancer cell types. Biomed Res Int. 2017;2017:3178794.
- Zhang S, Mercado-Uribe I, Liu J. Tumor stroma and differentiated cancer cells can be originated directly from polyploid giant cancer cells induced by paclitaxel. Int J Cancer. 2014;134(3):508–518.
- Zdioruk M, Want A, Mietelska-Porowska A, Laskowska-Kaszub K, Wojsiat J, Klejman A, Użarowska E, Koza P, Olejniczak S, Pikul S, et al. A new inhibitor of tubulin polymerization kills multiple cancer cell types and reveals p21-mediated mechanism determining cell death after mitotic catastrophe. Cancers. 2020;12(8):2161.
- Nakagawa-Goto K, Oda A, Hamel E, Ohkoshi E, Lee K-H, Goto M. Development of a novel class of tubulin inhibitor from desmosdumotin B with a hydroxylated bicyclic B-ring. J Med Chem. 2015;58(5):2378–2389.
- Chen H, Deng S, Albadari N, Yun M-K, Zhang S, Li Y, Ma D, Parke DN, Yang L, Seagroves TN, et al. Design, synthesis, and biological evaluation of stable colchicine-binding site tubulin inhibitors 6-aryl-2-benzoyl-pyridines as potential anticancer agents. J Med Chem. 2021;64(16):12049–12074.
- Gupta S, Kass GE, Szegezdi E, Joseph B. The mitochondrial death pathway: a promising therapeutic target in diseases. J Cell Mol Med. 2009;13(6):1004–1033.