
Abstract
Thioredoxin interacting protein (TXNIP) is a potential drug target for type 2 diabetes mellitus (T2DM) treatment. A series of quinazoline derivatives were designed, synthesised, and evaluated to inhibit TXNIP expression and protect from palmitate (PA)-induced β cell injury. In vitro cell viability assay showed that compounds D-2 and C-1 could effectively protect β cell from PA-induced apoptosis, and subsequent results showed that these two compounds decreased TXNIP expression by accelerating its protein degradation. Mechanistically, compounds D-2 and C-1 reduced intracellular reactive oxygen species (ROS) production and modulated TXNIP-NLRP3 inflammasome signalling, and thus alleviating oxidative stress injury and inflammatory response under PA insult. Besides, these two compounds were predicted to possess better drug-likeness properties using SwissADME. The present study showed that compounds D-2 and C-1, especially compound D-2, were potent pancreatic β cell protective agents to inhibit TXNIP expression and might serve as promising lead candidates for the treatment of T2DM.
Introduction
Diabetes mellitus is a chronic metabolic disease characterised by common outcome, hyperglycaemia, and is a major global problem spiralling out of control. The latest data, according to the International Diabetes Federation (IDF), showed that the number of diagnosed diabetes in adults reached 537 million in 2021 and which is predicted to rise to 643 million by 2030 and 783 million by 2045Citation1. Type 2 diabetes mellitus (T2DM) accounts for more than 90% of all diabetes cases and is the leading cause of diabetes complications such as cardiovascular disease, diabetic nephropathy, diabetic neuropathy and diabetic retinopathyCitation2. Although clinically used anti-diabetic drugs such as biguanides, sulfonylureas, thiazolidinediones and insulin have shown remarkable therapeutic effects, severe hypoglycaemia and weight gain are their undesirable side effects that limited their useCitation3. Thus, developing new drugs for T2DM treatment meets great needs and prospects.
The pathogenesis of T2DM remains enigmatic and relative deficit in insulin secretion from pancreatic β cell emerges as the main culprit. Studies showed that loss of functional pancreatic β cell due to cell apoptosis or death is major event responsible for relative insulin deficiency in T2DMCitation4,Citation5. In this context, drugs preventing β cell failure is critical to revert the development of T2DM. Nowadays, the prevalence of obesity influenced by lifestyle factors is increasing and it is well established that obesity is a vital risk for T2DMCitation6,Citation7. Obesity is associated with elevated circulating free fatty acids (FFAs) which have a clear role in progressive pancreatic β cell dysfunction, impairing the ability of β cell to compensate for the prevailing insulin resistance and thus contributing to T2DM pathogenesisCitation8. Among various saturated fatty acids, palmitic acid has the higher hazard ratio for pancreatic β cell dysfunction or apoptosis, suggesting a potential role for FFAs in diabetes developmentCitation9–11. Exposure of β cell to palmitate (PA) presents critical features of β cell failure in T2DM via inducing cell apoptosis. Therefore, successfully protecting β cell from PA-induced apoptosis may potentially prevent T2DMCitation12.
Thioredoxin-interacting protein (TXNIP), an endogenous negative modulator of thioredoxin (TRX), plays a vital role in maintaining the redox balance in the cellCitation13. TRX is a redox protein with antioxidant effects and the conserved Trp-Cys (32)-Gly-Pro-Cys (35) sequence is the key functional structureCitation14. TXNIP inhibits TRX activity by binding to the two cysteine residues in TRX and induces oxidative stressCitation15. TXNIP is a crucial regulator of glucose homeostasis and plays an essential role in T2DMCitation16,Citation17. Researches showed that TXNIP is highly induced by hyperglycaemia in β cell and TXNIP deficiency exerts an antidiabetic effect via regulating pancreatic β cell functionCitation18,Citation19. Inflammation and oxidative stress are crucial factors in the development of T2DM. Interestingly, previous studies have shown that TXNIP is not only involved in exacerbating oxidative stress but also leads to an increased inflammatory response in an NLRP3 inflammasome-dependent mannerCitation20. FFAs are potent inducers of cytosolic and mitochondrial reactive oxygen species (ROS) production in various cell types, including pancreatic β cell, through different mechanismsCitation21. Excess FFAs increased ROS and result in the dissociation of TXNIP from TRX, then TXNIP bind to NLRP3 and subsequent activation of NLRP3 inflammasomeCitation20,Citation22. PA-induced oxidative stress and inflammation via activating TXNIP, and thus cause β cell dysfunction and apoptosis. Therefore, inhibition of TXNIP could reduce oxidative stress and inflammatory injury of pancreatic β cell in T2DM, especially in the context of FFAs overload.
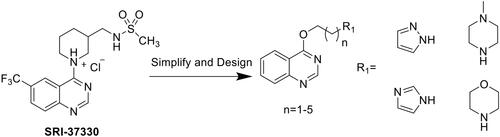
The development of drugs to inhibit TXNIP expression could be an attractive approach for T2DM treatment. Recently, a compound named SRI-37330 was reported to inhibit TXNIPCitation23. SRI-37330 is a quinazoline sulphonamide derivative; in addition to the quinazoline structure, a nitrogen-containing heterocycle is found in the molecule. Based on structural analysis and simplified compounds, we retained the quinazoline ring and nitrogen-containing heterocycle, and aimed to enrich compound libraries that could inhibit TXNIP. Here, 20 compounds were designed by combining unsubstituted quinazoline with different nitrogen-containing heterocycles through carbon chains of different lengths (Scheme 1). Subsequent in vitro pharmacological experiments and in silico physiochemical and pharmacokinetics prediction demonstrated that the compounds D-2 and C-1, especially the compound D-2, had better pancreatic β cell protective activity via inhibition of TXNIP expression and would be promising lead candidates for the treatment of T2DM.
Scheme 1. The design of target compounds.
Materials and methods
Chemistry
All chemicals were purchased from Aladdin Shanghai Biochemical Technology Co., Ltd. (China). Precoated silica gel GF254 (Qingdao Haiyang Chemical Plant, Qingdao, China) plate was used to monitor the reaction progress.
1H and 13C NMR spectra were measured on a Bruker 400 MHz spectrometer at 298 T and referenced to TMS. Chemical shifts were reported in ppm and splitting patterns were marked as s (singlet), d (doublet), t (triplet), m (multiplet).
Mass spectra were obtained on an MS Agilent 1100 Series LC/MSD Trap mass spectrometer (ESI-MS). Silica gel (200–300 mesh; Qingdao Marine Chemical Inc.) was used for column chromatography.
Synthetic intermediates
Dibromoalkanes with different length carbon chains and catalyst K2CO3 (4.17 g, 30.17 mmol) were dissolved in 30 mL DMF, then 4-hydroxyquinazoline (3.00 g, 20.12 mmol) was then dissolved in 10 mL of DMF and added dropwise at room temperature. After 0.5 h, the reaction was complete. The mixture was washed with 50 mL of water three times, and the organic layer was dried with anhydrous Na2SO4 and concentrated under reduced pressure to obtain the reaction product. The product was purified by column chromatography (petroleum ether: acetone = 7:1) to give the compound as a white crystal.
4-(2-Bromoethoxy)quinazoline (A)
White crystal, 58.5% Yield; mp 99–100 °C; 1H-NMR (400 MHz, CDCl3) δ 8.31 (1H, dd, J = 1.2 Hz, 8.0 Hz, H-8), 8.10 (1H, s, H-2), 7.79 (1H, td, J = 1.4 Hz, 7.5 Hz, H-6), 7.74 (1H, d, J = 7.2 Hz, H-5), 7.53 (1H, dt, J = 1.2 Hz, 7.5 Hz, H-7), 4.39 (2H, t, J = 5.8 Hz, OCH2–), 3.78 (2H, t, J = 5.8 Hz, CH2Br); 13C-NMR (100 MHz, CDCl3) δ 161.0, 148.0, 146.6, 134.6, 127.6, 126.7, 121.9, 49.0, 29.6. ESI-MS m/z: 252.9 [M + H]+.
4-(3-Bromopropoxy)quinazoline (B)
White crystal, 61.4% Yield; mp 115–116 °C. 1H-NMR (400 MHz, CDCl3) δ 8.31 (1H, dd, J = 1.0 Hz, 8.0 Hz, H-8), 8.11 (1H, s, H-2), 7.78 (1H, td, J = 1.5 Hz, 7.5 Hz, H-6), 7.72 (1H, dd, J = 0.8 Hz, 8.1 Hz, H-5), 7.52 (1H, td, J = 2.1 Hz, 7.5 Hz, H-7), 4.19 (2H, t, J = 6.7 Hz, OCH2–), 3.45 (2H, t, J = 6.1 Hz, CH2Br), 2.40 (2H, m, –CH2–); 13C-NMR (100 MHz, CDCl3) δ 161.2, 148.1, 146.6, 134.4, 127.6, 127.5, 126.6, 122.0, 45.6, 31.1, 29.9. ESI-MS m/z: 266.9 [M + H]+.
4-(4-Bromobutoxy)quinazoline (C)
White crystal, 65.5% Yield; mp 75–77 °C. 1H-NMR (400 MHz, CDCl3) δ 8.32 (1H, dd, J = 1.2 Hz, 8.0 Hz, H-8), 8.04 (1H, s, H-2), 7.77 (1H, td, J = 1.4 Hz, 7.5 Hz, H-6), 7.72 (1H, d, J = 7.3 Hz, H-5), 7.52 (1H, td, J = 1.3 Hz, 7.6 Hz, H-7), 4.05 (2H, t, J = 6.8 Hz, OCH2–), 3.45 (2H, t, J = 6.3 Hz, CH2Br), 1.97 (4H, t, J = 3.6 Hz, –CH2CH2–); 13C-NMR (100 MHz, CDCl3) δ 161.0, 147.6, 146.5, 134.4, 127.5, 127.2, 126.7, 121.9, 46.1, 32.7, 29.6, 28.1. ESI-MS m/z: 281.0 [M + H]+.
(5-bromopentyl)oxy)quinazoline (D)
White crystal, 52.0% Yield; mp 55–56 °C. 1H-NMR (400 MHz, CDCl3) δ 8.31 (1H, dd, J = 1.1 Hz, 8.0 Hz, H-8), 8.04 (1H, s, H-2), 7.77 (1H, td, J = 1.4 Hz, 7.5 Hz, H-6), 7.71 (1H, d, J = 7.3 Hz, H-5), 7.52 (1H, td, J = 1.2 Hz, 7.5 Hz, H-7), 4.05 (2H, t, J = 6.8 Hz, OCH2–), 3.45 (2H, t, J = 6.3 Hz, CH2Br), 1.89 (6H, m, –CH2CH2CH2–); 13C-NMR (100 MHz, CDCl3) δ 161.1, 148.1, 146.5, 134.2, 127.4, 127.3, 126.7, 122.2, 66.9, 58.7, 53.7, 47.0, 29.3; ESI-MS m/z: 294.9 [M + H]+.
4-((6-Bromohexyl)oxy)quinazoline (E)
White crystal, 48.8% Yield; mp 67–68 °C. 1H-NMR (400 MHz, CDCl3) δ 8.32 (1H, dd, J = 1.0 Hz, 8.0 Hz, H-8), 8.03 (1H, s, H-2), 7.76 (1H, td, J = 1.5 Hz, 7.5 Hz, H-6), 7.71 (1H, dd, J = 0.8 Hz, 8.0 Hz, H-5), 7.52 (1H, td, J = 1.3 Hz, 7.4 Hz, H-7), 4.01 (2H, t, J = 7.3 Hz, OCH2–), 3.40 (2H, t, J = 6.9 Hz, CH2Br), 1.85 (4H, m, –CH2CH2–), 1.47 (4H, m, –CH2CH2–); 13C-NMR (100 MHz, CDCl3) δ 161.0, 147.9, 146.6, 134.2, 127.3, 126.7, 122.1, 46.9, 33.7, 32.5, 29.2, 27.7, 25.8; ESI-MS m/z: 309.1 [M + H]+.
General procedure for preparation of 20 quinazoline derivatives (A-1∼E-4)
Dissolve the intermediate and nitrogen-containing heterocycle in 10 mL of acetonitrile; catalyst K2CO3 or Na2CO3 was added and reacted at 80 °C for 40 h. During the reaction, the GF254 silica gel plate was continuously used for monitoring. Water (30 mL) and ethyl acetate (3 × 30 mL) were added for extraction, and the organic layer was dried over anhydrous Na2SO4 and concentrated under reduced pressure.
4-(2-(1H-pyrazol-1yl)ethoxy) quinazoline (A-1)
White crystal, 84.3% yield; mp 117–119 °C. 1H-NMR (400 MHz, CDCl3) δ 8.15 (1H, d, J = 7.6 Hz, H-8), 8.08 (1H, s, H-2), 7.70 (1H, t, J = 7.6 Hz, H-6), 7.60 (1H, s, H-5), 7.58 (1H, d, J = 5.2 Hz, pyrazole), 7.42 (1H, t, J = 7.6 Hz, H-7), 6.32 (1H, s, pyrazol), 4.14 (2H, t, J = 4.7 Hz, OCH2–), 3.40 (2H, t, J = 4.7 Hz, CH2N–); 13C-NMR (100 MHz, CDCl3) δ 161.4, 147.6, 147.2, 139.7, 134.4, 127.3, 127.0, 126.5, 122.1, 121.7, 105.1, 60.2, 49.8. ESI-MS m/z: 242.1 [M + H]+.
4-(2-(4-Methylpiperazin-1-yl)ethoxy) quinazoline (A-2)
Yellow oil; 81.8% yield; 1H-NMR (400 MHz, CDCl3) δ 8.31 (1H, dd, J = 1.0 Hz, 8.0 Hz, H-8), 8.07 (1H, s, H-2), 7.76 (1H, td, J = 1.4 Hz, 7.5 Hz, H-6), 7.71 (1H, d, J = 7.3 Hz, H-5), 7.50 (1H, td, J = 1.3 Hz, 7.4 Hz, H-7), 4.09 (2H, t, J = 5.9 Hz, OCH2–), 2.72 (2H, t, J = 6.0 Hz, CH2N–), 2.56 (4H, s, NCH2CH2N), 2.44 (4H, s, NCH2CH2N), 2.27 (3H, s, –CH3); 13C-NMR (100 MHz, CDCl3) δ 161.4, 148.2, 147.2, 134.2, 127.4, 127.1, 126.7, 122.1, 56.5, 55.0, 53.2, 46.0, 43.7; ESI-MS m/z: 273.1 [M + H]+.
4-(2-(1H-imidazol-1-yl)ethoxy) quinazoline (A-3)
White crystal, 50.4% yield, mp 140–141 °C. 1H-NMR (400 MHz, CDCl3) δ 8.32 (1H, dd, J = 1.3 Hz, 8.0 Hz, H-8), 7.79 (1H, td, J = 1.4 Hz, 7.6 Hz, H-6), 7.69 (1H, d, J = 8.1 Hz, H-5), 7.55 (1H, t, J = 8.0 Hz, H-7), 7.46 (1H, s, H-8), 7.39 (1H, s, imidazol), 7.09 (1H, s, imidazol), 6.87 (1H, s, imidazol) 4.42 (2H, t, J = 5.5 Hz, OCH2–), 4.3 (2H, t, J = 5.4 Hz, CH2N–); 13C-NMR (100 MHz, CDCl3) δ 161.1, 148.0, 145.5, 137.2, 135.0, 134.8, 130.6, 127.8, 126.6, 121.6, 118.7, 48.5, 44.9; ESI-MS m/z: 241.1 [M + H]+.
(4-(2-(quinazolin-4-yloxy)ethyl)morpholine (A-4)
White crystal, 85.8% yield, mp 74–76 °C. 1H-NMR (400 MHz, CDCl3) δ 8.31 (1H, dd, J = 1.3 Hz, 8.0 Hz, H-8), 8.07 (1H, s, H-2), 7.77 (1H, td, J = 1.4 Hz, 7.5 Hz, H-6), 7.71 (1H, d, J = 7.8 Hz, H-5), 7.51 (1H, td, J = 1.2 Hz, 7.4 Hz, H-7), 4.10 (2H, t, J = 5.9 Hz, OCH2–), 3.68 (4H, t, J = 4.5 Hz, NCH2CH2O), 2.72 (2H, t, J = 6.0 Hz, CH2N–), 2.52 (4H, d, J = 4.5 Hz, NCH2CH2O); 13C-NMR (100 MHz, CDCl3) δ 161.1, 148.1, 147.1, 145.5, 134.2, 127.4, 126.7, 122.0, 66.9, 57.0, 53.7, 43.4; ESI-MS m/z: 260.1 [M + H]+.
4-(3-(1H-pyrazol-1-yl)propoxy) quinazoline (B-1)
Yellow oil, 91.1% yield; 1H-NMR (400 MHz, CDCl3) δ 8.31(1H, td, J = 1.1 Hz, 6.9 Hz, H-8), 8.10 (1H, d, J = 8.1 Hz, H-2), 7.78 (1H, m, H-6), 7.72 (1H, t, J = 5.3 Hz, H-5), 7.63 (1H, d, J = 1.9 Hz, pyrazole), 7.52 (1H, td, J = 1.3 Hz, 7.4 Hz, H-7), 6.27 (1H, t, J = 2.0 Hz, pyrazol), 2.41 (2H, m, OCH2–), 2.04 (2H, m, CH2N–); 13C-NMR (100 MHz, CDCl3) δ 161.3, 148.1, 146.8, 139.7, 134.4, 129.4, 127.5, 126.7, 122.0, 121.8, 105.8, 58.1, 48.7, 32.0; ESI-MS m/z: 255.1 [M + H]+.
4-(3-(4-Methylpiperazin-1-yl)propoxy) quinazoline (B-2)
Yellow oil, 81.8% yeild; 1H-NMR (400 MHz, CDCl3) δ 8.31 (1H, dd, J = 1.0 Hz, 8.0 Hz, H-8), 8.14 (1H, s, H-2), 7.76 (1H, td, J = 1.5 Hz, 7.6 Hz, H-6), 7.71 (1H, dd, J = 0.8 Hz, 8.1 Hz, H-5), 7.51 (1H, td, J = 1.3 Hz, 7.5 Hz, H-7), 4.09 (2H, t, J = 6.6 Hz, OCH2–), 2.44 (4H, s, NCH2CH2N), 2.38 (2H, t, J = 6.6 Hz, CH2N–), 2.27 (3H, s, –CH3), 2.03 (4H, m, NCH2CH2N); 13C-NMR (100 MHz, CDCl3) δ 161.1, 148.1, 147.3, 134.1, 127.3, 127.1, 126.5, 122.1, 55.0, 54.1, 52.6, 45.8, 45.0, 25.1; ESI-MS m/z: 287.1 [M + H]+.
4-(3-(1H-imidazol-1-yl)propoxy) quinazoline (B-3)
Yellow oil, 63.1% yeild; 1H-NMR (400 MHz, CDCl3) δ 8.31(1H, dd, J = 1.4 Hz, 7.4 Hz, H-8), 7.95 (1H, s, H-2), 7.79 (1H, td, J = 1.5 Hz, 7.6 Hz, H-6), 7.72 (1H, d, J = 7.7 Hz, H-5), 7.58 (1H, s, imidazol)), 7.54 (1H, td, J = 1.2 Hz, 7.5 Hz, H-7), 7.12 (1H, s, imidazol), 7.00 (1H, s, imidazol), 4.09 (2H, t, J = 7.0 Hz, OCH2–), 4.01 (2H, t, J = 7.2 Hz, CH2N–), 2.05 (1H, m, –CH2–), 2.26 (1H, t, J = 7.2 Hz, –CH2–); 13C-NMR (100 MHz, CDCl3) δ 161.2, 148.0, 146.8, 146.0, 137.0, 135.1, 129.7, 127.7, 126.6, 121.9, 118.8, 58.0, 44.3, 30.6; ESI-MS m/z: 255.1 [M + H]+.
4-(3-(Quinazolin-4-yloxy)propyl) morpholine (B-4)
Yellow oil, 98.1% yeild; 1H-NMR (400 MHz, CDCl3) δ 8.31 (1H, d, J = 8.0 Hz, H-8), 8.13 (1H, s, H-2), 7.76 (1H, td, J = 2.1 Hz, 6.9 Hz, H-6), 7.70 (1H, d, J = 8.2 Hz, H-5), 7.51 (1H, t, J = 7.7 Hz, H-7), 4.10 (2H, t, J = 6.6 Hz, OCH2–), 3.67 (4H, s, NCH2CH2O), 2.41 (4H, d, J = 2.4 Hz, NCH2CH2O), 2.39 (2H, t, J = 6.5 Hz, CH2N-); 13C-NMR (100 MHz, CDCl3) δ 161.1, 148.0, 147.2, 134.1, 127.3, 127.1, 126.5, 122.0, 66.8, 54.8, 53.5, 45.1, 24.8; ESI-MS m/z: 274.1 [M + H]+.
(4-(4-(1H-pyrazol-1-yl)butoxy) quinazoline (C-1)
White crystal, 82.9% yield; mp 106–108 °C. 1H-NMR (400 MHz, CDCl3) δ 8.31 (1H, td, J = 1.2 Hz, 7.9 Hz, H-8), 8.04 (1H, s, H-2), 7.77 (1H, td, J = 1.5 Hz, 7.5 Hz, H-6), 7.71 (1H, dd, J = 0.6 Hz, 8.0 Hz, H-5), 7.51 (1H, t, J = 1.3 Hz, 7.4 Hz, H-7), 6.27 (1H, t, J = 2.0 Hz, pyrazol), 4.03 (2H, t, J = 7.3 Hz, OCH2–), 2.04 (2H, m, CH2N–), 1.25 (4H, t, J = 3.6 Hz, –CH2CH2–); 13C-NMR (100 MHz, CDCl3) δ 161.2, 147.9, 146.4, 139.5, 134.3, 129.3, 127.5, 127.3, 126.6, 122.1, 105.4, 51.3, 46.1, 27.4, 26.5; ESI-MS m/z: 269.1 [M + H]+.
4-(4-(4-Methylpiperazin-1-yl)butoxy) quinazoline (C-2)
Yellow oil, 61.1% yeild; 1H-NMR (400 MHz, CDCl3) δ 8.31 (1H, dd, J = 1.0 Hz, 7.9 Hz, H-8), 8.04 (1H, s, H-2), 7.76 (1H, td, J = 1.5 Hz, 7.5 Hz, H-6), 7.71 (1H, dd, J = 0.8 Hz, 7.6 Hz, H-5), 7.51 (1H, td, J = 1.3 Hz, 7.4 Hz, H-7), 4.03 (2H, t, J = 7.3 Hz, OCH2–), 2.45 (4H, s, NCH2CH2N), 2.39 (2H, t, J = 7.4 Hz, CH2N–), 2.28 (3H, s, –CH3), 1.83 (2H, m, –CH2CH2–), 1.58 (2H, m, –CH2CH2–), 1.25 (4H, s, NCH2CH2N); 13C-NMR (100 MHz, CDCl3) δ 161.1, 148.1, 147.3, 134.1, 127.3, 127.1, 126.5, 122.1, 55.0, 54.1, 52.6, 45.8, 45.0, 27.1, 25.1; ESI-MS m/z: 301.1 [M + H]+.
4-(4-(1H-imidazol-1-yl)butoxy) quinazoline (C-3)
Yellow oil, 57.2% yeild; 1H-NMR (400 MHz, CDCl3) δ 8.30 (1H, dd, J = 0.8 Hz, 8.0 Hz, H-8), 8.00 (1H, s, H-2), 7.78 (1H, td, J = 1.4 Hz, 7.6 Hz, H-6), 7.72 (1H, d, J = 8.0 Hz, H-5), 7.69 (1H, s, imidazol), 7.53 (1H, t, J = 7.0 Hz, H-7), 7.50 (1H, s, imidazol), 7.10 (2H, s, CH2N–), 6.92 (1H, s, imidazol), 4.02 (2H, t, J = 7.0 Hz, OCH2–), 1.84 (4H, m, –CH2CH2–); 13C-NMR (100 MHz, CDCl3) δ 161.2, 148.0, 146.2, 137.0, 135.2, 134.3, 129.5, 127.5, 126.6, 121.9, 118.9, 46.4, 46.0, 29.7, 28.1; ESI-MS m/z: 269.1 [M + H]+.
(4-(4-(quinazolin-4-yloxy)butyl)morpholine (C-4)
White crystal, 85.8% yield; mp 81–82 °C. 1H-NMR (400 MHz, CDCl3) δ 8.31 (1H, dd, J = 1.0 Hz, 8.0 Hz, H-8), 8.04 (1H, s, H-2), 7.76 (1H, td, J = 1.5 Hz, 7.8 Hz, H-6), 7.71 (1H, d, J = 7.7 Hz, H-5), 7.51 (1H, td, J = 1.3 Hz, 7.2 Hz, H-7), 4.04 (2H, t, J = 6.6 Hz, OCH2–), 3.70 (4H, t, J = 4.6 Hz, NCH2CH2O), 2.42 (4H, t, NCH2CH2O), 2.38 (2H, t, J = 7.4 Hz, CH2N–), 1.85 (2H, m, –CH2–), 1.58 (2H, m, –CH2–); 13C-NMR (100 MHz, CDCl3) δ 161.1, 148.1, 146.5, 137.1, 134.2, 127.5, 126.7, 122.1, 66.9, 58.3, 53.7, 46.8, 27.4, 23.6; ESI-MS m/z: 288.1 [M + H]+.
4-((5-(1H-pyrazol-1-yl) pentyl)oxy) quinazoline (D-1)
White crystal, 83.1% yield; mp 93–94 °C. 1H-NMR (400 MHz, CDCl3) δ 8.31 (1H, d, J = 8.0 Hz, H-8), 7.99 (1H, s, H-2), 7.76 (1H, td, J = 1.2 Hz, 7.6 Hz, H-6), 7.71 (1H, d, J = 7.8 Hz, H-5), 7.52 (1H, t, J = 7.9 Hz, H-7),7.49 (1H, s, pyrazol), 7.34 (1H, dd, J = 2.1 Hz, 8.4 Hz, pyrazol), 6.21 (1H, t, J = 2.1 Hz, pyrazol), 3.97 (2H, t, J = 7.3 Hz, OCH2–), 4.03 (2H, t, J = 7.3 Hz, OCH2–), 2.04 (2H, m, CH2N–), 1.82 (2H, m, –CH2–), 1.37 (2H, m, –CH2–), 1.26 (2H, m, –CH2–); 13C-NMR (100 MHz, CDCl3) δ 161.0, 147.8, 146.6, 134.3, 127.4, 127.3, 126.7, 122.1, 46.9, 33.3, 32.1, 28.5, 25.2; ESI-MS m/z: 283.1 [M + H]+.
4-((5-(4-Methylpiperazin-1-yl) pentyl)oxy)quinazoline (D-2)
White crystal, 86.1% yield; mp 85–86 °C. 1H-NMR (400 MHz, CDCl3) δ 8.31 (1H, d, J = 8.0 Hz, H-8), 8.03 (1H, s, H-2), 7.76 (1H, td, J = 1.2 Hz, 7.5 Hz, H-6), 7.71 (1H, d, J = 8.1 Hz, H-5), 7.51 (1H, t, J = 6.9 Hz, H-7), 4.00 (2H, t, J = 7.4 Hz, OCH2–), 2.46 (4H, s, NCH2CH2N), 2.34 (2H, t, J = 7.6 Hz, CH2N–), 2.28 (3H, s, –CH3), 1.82 (2H, m, –CH2–), 1.56 (2H, m, –CH2–), 1.40 (2H, m, –CH2–); 13C-NMR (100 MHz, CDCl3) δ 161.1, 148.1, 146.5, 139.3, 129.0, 127.4, 127.3, 126.7, 122.1, 105.3, 58.2, 55.6, 51.8, 51.7, 46.8, 29.9, 28.8, 23.7; ESI-MS m/z: 315.1 [M + H]+.
4-((5-(1H-imidazol-1-yl)pentyl)oxy) quinazoline (D-3)
Yellow oil, 46.6% yeild; 1H-NMR (400 MHz, CDCl3) δ 8.31 (1H, dd, J = 1.2 Hz, 8.0 Hz, H-8), 8.00 (1H, s, H-2), 7.77 (1H, td, J = 1.5 Hz, 7.5 Hz, H-6), 7.72 (1H, s, imidazol), 7.71 (1H, d, J = 2.9 Hz, H-5), 7.52 (1H, td, J = 1.2 Hz, 7.0 Hz, H-7), 7.50 (1H, s, imidazol), 6.92 (1H, s, imidazol), 3.97 (2H, m, OCH2–), 1.85 (4H, m, –CH2CH2–), 1.39 (2H, m, –CH2–); 13C-NMR (100 MHz, CDCl3) δ 161.1, 148.1, 146.5, 139.3, 129.0, 127.4, 126.7, 121.9, 122.1, 118.7, 105.3, 53.1, 47.0, 29.3, 26.4, 24.6; ESI-MS m/z: 283.1 [M + H]+.
4-(5-(Quinazolin-4-yloxy)pentyl) morpholine (D-4)
White crystal, 65.4% yield; mp 81–82 °C. 1H-NMR (400 MHz, CDCl3) δ 8.31 (1H, dd, J = 1.0 Hz, 8.0 Hz, H-8), 8.03 (1H, s, H-2), 7.76 (1H, td, J = 1.5 Hz, 7.5 Hz, H-6), 7.71 (1H, d, J = 7.4 Hz, H-5), 7.51 (1H, td, J = 1.2 Hz, 7.5 Hz, H-7), 4.01 (2H, t, J = 7.3 Hz, OCH2–), 3.70 (4H, t, J = 4.6 Hz, NCH2CH2O), 2.41 (4H, t, J = 4.6 Hz, NCH2CH2O), 2.33 (2H, t, J = 7.4 Hz, CH2N–), 1.83 (2H, m, –CH2–), 1.55 (2H, m, –CH2–), 1.42 (2H, m, –CH2–); 13C-NMR (400 MHz, CDCl3) δ 161.2, 148.1, 146.3, 137.0, 134.3, 129.4, 127.5, 126.7, 122.0, 66.7, 54.8, 46.7, 46.3, 30.6, 28.8, 23.6. ESI-MS m/z: 302.2 [M + H]+.
4-((6-(1H-pyrazol-1-yl)hexyl)oxy) quinazoline (E-1)
White crystal, 47.7% yield; mp 63–64 °C. 1H-NMR (400 MHz, CDCl3) δ 8.31 (1H, dd, J = 1.08 Hz,8.0 Hz, H-8), 8.00 (1H, s, H-2), 7.76 (1H, td, J = 1.4 Hz, 7.5 Hz, H-6), 7.71 (1H, d, J = 7.3 Hz, H-5), 7.5 (1H, td, J = 1.2 Hz, 7.5 Hz, H-7), 7.48 (1H, d, J = 1.5 Hz, pyrazol), 7.35 (1H, d, J = 2.0 Hz, pyrazol) 6.22 (1H, t, J = 2.0 Hz, pyrazol), 4.12 (2H, t, J = 7.0 Hz, OCH2–), 3.97 (2H, t, J = 7.3 Hz,CH2N–), 4.03 (2H, t, J = 7.3 Hz, OCH2–), 1.89 (2H, m, –CH2–), 1.87 (2H, m, –CH2–), 1.37 (4H, m, –CH2CH2–); 13C-NMR (100 MHz, CDCl3) δ 161.0, 148.1, 146.5, 139.1, 134.2, 128.9, 127.4, 127.2, 126.6, 122.1, 105.3, 51.9, 46.8, 30.2, 29.2, 26.1; ESI-MS m/z: 297.1 [M + H]+.
4-((6-(4-Methylpiperazin-1-yl) hexyl)oxy)quinazoline (E-2)
White crystal, 72.0% yield; mp 47–48 °C. 1H-NMR (400 MHz, CDCl3) δ 8.31 (1H, d, J = 8.0 Hz, H-8), 8.03 (1H, s, H-2), 7.76 (1H, td, J = 1.5 Hz, 7.5 Hz, H-6), 7.71 (1H, d, J = 7.7 Hz, H-5), 7.51 (1H, t, J = 8.1 Hz, H-7), 4.00 (2H, t, J = 7.3 Hz, OCH2–), 2.4 (4H, s, NCH2CH2N), 2.34 (2H,d, J = 4.4 Hz, CH2N–), 2.28 (3H, s, –CH3), 1.81 (2H, m, –CH2–), 1.50 (2H, m, –CH2–), 1.38 (4H, m, –CH2CH2–); 13C-NMR (100 MHz, CDCl3) δ 161.1, 148.1, 146.6, 134.2, 127.4, 127.2, 126.7, 122.1, 105.3, 55.0, 54.1, 52.6, 51.9, 46.8, 30.2, 29.2, 26.1, 25.1; ESI-MS m/z: 329.2 [M + H]+.
4-((6-(1H-imidazol-1-yl)hexyl)oxy) quinazoline (E-3)
Yellow oil, 48.1% yeild; 1H-NMR (400 MHz, CDCl3) δ 8.31 (1H, dd, J = 1.1 Hz, 8.0 Hz, H-8), 8.01 (1H, s, H-2), 7.77 (1H, td, J = 1.5 Hz, 7.5 Hz, H-6), 7.71 (1H, d, J = 7.2 Hz, H-5), 7.52 (1H, td, J = 1.2 Hz, 7.5 Hz, H-7), 7.46 (1H, s, imidazol), 7.04 (1H, s, imidazol), 6.89 (1H, s, imidazol), 3.99 (2H, t, J = 7.3 Hz, –CH2N), 3.99 (2H, t, J = 7.0 Hz, OCH2–), 1.79 (4H, m, –CH2CH2–), 1.38 (4H, m, –CH2CH2–); 13C-NMR (100 MHz, CDCl3) δ 161.1, 148.1, 146.6, 137.0, 135.2, 134.2, 127.4, 127.3, 126.7, 122.2, 118.9, 66.9, 58.9, 53.7, 47.0, 29.3, 27.0, 26.6, 26.3; ESI-MS m/z: 297.2 [M + H]+.
4-(6-(Quinazolin-4-yl)oxy)hexyl) morpholine (E-4)
White crystal, 97.8% yield; mp 56–58 °C. 1H-NMR (400 MHz, CDCl3) δ 8.31 (1H, dd, J = 1.1 Hz, 8.1 Hz, H-8), 8.03 (1H, s, H-2), 7.76 (1H, td, J = 1.5 Hz, 7.5 Hz, H-6), 7.71 (1H, d, J = 7.7 Hz, H-5), 7.51 (1H, td, J = 1.3 Hz, 7.5 Hz, H-7), 4.00 (2H, t, J = 7.3 Hz, OCH2–), 3.70 (4H, t, J = 4.5 Hz, NCH2CH2O), 2.42 (4H, s, NCH2CH2O), 2.31 (2H, t, J = 7.8 Hz, CH2N–), 1.81 (2H, m, –CH2–), 1.50 (2H, m, –CH2–), 1.39 (4H, m, –CH2CH2–); 13C-NMR (100 MHz, CDCl3) δ 161.1, 148.0, 146.5, 137.0, 134.3, 129.2, 127.4, 122.1, 66.8, 63.2, 53.1, 46.9, 46.8, 30.8, 29.2, 26.1; ESI-MS m/z: 316.2 [M + H]+.
Biological activity assay
Materials
Palmitate (PA) was from Solarbio science & technology Co., Ltd. (Beijing, China) and dissolved in ethanol, and then diluted with 50 mmol/L NaOH to prepare the stock solution. The stock solution was further diluted with DMEM containing 0.55% FFA-free BSA (Solarbio, Beijing, China) at the ratio of 1:100 before use. Cycloheximide and MG-132 were from MedChem Express (Shanghai, China).
Cell cultures
Min6 mouse pancreatic β cell were obtained from the ATCC cell bank. The cells were cultured in Dulbecco’s modified Eagle’s medium (DMEM, HyClone, USA) supplemented with 10% foetal bovine serum (FBS, Gibico, USA) and 1% Penicillin-Streptomycin Liquid (Solarbio, Beijing, China). Cell cultures were incubated in a humidified incubator containing 5% CO2 at 37 °C.
Cell counting kit-8 (CCK-8) assay
CCK-8 assay was performed to determine the cell viability under PA treatment and the protective activity of the tested compounds in PA-treated Min6 cells. In brief, Min6 cells were seeded in 96-well plates and cultured in DMEM overnight. Min6 cells were treated with tested compounds at indicated concentration and PA (300 μmol/L) for 24 h. After washing cells with PBS, fresh DMEM and CCK-8 reagents (Meilunbio, Dalian, China) were added and cells were incubated for 2 h in a 37 °C-incubator containing 5% CO2. Absorbance at 450 nm was read on a microplate reader (Molecular Devices, SpectraMax 190, USA).
RNA isolation and quantitative real-time PCR
Min6 cells were cultured into six-well plates with overnight culture. The cells were incubated with 10 μmol/L tested compounds and 300 μmol/L PA for 24 h. After washing with PBS, cells were lysed with TRIzol Reagent (Takara, Japan) to obtain total mRNA. cDNA was synthesised using PrimeScript RT Master Mix (TaKaRa, Japan) according to the manufacturer’ instructions. The quantity of IL-1β and IL-6 mRNA was detected by quantitative real-time PCR (qRT-PCR) using the TB Green Premix Ex Taq (TaKaRa, Japan). The relative values of mRNA were normalised with the levels of β-actin mRNA. The primers used were shown in .
Table 1. Primer sequences for real-time PCR assays.
Western blot assay
Min6 cells were plated in six-well dishes with overnight culture and then incubated with 10 μmol/L tested compounds and 300 μmol/L PA for 12 h. Total proteins of cells were lysed with RIPA lysis buffer (Boster, China) and the protein lysis was separated by SDS-PAGE and transferred from gel to PVDF membrane (Millipore, USA). Then, the membranes were blocked, stained overnight with corresponding primary antibodies and then with second antibody for 1 h. The signals of detected proteins were measured by Chemidoc Imaging System (BIO-RAD, USA). The antibody used were as follows: TXNIP (Abcam, ab188865), NLRP3 (Wanlei, Wuhan, China; WL02635), Cleaved caspase 1 (Wanlei, Wuhan, China; WL03450), Cleaved caspase 3 (CST, #9664s), GAPDH (Bioworld, Nanjing, China; AP0063).
Measurement of intracellular reactive oxygen species
Min6 cells were seeded in six-well plates with overnight culture and then incubated with 10 μmol/L tested compounds and 300 μmol/L PA for 8 h. After treatment, cells were cultured with 10 μmol/L DCFH-DA (Meilun Reactive Oxygen Species Assay Kit, China) at 37 °C for 20 min in a humidified atmosphere containing 5% CO2. Intracellular ROS levels were visualised using a fluorescence microscope (Olympus IX73, Japan).
Statistical analysis
All data were expressed as the mean ± standard deviation (SD). Statistical analysis was performed using the GraphPad Prism software, version 8.0 (GraphPad Software Inc., San Diego, CA, USA). A one-way analysis of variance (ANOVA) followed by Tukey’s post hoc test was used to evaluate the statistical significance, and P < 0.05 was considered statistically significant.
In silico ADME prediction
Pharmacokinetics (ADME) prediction and drug-likeness properties of the active compounds were analysed using SwissADME, a free available service tool online (http://www.swissadme.ch/).
Results and discussion
Chemistry
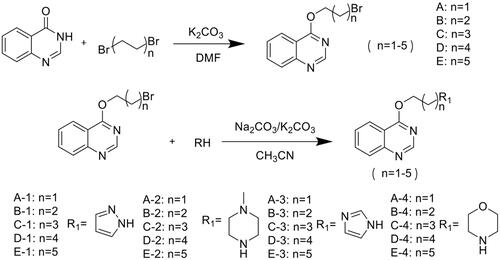
The quinazoline derivatives with nitrogen-containing heterocycle contacted by carbon chains of different lengths were synthesised by a two-step reaction (Scheme 2). The first elimination reaction is the removal of H-3 from 4-hydroxyquinazoline in an alkaline environment, which occurs tautomerization, and an oxygen anion is generated. The electron cloud of C-Br is biased towards the bromine atom, which makes α-C have certain electropositivity. Since the bromine atom is an excellent leaving group, the bromine atom is removed to form a C-O bond under the attack of oxygen anion. The second elimination reaction is that the N-H bond in the nitrogen heterocycle has certain acidity. In an alkaline environment, the N-H bond is broken and the N atom is electronegative. The N atom attacks the C-Br bond, causing the bromine atom to leave, forming a new C-N bond.
Scheme 2. The synthetic route of quinazoline containing nitrogenous heterocyclic derivatives.
Chromatography technology was used to purified the 20 compounds which contain different nitrogen-containing heterocycles. Their structures are shown in . The analytical and spectroscopic data of all compounds were shown as details in the experimental section.
Table 2. The structure of 20 quinazoline derivatives.
Protective activity of all compounds in PA-induced Min6 β cell apoptosis
To investigate the potential protective effect of the target compounds against β cell damage. The anti-apoptosis activity was evaluated in PA-treated Min6 β cell using a CCK-8 assay kit. As shown in , the cell viability of Min6 β cell treated with PA decreased to 38.3%. However, most of the target compounds, except for A-3, A-4, B-4, and E-1∼E-3, exhibited increased cell viability at a concentration of 100 μmol/L compared to PA treatment. The structure-activity relationship analysis showed that the target compounds could significantly protect β cell when n = 3 or 4, and there was no apparent protective activity when n = 5 except that R1 was a morpholine ring. Cytoprotective effects were also observed in compounds when the alkane chain lengths were 1 or 2 except that R1 was an imidazole ring or a morpholine ring. We found that compound D-2 showed significant anti-apoptosis activity with 87.2% cell viability, and followed by the compound C-1, 71.5%. So, we chose compounds D-2 and C-1 for the subsequent examinations. Different concentrations of compounds D-2 and C-1 were added in PA-treated β cell and the results showed that compounds D-2 and C-1, even the concentration of 10 μmol/L, could protect PA-induced β cell injury significantly, demonstrating their potential protective effect against β cell damage (). Therefore, compounds D-2 and C-1 at concentration of 10 μmol/L were used as representative compounds to investigate their protection against PA-induced islet β cell injury.
Figure 1. The anti-apoptosis activity with different concentrations of compounds D-2 and C-1. Min6 β cells were incubated with different concentrations of D-2 and C-1 and then exposed to PA (300 μmol/L) for 24 h. **p < 0.01 vs control cells; #p < 0.05, ##p < 0.01 vs PA-treated cells. Data were presented as mean ± SD (n = 5).
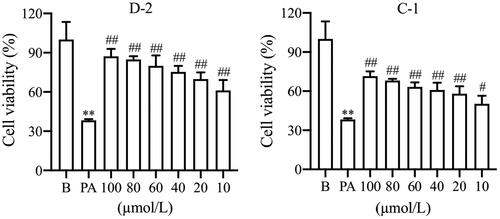
Table 3. The anti-apoptosis activity of quinazoline derivatives at a concentration of 100 μmol/L.
Compounds D-2 and C-1 inhibited TXNIP expression via promoting protein degradation
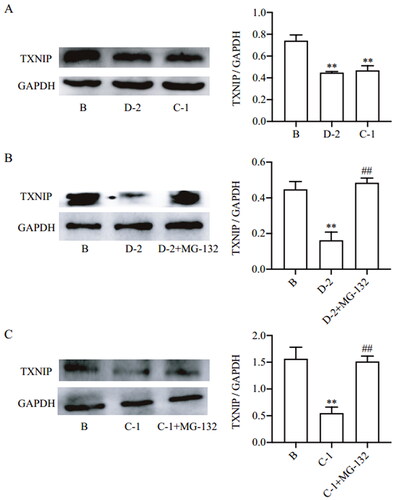
Then, the inhibitory effect of compounds D-2 and C-1 on TXNIP expression were examined. In physiological conditions, compounds D-2 and C-1 could inhibit TXNIP protein expression in Min6 β cell (). In fact, protein expression levels depend on the amount of mRNA for synthesis or the rate of ubiquitination for degradation, the balance between irreversible processes synthesis and degradationCitation24. To confirm the underline mechanism by which these two compounds inhibit TXNIP protein expression. Cycloheximide was added in Min6 β cells to inhibit protein synthesis, and compounds D-2 and C-1 could decrease TXNIP protein expression, while these actions were abrogated by proteasome inhibitor MG-132. Based on the design concept of TXNIP inhibition, the results indicated that compounds D-2 and C-1 inhibited TXNIP protein expression via promoting protein degradation ().
Figure 2. Compounds D-2 and C-1 inhibited TXNIP expression via promoting protein degradation. (A) Min6 β cells were incubated with D-2 and C-1 at concentration of 10 μmol/L for 24 h. (B) Min6 β cells were incubated with cycloheximide (50 μmol/L) and D-2 (10 μmol/L) with or without addition of MG-132 (10 μmol/L) for 24 h. (C) Min6 islet β cells were incubated with cycloheximide (50 μmol/L) and C-1 (10 μmol/L) with or without addition of MG-132 (10 μmol/L) for 24 h. Protein expression of TXNIP was measured by Western blot. **p < 0.01 vs control cells; ##p < 0.01 vs indicated cells. Data were presented as mean ± SD (n = 4).
Cellular mechanism of action by compounds D-2 and C-1
Next, the underline mechanism by which TXNIP inhibition by compounds D-2 and C-1 could protect Min6 β cells from PA insult. Given that inhibition of TXNIP could reduce oxidative stress and inflammatory injury of pancreatic β cell in T2DMCitation20,Citation22, effects of compound D-2 and C-1 on ROS production and inflammatory signalling in the context of PA insults were assayed.
Compound D-2 and C-1 reduced intracellular ROS generation in PA-induced Min6 cells
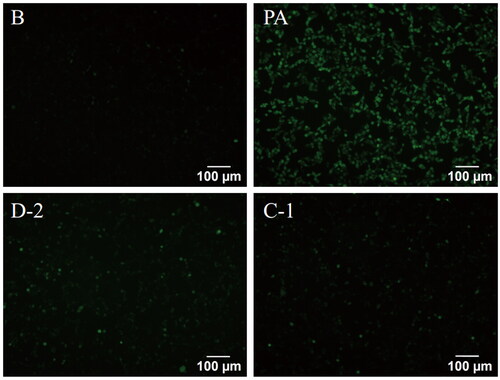
Reactive oxygen species (ROS) are essential signalling molecules that regulate physiological cell functionsCitation25. However, overproduction of ROS by excess FFAs results in oxidative stress and cell deathCitation26,Citation27. ROS can not only directly damage cells or tissues but also indirectly activate a series of damage-related signalling pathways. Given that peroxisomal FFAs β-oxidation generates H2O2 and β cell lack the H2O2-inactivating enzyme catalase in peroxisomes, β cell are highly susceptible to oxidative stress compared to other cell typesCitation28. Hence, intracellular ROS generation was detected by fluorescence assay. The result showed that PA treatment obviously increased intracellular ROS production, while compounds D-2 and C-1 could inhibit ROS generation and significantly reduce intracellular ROS levels, and thus protecting β cell from PA-induced oxidative stress damage ().
Figure 3. Compounds D-2 and C-1 reduced ROS generation in PA-induced Min6 cells. Min6 β cell were incubated with D-2 and C-1 at concentration of 10 μmol/L and then exposed to PA (300 μmol/L) for 8 h. Immunofluorescence staining for ROS was photographed by fluorescence microscopy. Bar: 100 μm.
Compounds D-2 and C-1 protected Min6 cells from PA-induced inflammatory injury via TXNIP-NLRP3 signalling
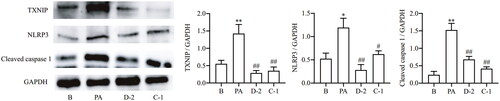
As a critical factor in cellular redox balance, TXNIP is a bridge between oxidative stress and inflammatory injury via interaction with NLRP3 inflammasomeCitation20,Citation29. The NLRP3 inflammasome is composed of NLRP3, recruitment domain (ASC), and pro-caspase-1, and its activation cleaves pro-caspase-1 into its active forms and leads to IL-1β maturation and releaseCitation30,Citation31. This cascade triggers sustained inflammation, which has been implicated in metabolic syndrome and diabetesCitation32. As shown in , TXNIP, NLRP3 and cleaved caspase 1 protein expressions were significantly induced in Min6 β cell exposure to PA. However, these alterations were reversed by culturing with compounds D-2 and C-1, demonstrating that compounds D-2 and C-1 could protect Min6 cells from PA-induced inflammatory injury via inhibiting TXNIP-NLRP3 signalling.
Figure 4. Compounds D-2 and C-1 protected Min6 cells from PA-induced inflammatory injury via TXNIP-NLRP3 signalling. Min6 β cell were incubated with D-2 and C-1 at concentration of 10 μmol/L and then exposed to PA (300 μmol/L) for 12 h. Protein expressions of TXNIP, NLRP3 and cleaved caspase 1 were measured by Western blot. *p < 0.05 & **p < 0.01 vs control cells; #p < 0.05 & ##p < 0.01 vs PA-treated cells. Data were presented as mean ± SD (n = 4).
Compounds D-2 and C-1 inhibited gene expressions of inflammatory cytokines
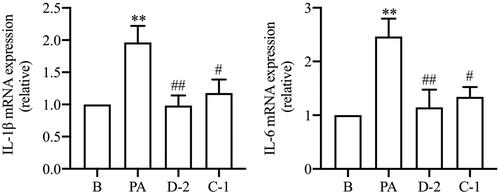
Saturated FFAs can trigger inflammatory pathways in β cell via direct activation or secondarily to oxidative and ER stressCitation33. PA induces NLRP3 inflammasome activation, and the expression/maturation of cytokines, such as IL-1β and IL-6 could potentially induce β cell dysfunction or apoptosis and has been implicated in the pathogenesis of T2DMCitation34. As shown in , PA treatment significantly increased IL-1β and IL-6 gene expressions in Min6 cells. Compounds D-2 and C-1 decreased IL-1β and IL-6 gene expressions in Min6 cells exposed to PA, showing their anti-inflammatory activity. Macrophage levels are elevated in the pancreatic islets of T2DM and macrophages drive β cell failure and apoptosis, resulting in chronic low-grade inflammation in the pancreatic isletsCitation35.
Figure 5. Compounds D-2 and C-1 inhibited gene expression of inflammatory cytokines. Min6 β cell were incubated with D-2 and C-1 at concentration of 10 μmol/L and then treated with PA (300 μmol/L) for 24 h. Gene expressions of IL-1β and IL-6 were detected using the RT-PCR method. **p < 0.01 vs control cells; #p < 0.05 & ##p < 0.01 vs PA-treated cells. Data were presented as mean ± SD (n = 5).
Compounds D-2 and C-1 inhibited caspase 3 activation
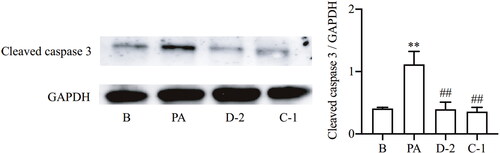
Oxidative stress and inflammation are major cause for β cell apoptosis. Cysteinyl aspartate specific proteinase (caspase) family has been proven to be involved in β cell apoptosis. Compared with other members of the caspase family, caspase 3 is at the end of the caspase cascade and exists as the terminal executor of cell apoptosisCitation36. Caspase-3 is an inactive proenzyme that can be cleaved by initiator caspases to induce the activation of caspase-3 during apoptotic signalling. Therefore, the protein expression of cleaved caspase 3 was measured by Western blot to evaluate the protective effect of compounds D-2 and C-1 in β cell when exposed to PA. The results showed that PA treatment significantly increased cleaved caspase 3 expression, while compounds D-2 and C-1 inhibited caspase 3 activation in PA-treated Min6 β cell, demonstrating that compound D-2 and C-1 could inhibit PA-induced β cell apoptosis ().
Figure 6. Compounds D-2 and C-1 inhibited caspase 3 activation. Min6 β cells were incubated with D-2 and C-1 at concentration of 10 μmol/L and then exposed to PA (300 μmol/L) for 12 h. Protein expression of cleaved caspase 3 was measured by Western blot. **p < 0.01 vs control cells; ##p < 0.01 vs PA-treated cells. Data were presented as mean ± SD (n = 4).
In silico drug-likeness and ADME predictions of compounds D-2 and C-1
Given that efficacy and safety are vital aspects for a potential drug molecule in the process of drug development, we predicted physicochemical and pharmacokinetic parameters of the compounds D-2 and C-1 with a free online available website SwissADMECitation37. The predicted physicochemical properties of the compounds D-2 and C-1 were depicted in the bioavailability radar plot (). Bioavailability radar plot represents six physicochemical properties (See 1–6 in ) to reflect oral bioavailability, and is displayed for a rapid appraisal of drug-likenessCitation37. Compounds with radar plot (red line) entirely fallen into the pink area are considered optimal drug-likeness. According to the , compound D-2 and C-1, particularly the compound D-2, process comparable drug-likeness.
Figure 7. Bioavailability radar plot of compounds D-2 and C-1.
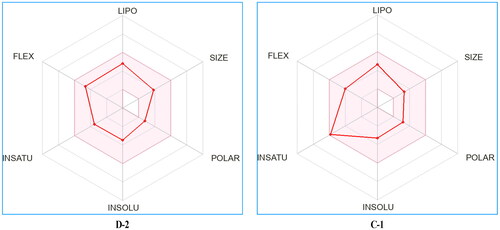
Table 4. Physicochemical and pharmacokinetic parameters of compounds D-2 and C-1 predicted with SwissADME online tool.
The predicted pharmacokinetic parameters showed that compound D-2 and C-1 were highly permeable to gastrointestinal (GI) membranes and could pass through the blood-brain barrier (BBB) (See 9–10 in ). Besides, other pharmacokinetic properties such as substrate or non-substrate of the permeability glycoprotein (P-gp), whether interaction with the five major cytochromes P450 (CYP) isoforms, and skin permeation were also predicted by SwissADME (). In addition, compound D-2 and C-1 satisfy the five drug-likeness rules and showed medicinal chemistry leadlikeness ().
Conclusions
In summary, a series of quinazoline derivatives were designed, synthesised, and evaluated to inhibit TXNIP expression and protect PA-induced β cell injury for T2DM treatment. Most of these compounds could protect β cell from PA insult and compound D-2, as star molecule, along with compound C-1 could effectively promote β cell survival and the viability of β cell reached 61.1% and 50.3% at concentration of 10 μmol/L, respectively, compared to the β cell injury model 38.3%. Subsequent results showed that compounds D-2 and C-1 inhibited TXNIP expression by promoting its protein degradation. Besides, the cellular mechanism of action studies demonstrated that compounds D-2 and C-1 could reduce the production of ROS and inhibit the TXNIP-NLRP3 inflammasome signalling pathway under PA stimulation, and thus alleviating oxidative stress and inflammatory response, thereby reducing caspase 3 activation and protecting PA-induced Min6 β cell damage. Furthermore, according to their predicted drug-likeness and medicinal chemistry properties, both compounds, particularly the compound D-2, could be better lead drug candidates. Overall, the present study evidently showed that quinazoline nitrogen-containing heterocyclic derivatives to inhibit TXNIP would be potent pancreatic β cell protective agents and compounds D-2 and C-1, especially the compound D-2, might serve as promising lead candidates for the treatment of T2DM.
Supplemental Material
Download PDF (53.1 KB)Acknowledgement
Thanks for the support of Shanxi Key Subjects Construction (FSKSC), and Shanxi “1331 Project” Key Subjects Construction.
Disclosure statement
The authors report no conflicts of interest.
Additional information
Funding
References
- International Diabetes Federation. IDF diabetes atlas. 10th ed. Brussels (Belgium): International Diabetes Federation; 2021.
- Papatheodorou K, Banach M, Bekiari E, Rizzo M, Edmonds M. Complications of diabetes 2017. J Diabetes Res. 2018; 2018:3086167.
- Hu C, Jia W. Therapeutic medications against diabetes: what we have and what we expect. Adv Drug Deliv Rev. 2019;139:3–15.
- Kathrin M. Beta cells in type 2 diabetes - a crucial contribution to pathogenesis. Diabetes Obes Metab. 2008;10(5):408–420.
- Tatsuo T. Apoptosis in pancreatic β-islet cells in type 2 diabetes. Bosn J Basic Med Sci. 2016;16(3):162–179.
- Grant B, Sandelson M, Agyemang-Prempeh B, Zalin A. Managing obesity in people with type 2 diabetes. Clin Med. 2021;21(4):e327–e231.
- Carbone S, Del Buono MG, Ozemek C, Lavie CJ. Obesity, risk of diabetes and role of physical activity, exercise training and cardiorespiratory fitness. Prog Cardiovasc Dis. 2019;62(4):327–333.
- Johnston LW, Harris SB, Retnakaran R, Giacca A, Liu Z, Bazinet RP, Hanley AJ. Association of NEFA composition with insulin sensitivity and beta cell function in the Prospective Metabolism and Islet Cell Evaluation (PROMISE) cohort. Diabetologia. 2018;61(4):821–830.
- Chen G, Li Y, Zeng F, Deng G, Liang J, Wang J, Su Y, Chen Y, Mao L, Liu Z, et al. Biomarkers of fatty acids and risk of type 2 diabetes: a systematic review and meta-analysis of prospective cohort studies. Crit Rev Food Sci Nutr. 2021;61(16):2705–2718.
- Forouhi NG, Koulman A, Sharp SJ, Imamura F, Kröger J, Schulze MB, Crowe FL, Huerta JM, Guevara M, Beulens JW, et al. Differences in the prospective association between individual plasma phospholipid saturated fatty acids and incident type 2 diabetes: the EPIC-InterAct case-cohort study. Lancet Diabetes Endocrinol. 2014;2(10):810–818.
- Maedler K, Spinas GA, Dyntar D, Moritz W, Kaiser N, Donath MY. Distinct effects of saturated and monounsaturated fatty acids on beta-cell turnover and function. Diabetes. 2001;50(1):69–76.
- Vetere A, Choudhary A, Burns SM, Wagner BK. Targeting the pancreatic β-cell to treat diabetes. Nat Rev Drug Discov. 2014;13(4):278–289.
- Mahmood DF, Abderrazak A, El Hadri K, Simmet T, Rouis M. The thioredoxin system as a therapeutic target in human health and disease. Antioxid Redox Signal. 2013;19(11):1266–1303.
- Lu J, Holmgren A. The thioredoxin antioxidant system. Free Radic Biol Med. 2014;66:75–87.
- Yoshihara E, Chen Z, Matsuo Y, Masutani H, Yodoi J. Thiol redox transitions by thioredoxin and thioredoxin-binding protein-2 in cell signaling. Methods Enzymol. 2010;474:67–82.
- Yoshihara E. TXNIP/TBP-2: a master regulator for glucose homeostasis. Antioxidants. 2020;9(8):765.
- Alhawiti NM, Al Mahri S, Aziz MA, Malik SS, Mohammad S. TXNIP in metabolic regulation: physiological role and therapeutic outlook. Curr Drug Targets. 2017;18(9):1095–1103.
- Chen J, Saxena G, Mungrue IN, Lusis AJ, Shalev A. Thioredoxin-interacting protein: a critical link between glucose toxicity and beta-cell apoptosis. Diabetes. 2008;57(4):938–944.
- Chen J, Hui ST, Couto FM, Mungrue IN, Davis DB, Attie AD, Lusis AJ, Davis RA, Shalev A. Thioredoxin-interacting protein deficiency induces Akt/Bcl-xL signaling and pancreatic beta-cell mass and protects against diabetes. 2008;22(10):3581–3594.
- Zhou R, Tardivel A, Thorens B, Choi I, Tschopp J. Thioredoxin-interacting protein links oxidative stress to inflammasome activation. Nat Immunol. 2010;11(2):136–140.
- Sato Y, Fujimoto S, Mukai E, Sato H, Tahara Y, Ogura K, Yamano G, Ogura M, Nagashima K, Inagaki N. Palmitate induces reactive oxygen species production and β-cell dysfunction by activating nicotinamide adenine dinucleotide phosphate oxidase through Src signaling. J Diabetes Investig. 2014;5(1):19–26.
- Oslowski CM, Hara T, O'Sullivan-Murphy B, Kanekura K, Lu S, Hara M, Ishigaki S, Zhu LJ, Hayashi E, Hui ST, et al. Thioredoxin-interacting protein mediates ER stress-induced β cell death through initiation of the inflammasome. Cell Metab. 2012;16(2):265–273.
- Thielen LA, Chen J, Jing G, Moukha-Chafiq O, Xu G, Jo S, Grayson TB, Lu B, Li P, Augelli-Szafran CE, et al. Identification of an anti-diabetic, orally available small molecule that regulates TXNIP expression and glucagon action. Cell Metab. 2020;32(3):353.e8–365.e8.
- Alber AB, Suter DM. Dynamics of protein synthesis and degradation through the cell cycle. Cell Cycle. 2019;18(8):784–794.
- Trachootham D, Lu W, Ogasawara MA, Nilsa RD, Huang P. Redox regulation of cell survival. Antioxid Redox Signal. 2008;10(8):1343–1374.
- Wehinger S, Ortiz R, Díaz MI, Aguirre A, Valenzuela M, Llanos P, Mc Master C, Leyton L, Quest AF. Phosphorylation of caveolin-1 on tyrosine-14 induced by ROS enhances palmitate-induced death of beta-pancreatic cells. Biochim Biophys Acta. 2015;1852(5):693–708.
- Liu J, Chang F, Li F, Fu H, Wang J, Zhang S, Zhao J, Yin D. Palmitate promotes autophagy and apoptosis through ROS-dependent JNK and p38 MAPK. Biochem Biophys Res Commun. 2015;463(3):262–267.
- Elsner M, Gehrmann W, Lenzen S. Peroxisome-generated hydrogen peroxide as important mediator of lipotoxicity in insulin-producing cells. Diabetes. 2011;60(1):200–208.
- Schroder K, Zhou R, Tschopp J. The NLRP3 inflammasome: a sensor for metabolic danger? Science. 2010;327(5963):296–300.
- Haneklaus M, O'Neill LA. NLRP3 at the interface of metabolism and inflammation. Immunol Rev. 2015;265(1):53–62.
- Mori MA, Bezy O, Kahn CR. Metabolic syndrome: is Nlrp3 inflammasome a trigger or a target of insulin resistance? Circ Res. 2011;108(10):1160–1162.
- Youm YH, Adijiang A, Vandanmagsar B, Burk D, Ravussin A, Dixit VD. Elimination of the NLRP3-ASC inflammasome protects against chronic obesity-induced pancreatic damage. Endocrinology. 2011;152(11):4039–4045.
- Lytrivi M, Igoillo-Esteve M, Cnop M. Inflammatory stress in islet β-cells: therapeutic implications for type 2 diabetes? Curr Opin Pharmacol. 2018;43:40–45.
- Igoillo-Esteve M, Marselli L, Cunha DA, Ladrière L, Ortis F, Grieco FA, Dotta F, Weir GC, Marchetti P, Eizirik DL, et al. Palmitate induces a pro-inflammatory response in human pancreatic islets that mimics CCL2 expression by beta cells in type 2 diabetes. Diabetologia. 2010;3(7):1395–1405.
- Inoue H, Shirakawa J, Togashi Y, Tajima K, Okuyama T, Kyohara M, Tanaka Y, Orime K, Saisho Y, Yamada T, et al. Signaling between pancreatic β cell and macrophages via S100 calcium-binding protein A8 exacerbates β-cell apoptosis and islet inflammation. J Biol Chem. 2018;293(16):5934–5946.
- Jiang M, Qi L, Li L, Li Y. The caspase-3/GSDME signal pathway as a switch between apoptosis and pyroptosis in cancer. Cell Death Discov. 2020;6:112.
- Daina A, Michielin O, Zoete V. SwissADME: a free web tool to evaluate pharmacokinetics, drug-likeness and medicinal chemistry friendliness of small molecules. Nature Sci Rep. 2017;7:42717.