
 ?Mathematical formulae have been encoded as MathML and are displayed in this HTML version using MathJax in order to improve their display. Uncheck the box to turn MathJax off. This feature requires Javascript. Click on a formula to zoom.
Abstract
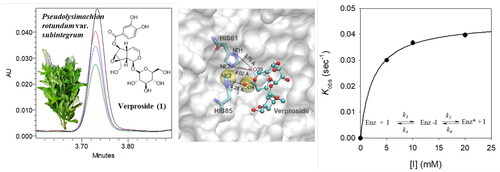
Affinity-based ultrafiltration–mass spectrometry coupled with ultraperformance liquid chromatography–quadrupole time-of-flight mass spectrometry was utilised for the structural identification of direct tyrosinase ligands from a crude Pseudolysimachion rotundum var. subintegrum extract. False positives were recognised by introducing time-dependent inhibition in the control for comparison. The P. rotundum extract contained nine main metabolites in the UPLC-QTOF-MS chromatogram. However, four metabolites were reduced after incubation with tyrosinase, indicating that these metabolites were bound to tyrosinase. The IC50 values of verproside (1) were 31.2 µM and 197.3 µM for mTyr and hTyr, respectively. Verproside showed 5.6-fold higher efficacy than that of its positive control (kojic acid in hTyr). The most potent tyrosinase inhibitor, verproside, features a 3,4-dihydroxybenzoic acid moiety on the iridoid glycoside and inhibits tyrosinase in a time-dependent and competitive manner. Among these three compounds, verproside is bound to the active site pocket with a docking energy of −6.9 kcal/mol and four hydrogen bonding interactions with HIS61 and HIS85.
Graphical abstract
Introduction
Hyperpigmentation of human skin offers the greatest protection against UV-induced damageCitation1–3. Long-term hyperpigmentation leads to melanoma, melasma, freckles, ephelides, postinflammatory hyperpigmentation, and solar lentiginesCitation2,Citation3. One way to ameliorate these negative symptoms is to create a direct inhibitor/enzyme interaction with the enzyme tyrosinaseCitation3–6. Tyrosinase (EC 1.14.18.1) is a multifunctional, glycosylated, copper-containing oxidaseCitation7 that catalyses the following reactions: the ortho-hydroxylation of monophenols (L-tyrosine) to O-diphenols (L-dopa), known as monophenolase (cresolase) activity, and the oxidation of O-diphenols (L-dopa) into reactive O-quinones (O-dopaquinone), known as diphenolase activityCitation7–9. Thus, inhibitors of the tyrosinase mechanism might offer an effective strategy to control hyperpigmentation. Various strategies have been employed to inhibit tyrosinase activity, including the following: reducing dopaquinone (e.g. ascorbic acid) or using an o-dopaquinone scavenger (e.g. thio-containing compounds), alternative enzyme substrates (e.g. phenolic compounds), non-specific enzyme inactivators (e.g. acids or bases), or specific tyrosinase inactivators (e.g. mechanism-based inhibitors). Therefore, the development of more effective tyrosine inhibitors with direct inhibitor/enzyme interactions, especially targeted inhibitors, is an important task.
As a result, numerous medicinal compound discovery strategies have included methods to screen numerous natural products for the identification of novel biologically active componentsCitation10,Citation11. However, target compounds cannot be efficiently isolated because they decompose under the conditions of conventional repeated column chromatography isolation, they are present at an extremely low concentration, and/or their actions may occur due to the complex synergistic effect of multicomponent multitargets (MCMTs)Citation12–14. Therefore, an affinity ultrafiltration liquid chromatography–mass spectrometry (LC–MS) method was recently developed to screen enzyme inhibitors from plant extracts and identify lead compoundsCitation15–18. In principle, these enzyme inhibitors must form a ligand–receptor complex that is retained from the extract so that the active compounds can be easily identified by LC–MSCitation19,Citation20. This approach to natural product screening is an effective strategy for obtaining more active compounds.
Iridoids are widely biosynthesized in plants and possess iridodials joined by glycoside and non-glycoside systems, and these iridoid glycosides can be further subdivided into carbocyclic iridoids and secoiridoids. Iridoid glycosides have received much attention due to the wide variety of pharmacological activities reported for these compounds, including anti-inflammation, anti-diabetic, anti-cardiovascular, and anti-cancer properties. Although iridoids has been shown to induce reduce the growth of mushroom tyrosinaseCitation21,Citation22, the anti-tyrosinase effects of iridoid glycosides in enzyme kinetics and human tyrosinase have not been widely studied.
In this research, we investigated the possibility of using competitive binding metabolites with affinity ultrafiltration and quadrupole time-of-flight mass spectrometry (QTOF)-MS analysis to identify target tyrosinase inhibitors from the whole plant of Pseudolysimachion rotundum var. subintegrum. A binding affinity test with ultraperformance liquid chromatography QTOF (UPLC-QTOF-MS) identified nine iridoids that appeared to interact strongly with tyrosinase. Among the nine isolated compounds examined, verproside (1) was found to effectively inhibit tyrosinase activity. Notably, affinity ultrafiltration, enzyme kinetics, and docking simulations of potent active compound 1 showed that the compound inhibits tyrosinase through direct competitive binding and time-dependent inhibition.
Materials and methods
General experimental procedures
High-speed counter-current chromatography (HSCCC) was carried out with a TBE-1000A high-speed countercurrent chromatography system (Shanghai Tauto Biotech Co. Ltd., Shanghai, China) with three serially connected multilayer coil separation columns (tubing = 1.6 mm; total volume = 1000 ml) and an 80 ml sample loop. The system was equipped with an LPLC pump (TBP5002, Shanghai Tauto Biotech Co. Ltd., Shanghai, China), a Thermo Finnigan SSI 500 UV detector (Thermo Electron Co., San Jose, CA), and Autochro-WIN software (version 3.0, Younglin-Tech, Seoul, Korea). 1H and 13C NMR spectra were recorded on a Bruker AM500 instrument (Billerica, Massachusetts, USA). Profiling and tentative identification of the compounds were achieved with ultrahigh-performance liquid chromatography coupled with electrospray ionisation and quadrupole time-of-flight mass spectrometry (UPLC-ESI-QTOF-MS; ACQUITY UPLC™ system coupled to a Micro mass QT Premier™, Waters, Milford, MA, USA) with a reversed-phase column (ACQUITY BEH C18 1.7 μm, 2.1 × 100 mm, Waters). Purified water was obtained from a Milli-Q Academic system (Merck Millipore, Burlington, MA, USA). The reagents required for UPLC-ESI-QTOF-MS analysis were acetonitrile (ACN) (Merck Millipore), formic acid, and leucine enkephalin (Sigma–Aldrich, St. Louis, MO, USA). Solvents for NMR were purchased from Cambridge Isotope Lab Inc. (Andover, MA, USA).
Plant material
The whole plant of P. rotundum var. subintegrum was collected at Eumsung Chungbuk, Korea, in September 2011 and identified by Min-Ha Kim from the National Institute of Biological Resources. For recollection, seeds of Pseudolysimachion rotundum var. subintegrum were cultivated in a well-controlled glass greenhouse at the KRIBB, Cheong-ju, Korea in 2020. A voucher specimen (KRIB 0020697) was deposited at the Plant Extract Bank of KRIBB in Daejeon, Korea. Each of the collected plants were divided into two parts, the aerial parts and roots, and chopped and extracted at room temperature (as described below). The aerial parts were packaged and transported to a laboratory (over a maximum of 2 h) using refrigerating equipment and were stored at − 20 °C in Ziplock bags (Ziploc, S. C. Johnson & Son, Inc., Racine, WI, USA) for a maximum of 20 wk. The P. rotundum var. subintegrum aerial parts were immediately freeze-dried (CleanVac 8 HanilScience Medical, Daejeon, Korea), pulverised (Model 0004180000, tubemill control, IKA, Staufen, Germany) and stored in the dark at −20 °C for a maximum of 20 wk.
Affinity-based ultrafiltration procedures
Affinity-based ultrafiltration was performed as previously described by Zuo et al. and Wang et al.Citation15,Citation19,Citation23. First, 2487 μL of 0.25 M phosphate buffer (pH 6.8) with 10% glycerol was added to 13 μL of mushroom tyrosinase (144 U in the same phosphate buffer solution) and 100 μL of 1000 mg/mL extract (the test solution was consistently 3.3%). The final concentration of the extract was adjusted to 1000 ppm. The mixture was incubated for 15 or 50 min at 37 °C on a plate shaker. Then, the sample was centrifuged at 13,000 rpm for 20 min, and the supernatant was collected for analysis. The supernatant solution was filtered through a membrane (PTFE 0.2 μm, hydrophobic, Advantec, Japan), and 2 μL of each solution was injected for UPLC-PDA-QTOF-MS analysis.
UPLC-PDA-ESI-QTOF-MS chromatographic conditions
The compounds from the P. rotundum var. subintegrum extract were analysed by UPLC-PDA-ESI-QTOF-MS. The chromatographic gradient program included two mobile phase solutions (A: water with 0.1% formic acid; B: ACN with 0.1% formic acid) was as follows: 0–1 min, 10% B; 1–10.5 min, 10–23% B; 10.5–12.0 min, 23–98% B; 12.0–13.3 min, 98% B; 13.3–13.4 min, 98–10% B and maintained at 10% B. Analysis was performed at a flow rate of 0.4 ml/min. MS was performed in negative ion mode ([M − H]−). N2 was used as the desolvation gas, the desolvation temperature was set to 350 °C at a flow rate of 400 L/h with a source temperature of 100 °C. The capillary and cone voltages were set to 2300 and 50 V, respectively. The data for each sample were collected with a scan time of 0.25 s and a 0.01 s interscan delay. Exact MS, MS/MS, and elemental analysis were confirmed using MassLynx software incorporated into the Waters instrument.
Extraction and isolation of iridoids
The dried whole plant of P. rotundum var. subintegrum (2 kg) was extracted with MeOH (10 L × 3) at room temperature, and the solvent was concentrated using an evaporator under reduced pressure at 40 °C to obtain the methanolic extract (198.7 g). A portion of the methanolic extract (30 g) was subjected to C18 column chromatography using MeOH-H2O (3:97, 25:75, 65:35, 100:0 v/v) to give four fractions (PL-1 to PL-4). Fraction PL3 (5 g) was further fractionated by medium-pressure liquid chromatography (MPLC) with an RP C-18 column (5 cm × 49 cm, 40 C18-prep) eluted with MeOH-H2O (20:80, 30:70, 40:60 v/v, step gradient) to afford five fractions (PL3m–1 to PL3m–5). Fraction PL3m–1 (1.2 g) was subjected to preparative HPLC using MeOH-H2O (1:2, v/v) to give compound 1 (500 mg). Fraction PL3m–2 (800 mg) was purified by Sephadex LH-20 (2.5 × 170 cm) column chromatography eluted with 90% MeOH to give four subfractions, PL3m–2–1 to PL3m–2–4. Subfraction PL3m–2–1 (52.6 mg) was separated by preparative HPLC using an Atlantis® prep T3 OBDTM column (5 μm particle size, 19 × 250 mm; mobile phase of 18% ACN in H2O; flow rate of 16 ml/min; UV detection at 263 nm] to obtain compounds 2 (15.1 mg) and 3 (12.5 mg). Fraction PL3m–4 (18.3 mg) was isolated by preparative HPLC [Atlantis® prep T3 OBDTM column (5 μm particle size, 19 × 250 mm); mobile phase 18% of ACN in H2O; flow rate 16 ml/min; UV detection at 263 nm] to give compound 4 (5.4 mg). Compounds 5 (19.7 mg), 6 (11.3 mg), and 7 (28.7 mg) were obtained from the purification of a portion of fraction PL3m–4 (2.8 g) by HSCCC [n-BuOH/H2O = 1:1 v/v, upper phase for the stationary phase, lower phase for the mobile phase; loading sample: 100 mg; flow rate: 5.5 ml/min; 600 rpm; forward; UV: 263 nm]. Fraction PL3m–5 (50.6 mg) was further separated with an RP-C18 MPLC column eluting with a gradient of MeOH-H2O (4:6, 5:5, 6:4, 7:3, 10:0) to afford compounds 8 (2.1 mg) and 9 (1.9 mg).
Tyrosinase kinetic assay
The enzymatic activities of tyrosinase were tested in vitro with the substrates and inhibitors known to interact with mushroom and mammalian tyrosinases (http://www.brenda-enzymes.info). The Michaelis-Menten constant (Km) of proteins was calculated from Lineweaver-Burk plots for 1/V0 versus 1/[substrate]. Mushroom tyrosinase (mTyr, EC 1.14.18.1, Sigma Chemical Co., T3824-50KU) was used as described previouslyCitation9 with some modifications with either 3,4-Dihydroxy-L-phenylalanine (L-DOPA, D9628-5G) or L-tyrosine (T3754-50G) as the substrate. In the spectrophotometric experiments, the initial velocity (vi) of enzymatic activity was monitored by observing dopachrome formation at 475 nm with a UV–vis spectrophotometer (SpectraMax M4, Molecular Devices, Sunnyvale, CA, USA) at 37 °C. The reaction was performed in a 96-well plate. All samples were first dissolved in dimethyl sulfoxide (DMSO) at a concentration of 2 mM. First, 15 μL of a 2.7 mM L-tyrosine (Km = 180 μM) or 10 μL of 7 mM L-DOPA (Km = 350 μM) aqueous solution was mixed with 0.25 M phosphate buffer (pH 6.8). Then, 10 μL of the sample solution and 2 μL of the same phosphate buffer solution containing mushroom tyrosinase (144 U) were added to the mixture in sequence (unit definition: one unit will cause an increase in A280 of 0.001 per minute at pH 6.5 and 25 °C in a 3 ml reaction system containing L-tyrosine). The activity of recombinant human tyrosinas (hTyr, His-tag, Enzo® Life Sciences, NY, USA, Cat. No. BML-SE535-0100) was determined using L-DOPA as a substrate, and the procedure involved a previously described absorption assayCitation24. Each well contained a mixture 20 μL of 7.0 mM L-DOPA (Km = 630 μM) and 2 μL of 1 mg/mL protein concentrate in 50 mM Tris-HCl, pH 8.0, 1 M NaCl, 0.05% empigen BB, and 30% glycerol (Purity: ≥85%, SDS-PAGE). The reaction was incubated for 10 min at 37 °C and was monitored at 475 nm for dopachrome formation on a SpectraMax M4 multimode detection platform (Molecular Devices). Each assay was conducted as three separate replicates. The inhibitory concentration leading to 50% activity loss (IC50) was determined by fitting the experimental data to the logistic curve according to the following equationCitation25:
(1)
(1)
Affinity-based time-dependent assay
Time-dependent assays were carried out using 144 U of mushroom tyrosinase and L-tyrosine as the substrate in 0.25 M phosphate buffer (pH 6.8) at 30 °C. To determine the kinetic parameters associated with the time-dependent inhibition of tyrosinase, progress curves were constructed from the chromatograms after preincubation for 5, 15, 20, 25, and 30 min with a fixed inhibitor concentration. The data were analysed using a nonlinear regression program [SigmaPlot (SPCC Inc., Chicago, IL)] to give the individual parameters for each curve; vi (initial velocity), vs (steady–state velocity), kobs (apparent first–order rate constant for the transition from vi to vs), A (intensity), A0 (included to correct any possible deviation in the baseline), and Kiapp (apparent Ki) according to EquationEquations. 2–4Citation26–28:
(2)
(2)
(3)
(3)
(4)
(4)
Tyrosinase docking and MD simulations
In silico docking simulations of nine compounds with tyrosinase were performed using AutoDock VinaCitation29. The three-dimensional structure of tyrosinase was obtained from the Protein Data Bank (PDB) with ID, 2Y9X. The protein structure originated from Agaricus bisporus. The human origin tyrosinase structure has not been revealed experimentally and was predicted using alpha fold program (https://www.uniprot.org/uniprotkb/P14679/). Because the mushroom tyrosinase (mTyr) is the experimental structure, the docking simulations were performed mainly in the tyrosinase. The human tyrosinase (hTyr) was used for comparison. Because tyrosinase is a metalloenzyme and two Copper ions play important roles in its chemical reactions, these ions were included in the docking simulations. Nine compounds were constructed, and their structures were minimised using the Marvin program (ChemAxon; http://www.chemaxon.com). For docking simulations, the tyrosinase pockets were searched using the Pck pocket detection program (http://schwarz.benjamin.free.fr/Work/Pck/home.htm). Twelve pockets with volumes greater than 100.0 Å3 were found. Docking simulations focused on these pockets, which consisted of 100 pocket residues. Each compound was placed in the 100 pocket residues and the simulations were run ten times with different random seeds for a total of 1000 simulations. A box with a length of 15 Å was used to prevent the compounds from drifting from the centre of the pocket residue. With the obtained 1000 docking poses, clustering based on the centre of mass was performed using CHARMM (Chemistry at HARvard Macromolecular Mechanics) to group these conformationsCitation30. The compounds in each group were ranked by lowest energy, the number of compounds occupying the pocket, and average energy. The molecular structures were drawn with the visual molecular dynamics (VMD) visualiser program (https://www.ks.uiuc.edu/Research/vmd/). The hydrogen bonding interactions between each compound and tyrosinase were calculated based on geometric analysis. First, the hydrogen bond acceptor and donor atoms from both tyrosinase and the compounds were listed. All pairs of acceptor and donor atoms were then arranged to measure the geometric distances and angles. The hydrogen bonding criteria were less than 4 Å between the acceptor and donor atoms and an angle of over 120 degrees for the three atoms (donor, hydrogen, and acceptor).
Using the potent docking inhibitor, we performed molecular dynamics (MD) simulations with TIP3P explicit water solvation. The input scripts for MD were prepared using the Input Generator-Solution Builder of CHARMM-GUI (https://charmm-gui.org/). The protein-inhibitor model was constructed with TIP3 water molecules and KCl ions to obtain an electrically neutral system. MD simulation was carried our for 100 nanoseconds (ns) with the CHARMM36m force fields using GROMACS (v5.1.2) program. Trajectory data was recorded every 100 picoseconds (ps), resulting in a total of 1,000 frames. The MD integrator utilised utilized the leap-frog algorithm for integrating Newton’s equations of motion. All bonds were constrained using the linear constraint solver (LINCS) algorithm. Additionally, the MD simulation was conducted at a temperature of 303.15 K and pressure of 1 atm. Short minimisation and equilibrium dynamics were performed before the production simulation. The Nose-Hoover algorithm was applied to set the temperature boundary conditions, and the Parrinello-Rahman pressure coupling method was used for pressure boundary conditions. To assess the stability between tyrosinase and the inhibitor ligand, we calculated the root mean square fluctuation (RMSF) for C-alpha atoms of the protein, plotted the root mean square deviation (RMSD) versus time for the protein backbone structure, and determined the radius of gyration (Rg). Each calculation was executed using the built-in functions of GROMACS, specifically gmx rmsf, gmx rms, gmx gyrate, and visualised through python matplotlib. To build the distance profile between tyrosinase and the inhibitor, we utilised the dist module and visualised the results.
Results and discussion
Identification of tyrosinase inhibitors using affinity-based ultrafiltration–mass spectrometry combined with competitive binding experiments
In most cases, enzyme binding affinity can be used to identify inhibitors of target proteinsCitation31. For this inhibition to occur, a reversible complex (Enz-I) formation step between the target protein (Enz) and inhibitor (I) and an irreversible dissociation step of Enz-I must occur. In addition, according to previous studies, most reported time-dependent inhibitors bind competitivelyCitation32. Therefore, as a strategy to find a target inhibitor, we first optimised the experimental conditions, including enzyme concentration and preincubation time, to reduce background noise for distinguishing false hits from competitive inhibitors. As shown in , a screening system based on UPLC-QTOF-MS was constructed to screen for tyrosinase-specific inhibitors from plants. The affinity-based ultrafiltration incorporated an 14.4, 28.8, and 43.2 U enzyme concentration and 1000 ppm extract and preincubation for 15 min followed by centrifugation and analysis using UPLC-PDA-QTOF-MS. By comparing the LC–MS chromatograms from the performed experiments, such as those in the presence or absence of enzyme and those with incubation times, the metabolites that were dramatically reduced when the enzyme was present under the optimal conditions were determined to be correlated with binding. The relative metabolite intensities of six compounds (1, 2, 4, and 6 − 8) from the P. rotundum var. subintegrum extract were significantly reduced upon treatment with mTyr (). This result indicates that six compounds (1, 2, 4, and 6 − 8) corresponding to metabolites have significant binding interactions with the target enzyme.
Figure 1. (A) UPLC-PDA and (B) UPLC-QTOF-MS data of the Pseudolysimachion rotundum var. subintegrum extract after the binding experiment. Black: not exposed to enzyme; red, blue, and green; after incubation with tyrosinase for 15 min. Peaks numbered 1 − 9 represent the compounds isolated from P. rotundum var. subintegrum in our study.
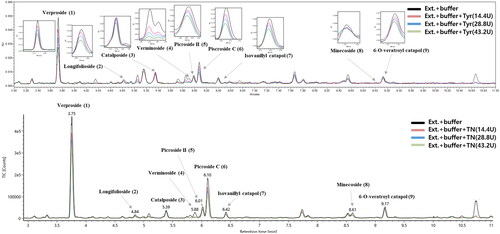
Table 1. UPLC chromatographic, UV–Vis, and mass spectral data of the compounds identified from P. rotundum var. subintegrum.
UPLC-ESI-QTOF-MS analysis of the extract
The methanolic extract of P. rotundum var. subintegrum was analysed by UPLC-ESI-QTOF-MS. P. rotundum var. subintegrum belongs to the family Scrophulariaceae and is rich in iridoid glycosidesCitation33. More sensitive MS detection of iridoid glycosides occurs in negative ionisation mode than in positive ionisation modeCitation34,Citation35. Therefore, we identified all isolated compounds (1 − 9) in negative mode, and all data were detected from the deprotonated molecule [M − H]− in the MS/MS spectra ( and S3). The UV spectrum showed absorption peaks at 220, 263 and 296 nm, indicating the presence of a conjugated enol–ether system. High-resolution–electrospray ionisation–mass spectrometry (HRESIMS) analysis of the molecular ion cluster [M − H]− (m/z 497.1292) of verproside (1), as the major compound in P. rotundum var. subintegrum, established the molecular formula as C20H20O5. The MS fragment detected at m/z 335.0784 [M − H − 162] − corresponded to the loss of the glucose moiety, and the loss of 114 Da (fragment ion at m/z 221.0456 [M − H − 162 − 114] –) was due to the loss of two aldehyde groups and cleavage of the substituent ring (28 Da), which was based on the hemiacetal group being easily converted into an epimeric isomer. Therefore, the hemiacetal group isomerised into two aldehyde groups. For these reasons, compound 1 was identified as verproside. Compounds 3 − 5 and 7 − 9 exhibited [M − H]− ions at m/z 481.1327 (3; calcd for C22H26O12, 481.1346, tR = 4.94 min), 523.1436 (4; calcd for C24H28O13, 523.1452, tR = 5.99 min), 511.1451 (5; calcd for C23H28O13, 511.1452, tR = 6.12 min), 511.1447 (7; calcd for C23H28O13, 511.1452, tR = 6.52 min), 537.1647 (8; calcd for C25H30O13, 537.1608, tR = 8.69 min), and 623.1953 (9; calcd for C24H30O13, 623.1976, tR = 9.28 min). These compounds also showed fragment ion losses similar to those of verproside (1): glucose (−162 Da) and two aldehyde groups and cleavage of the substituent ring (−114 Da). Therefore, these compounds were identified as catalposide (3), verminoside (4), picroside II (5), isovanillyl catapol (7), minecoside (8), and 6-O-veratroyl catalpol (9). Compounds 2 (m/z 533.1028, calcd for C22H27ClO13, 533.1062, tR = 4.94 min) and 6 (m/z 533.1064, calcd for C22H27ClO13, 533.1062, tR = 6.23 min) were deduced from the quasimolecular 3:1 ion cluster, assuming that these compounds contained Cl, and were identified as longifolioside A (2) and piscroside C (6) ().
Isolation and identification of the iridoids
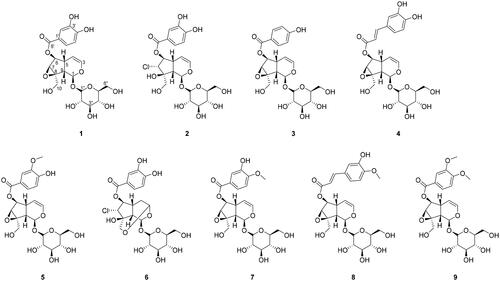
Nine compounds (1 − 9) were isolated from the whole plant of P. rotundum var. subintegrum and their identities were elucidated based on 1D and 2D NMR data. Most of the isolated compounds, except for 2 and 6, from P. rotundum var. subintegrum were iridoid glycosides with an aglycone oxygen bridge between C-7 and C-8 with different benzene substituent groups at C-6 and a glucose linked to the O-aglycone at the C-1 position. The discussion of structural identification will focus on compound 1, which emerged as the most potent tyrosinase inhibitor. Compound 1 was deduced to be a glucoside according to the general appearance of its 1H and 13C NMR spectra (Figures S1 and S2). The 13C NMR data showed 22 carbons, including five quaternary carbons, two methylene carbons and fifteen methine carbons. The 1H and 13C spectra suggested an iridoid-type skeleton with one glucoside unit [13C NMR: δC 98.3 (C-Glc-1″), 73.9 (C-Glc-2″), 76.9 (C-Glc-3″), 70.7 (C-Glc-4″), 77.9 (C-Glc-5″), 61.8 (C-Glc-6″); 1H NMR: δH 4.61 (d, J = 7.8 Hz, H-Glc-1″), 3.06 (d, J = 7.8 Hz, H-Glc-2″), 3.17 (m, H-Glc-3″), 3.02 (d, J = 8.8 Hz, H-Glc-4″), 3.14 (m, H-Glc-5″), 3.47 (dd, J = 6.8, 11.6 Hz, H-Glc-6″a), 3.72, (m, H-Glc-6″b)]. The 1H NMR signals from the aglycone moiety showed five aromatic/olefinic methines [δH 7.40 (d, J = 2.0 Hz, H-2′), 7.36 (dd, J = 2.0, 8.4 Hz, H-6′), 6.83 (d, J = 8.4 Hz, H-5′), 6.42 (dd, J = 1.6, 5.6 Hz, H-3), 4.94 (dd, J = 4.4, 5.6 Hz, H-4)], three oxygenated methines [δH 5.10 (d, J = 9.2 Hz, H-1), 5.04 (dd, J = 0.8, 8.0 Hz, H-6), 3.69 (d, J = 8.0 Hz, H-7)], an oxymethylene [δH 3.92 (d, J = 13.6 Hz, H-10a), 3.72 (d, J = 13.6 Hz, H-10b)], and two methines [δH 2.50 (m, H-5), 2.47 (d, J = 8.0 Hz, H-9)]. The 13C NMR revealed 16 carbon resonances, including a carbonyl carbon [δc 166.1 (C-7′)], three oxygenated aromatic/olefinic quaternary carbons [δC 151.3 (C-4′), 145.6 (C-3′), 120.4 (C-1′)], an oxygenated quaternary carbon [δC 66.2 (C-8)], five aromatic/olefinic methanes [δC 141.6 (C-3), 122.6 (C-5′), 116.8 (C-2′), 115.8 (C-6′), 102.2 (C-4)], three oxygenated methines [δC 93.4 (C-1), 79.9 (C-6), 58.9 (C-7)], an oxymethylene [δC 58.7 (C-10)], and two methines [δC 42.3 (C-9), 35.7 (C-5)]. The HMBC correlations from H-2′ to C-4′/C-6′/C-7′, H-5′ to C-1′/C-3′, and H-6′ to C-2′/C-4′/C-7′ revealed the presence of a dihydroxybenzoyl group, and the HMBC correlation from H-6 to C-7′ suggested that the dihydroxybenzoyl group was attached to C-6 in the structure of 1. The glucose moiety was attached at C-1 based on the HMBC correlation from H-1 to C-Glc-1″. Therefore, the structure of compound 1 was deduced as shown in and identified as verproside. The NMR data of the other isolated compounds (2 − 9) were quite similar to those of verproside (1), except for the oxygen bridge between C-7 and C-8 and the substituent groups at C-6. The significant difference between 2 and verproside (1) was the presence of Cl at C-7 in 2 instead of an oxygen bridge between C-7 and C-8 based on the downfield shifts of C-7 (δC 69.1) and C-8 (δC 79.0). Compounds 3 − 5 and 7 − 9 differed by only their replacement of the 3,4-dihydroxybenzoyl group at C-6 with 4-hydroxybenzoyl, 3,4-dihydroxyphenyl, 3-methoxy-4-hydroxybenzoyl, 3-hydroxy-4-methoxybenzoyl, 3-methoxy-4-hydroxyphenyl, and 3,4-dimethoxybenzoyl groups, respectively. Compound 6 was most similar to 2, containing an acetyl linkage between C-3 and C-10, as suggested from the HMBC correlation between H2-10 and C-3. Thus, compounds 2 − 9 were identified as longifolioside A (2), catalposide (3), verminoside (4), picroside II (5), piscroside C (6), isovanillyl catapol (7), minecoside (8), and 6-O-veratroyl catalpol (9), and the structures of these compounds are shown in .
Figure 2. Chemical structures of the major compounds isolated from the extract of the whole plant of Pseudolysimachion rotundum var. subintegrum.
Effects of iridoids on the activity of tyrosinase
In the preliminary screening, we observed that iridoids from the whole plant of P. rotundum var. subintegrum showed significant inhibition of L-tyrosinase oxidation. Therefore, more detailed bioassays of the isolated compounds were subsequently conducted. The isolated compounds showed a dose-dependent inhibitory effect on monophenolase activity (mTyr). As the concentrations of the inhibitors increased, the residual enzyme activity was drastically diminished (). As shown in , all the iridoids investigated, especially compounds 1, 2, and 8, exhibited significant dose-dependent inhibition of monophenolase (which uses L-tyrosine as a substrate) (IC50 values of 31.2, 192.9 and 131.8 μM, respectively). The potency of verproside (1, IC50 = 31.2 μM) can be favourably compared with commercially available inhibitors currently used as cosmetics, such as kojic acid (IC50 = 14.8 μM). Based on the above results, the simplest and most effective strategy is determine tyrosinase inhibitory effect agents that can reduce melanin production. However, most of the inhibitors mentioned in the literature have been tested and reported by mTyrCitation2,Citation3,Citation5,Citation7,Citation9,Citation15,Citation23,Citation24. Therefore, tyrosinase inhibitory activity has been reported in relation to the structural characteristics of natural plant inhibitors with a hydroxyl groups and synthetic compounds based on natural productsCitation36,Citation37. Specifically, Ahmed’s group investigated the effects of natural products and their derivatives on the activity of mushroom tyrosinase, such as dihydro-1,5-benzothiazepines (IC50 = 1.21–70.65 µM)Citation38, flavone-based hydrazones (IC50 = 0.95–4.12 µM)Citation39, thioflavones, and thioflavonols (IC50 = 1.12–5.68 µM)Citation40. Another study examined the effects of aurone derivatives (IC50 = 7.12–66.82 µM)Citation41 to discover potent tyrosinase inhibitors. Therefore, we are confident that the previously studied compounds, including iridoid glycosides, are leading structures for the design and development of new tyrosinase inhibitors. Most of the inhibitors mentioned in the literature have been tested and reported by mTyr and inevitably lack clinical efficacy when incorporated into products. Thus, by retesting in hTyr, a strategy was established to discover inhibitors that are effective in mTyr and are clinically accessible. Next, the most potent compound, verproside (1), was analysed for its ability to inhibit hTyr, and the results were compared using kojic acid as the positive control group or the inhibitory effects value of the previously literature. Verproside (1) also showed a dose-dependent inhibitory effect on hTyr, with an IC50 value of 197.3 μM, which was 5.6 times lower than that of the positive control kojic acid. Furthermore, by comparing previously literature for hTyr, it was established that kojic acid produced a more effective inhibitor (1, IC50 = 197.3 μM, kojic acid IC50 = 1109.3 μM vs IC50 = 117.0 μM)Citation42. In addition, verproside did not significantly affect cell viability in B16F10 and Malan-A cells (Figure S4).
Figure 3. (A) Effects of compounds 1, 2, and 8 on the activity of tyrosinase to catalyse L-tyrosine. (B) Lineweaver-Burk plots to investigate the ability of compound 1 to inhibit the monophenolase activity of tyrosinase. (C) Dixon plots to investigate the ability of compound 1 to inhibit the monophenolase activity of tyrosinase. (D) Time-dependent chromatograms of tyrosinase in the presence of compound 1 using UPLC-PDA. (E) Inhibition as a function of preincubation time for the most active compound 1 (5, 10, and 20 mM). (F) Plot of kobs as a function of the concentration of the slow-binding inhibitor 1 fitted by EquationEquation (4)(4)
(4) .
![Figure 3. (A) Effects of compounds 1, 2, and 8 on the activity of tyrosinase to catalyse L-tyrosine. (B) Lineweaver-Burk plots to investigate the ability of compound 1 to inhibit the monophenolase activity of tyrosinase. (C) Dixon plots to investigate the ability of compound 1 to inhibit the monophenolase activity of tyrosinase. (D) Time-dependent chromatograms of tyrosinase in the presence of compound 1 using UPLC-PDA. (E) Inhibition as a function of preincubation time for the most active compound 1 (5, 10, and 20 mM). (F) Plot of kobs as a function of the concentration of the slow-binding inhibitor 1 fitted by EquationEquation (4)(4) kobs=k6+ [(k5 × [I])/(Kiapp + [I])](4) .](/cms/asset/9ed0c31a-4f38-405d-8803-fc6f66329bf9/ienz_a_2252198_f0003_c.jpg)
Table 2. Inhibitory effects of isolated iridoids 1 − 9 on tyrosinase activity.
Subsequently, full characterisation of the kinetic behaviour of the oxidation of L-tyrosine catalysed by tyrosinase in the presence of verproside (1) was investigated. In this experiment, the initial velocity of the enzyme was monitored by observing dopachrome formation at 475 nm. Verproside (1) displayed competitive inhibition against both monophenolase (Ki = 5.1 μM) and diphenolase activity (Ki = ND), as shown in the Dixon and Lineweaver-Burk plots, respectively (). Most competitive inhibitors of tyrosinase bind to the active site, mimicking the enzyme/substrate interaction. The B-ring of our isolated compounds is very similar to the tyrosinase substrate tyrosine). This leads to the competitive displacement of the substrate from the active site with the cofactor via the lock-and-key model. Studies have found that some compounds can also chelate copper, which has been suggested as a mode of inhibition.
Most competitive inhibitors act with slow binding to the enzyme active site. To determine the mode of inhibition of a time-dependent inhibitor, it is convenient to analyse the effect of various substrate concentrations on kobs at a fixed inhibitor concentration. A competitive inhibitor will display a decrease in kobs with increasing substrate concentration. Mushroom tyrosinase showed time-dependent inhibition in the presence of verproside (1). Increasing verproside (1) concentration led to a decrease in both the initial velocity (vi) and the steady-state rate (vs) in the progress curve. The progress curves obtained using various concentrations of the inhibitors were fitted to EquationEquation (2)(2)
(2) to determine vi, vs, and kobs. The binding event was assessed using an experimental setup involving an initial incubation step [5 mM verproside (1) with 144 U of enzyme], followed by centrifugation and finally analysis of the flow-through (i.e. the fraction not bound by the enzyme) using UPLC-PDA rather than a UV–vis spectrophotometer (). Therefore, EquationEquation (2)
(2)
(2) could not be used, but EquationEquations 3
(3)
(3) and Equation4
(4)
(4) could be used with the following step plots. The enzyme was preincubated with inhibitor for a duration of between 0 and 9 min, and the velocity of the reaction was measured as a function of incubation time and analysed according to EquationEquation (3)
(3)
(3) (). Such behaviour is typical of a slow-binding inhibitor. In , the data were fitted to EquationEquation (4)
(4)
(4) and showed a hyperbolic dependence (R2 = 0.9994) on the concentration of inhibitor 1, so inhibition by 1 is believed to follow the mechanism of the enzyme isomerisation model. The y intercept of the curve provides an estimate of the rate constant k6, while the maximum value of kobs is expected at infinite inhibitor concentrations. EquationEquation (4)
(4)
(4) also allowed calculation of the kinetic parameters k5, k6 and Kappi. Thus, analysis of the data according to EquationEquation (4)
(4)
(4) yielded the following values: k5 = 0.04496 s−Citation1, k6 = 0.00001103 s−Citation1, and Kiapp = 2.402 mM. These results indicated that verproside (1) inhibits tyrosinase by rapidly forming an enzyme–substrate complex (Enz-I), which slowly isomerises to form a modified enzyme complex (Enz*-I).
Computational docking simulations to determine the tyrosinase ligand candidates
Docking simulations were performed with the nine compounds in all existing tyrosinase pockets (details are included in the Methods). As shown in , the docking results of the nine compounds are tabulated by the lowest energy, the number of conformations in a group, the average energy in a group, and the binding location. The experimental results show that verproside (1) has meaningful IC50 values () via competitive inhibition; i.e. it directly inhibits the active site of tyrosinase. Verproside (1) was docked into the active site of tyrosinase with the lowest energy of −6.9 kcal/mol and the highest number of conformations at 43. Longifolioside A (2) and minecoside (8) had the lowest binding energies of −6.6 and −6.2 kcal/mol with numbers of 30 and 31, respectively. These numbers are larger than those of verminoside (4), picroside II (5), piscroside C (6), and 6-O-veratroyl catalpol (7). The magnitude of the number indicates how frequently the compound bound to the active site irrespective of the energy. The binding poses of the compounds in the active site, including the two abovementioned compounds, are shown in Supplementary material Figure S5.
Table 3. Docking simulation results of isolated iridoids 1 − 9 on tyrosinase activity.
The docking results were consistent with the experimental results for verproside (1). Therefore, further analysis of verproside (1) was carried out. shows the verproside (1) docking pose with tyrosinase. Verproside (1) was well docked into the active site with a docking energy of −6.9 kcal/mol. The dihydroxy group in the phenyl ring (the upper ring in ) penetrates the active site pocket, interacts with the two Copper ions and forms hydrogen bond with the acceptor atoms of two amino acids, HIS61 and HIS85. As shown in , seven hydrogen bonds were identified. Detailed information on these hydrogen bonds, such as the donors, acceptors, and distances, is tabulated on Supplementary material Table S2.
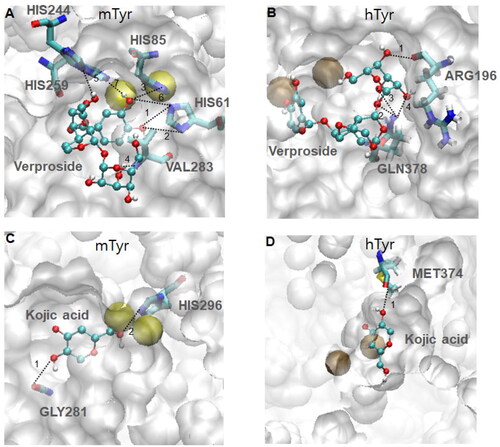
Figure 4. Molecular docking views of two compounds, verproside and kojic acid, on two tyrosinases: (A) verproside-mTyr, (B) verproside-hTyr, (C) kojic acid-mTyr, and (D) kojic acid-hTyr. The tyrosinases are represented by a white surface protein model, and the two Copper ions present in the tyrosinases are represented by a yellow space-filling model. The active site is highlighted by a red transparent box. The compounds are represented by ball and stick models with atom colours: red for Oxygen, cyan for Carbon, and white for Hydrogen.
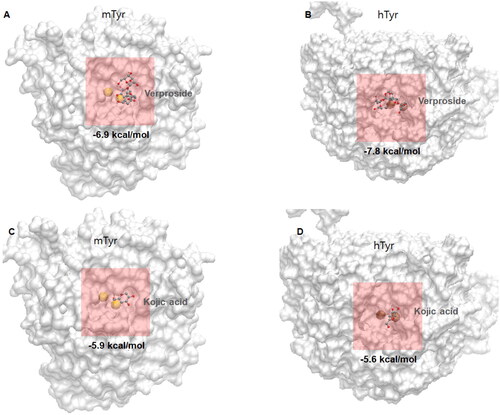
Figure 5. Hydrogen bonding patterns of two compounds, verproside and kojic acid, on two tyrosinases, mTyr and hTyr: (A) verproside-mTyr, (B) verproside-hTyr, (C) kojic acid-mTyr, and (D) kojic acid-hTyr. The active site, highlighted by the red transparent box in , is magnified to show the detailed hydrogen bonding pattern. The compounds are drawn using the ball and stick model and coloured by atom: red for Oxygen, cyan for Carbon, and white for Hydrogen. The hydrogen bonding interactions are indicated by dotted lines with the interaction numbers. The detailed hydrogen bonding patterns are provided in Supplementary material Table S2.
The computational results in show that catalposide (3) and piscroside C (6) also bind to the active site of tyrosinase. However, compared with verproside (1), these two compounds showed different results. Although both have lower binding energies (i.e. they bind more tightly) than verproside (1), catalposide (3) displayed frequent binding with a score of 44, but had a large average energy in the group of 11.36 kcal/mol, whereas piscroside C (6) had a small occupancy number (29) and an average energy of −4.64 kcal/mol. First, we investigated the results of catalposide (3). Although catalposide (3) has the lowest energy in the active site at −7.2 kcal/mol, and a large occupancy number in the group at 44, the average energy in the group had the positive value of 11.36 kcal/mol. In the structural view in , catalposide (3) has one hydroxyl group on its phenyl ring. Based on the observations with verproside (1), this hydroxyl group makes important hydrogen bonding interactions with tyrosinase. The fewer hydroxyl functional groups in catalposide (3) than in verproside (1) (with two hydroxyl groups) results in a weak interaction and a larger average energy than verproside (1). Second, we examined piscroside C (6). Piscroside C (6) was inferred to have a smaller number than verproside (1) because of steric hindrance. As shown in , piscroside C (6) has an epoxy linker (-O-) in the centre ring, and this linker could interrupt binding to the active site; thus, some poses can bind to tyrosinase while the others fail to bind. Additionally, piscroside C (6) has a chlorine in the centre ring, which is a strong electron withdrawing group. Because of the steric hindrance from the linker and electron withdrawing group, piscroside C (6) has a smaller occupancy number in the active site than verproside (1). Although piscroside C (6) gave lower energy than verproside (1), the smaller number in the group makes piscroside C (6) binding unfavourable. In summary, among the three compounds, verproside (1), catalposide (3), and piscroside C (6), with the lowest energy poses in the active site, verproside (1) is the most potent inhibitor when energetic and structural factors are considered.
From a structural perspective, verproside (1) is a potent inhibitor of tyrosinase, whereas the other investigated compounds contain weak points in their structures. Longifolioside A (2) and piscroside C (6) have chlorine atoms in the centre ring, which is a strong electron withdrawing group (). Catalposide (3), picroside II (5), isovanillyl catapol (7), minecoside (8), and 6-O-veratroyl catalpol (9) have one hydroxyl group on the upper phenyl ring, enabling fewer hydrogen bonds in the active site than verproside (1), which contains two hydroxyl groups. Verminoside (4) and minecoside (8) possess an ethylene double bond between the upper phenyl ring and the centre ring. Because this double bond is in the trans-conformation, the dihydroxy phenyl ring pointed towards the active site makes penetration difficult. Piscroside C (6) has an epoxy linker, giving the structure another ring in the centre ring. This produces large steric effects, and as a result, the active site is difficult to penetrate, leading to fewer interactions with the active site.
To clearly differentiate tyrosinases in mushrooms and humans, we will refer to them as mTyr and hTyr, respectively. As described in the Methods section, we obtained the structure of hTyr from the alpha fold database since its experimental structure has not been revealed yet. Among several compounds tested, verproside showed a high affinity for mTyr and was selected for further simulations. Kojic acid (Pubchem CID: 3840) is a well-known reference inhibitor of tyrosinases. We compared the docking results of verproside and kojic acid on both tyrosinases (mTyr and hTyr). Before comparing the docking results, we compared the structures of the two tyrosinases. As illustrated in Supplementary material Figure S6, we superimposed the two structures, and a backbone similarity of 4.2 Å was revealed. Although the two structures are quite similar, hTyr has a larger active pocket located near two Copper ions and more coiled structures.
In , we present the four docking structures of both compounds on both tyrosinases, and the docking results are summarised in . All four simulations were well-docked near the active site, which is located near two Copper ions. The lowest docking score of the four simulations was −7.8 kcal/mol for verproside on hTyr, followed by verproside on mTyr with an energy of −6.9 kcal/mol. These results indicate that compared to kojic acid, verproside binds more tightly and is a competent inhibitor. Although verproside is more tightly bound to hTyr than mTyr in terms of energy values, its bound form on mTyr ranked first in the conformation group, and it exhibited larger hydrogen bonds than those on hTyr. The detailed hydrogen bond patterns of the four docking simulations are shown in . Our results demonstrate that verproside is more tightly bound to mTyr than hTyr, which agrees with the experimental IC50 values (31.2 and 197.3 μM). Kojic acid has less energy than verproside because it is smaller and has fewer interactions, particularly hydrogen bonding interactions. Kojic acid on hTyr has the highest energy (-5.6 kcal/mol) of the four simulations due to its low hydrogen bonding (only one hydrogen bond) and energy rank, which is third in the conformation group. This is consistent with the experimental results, which showed an IC50 of 1109.3 μM.
Table 4. Docking simulation comparisons of verproside and kojic acid on mushroom (mTyr) and human tyrosinase (hTyr).
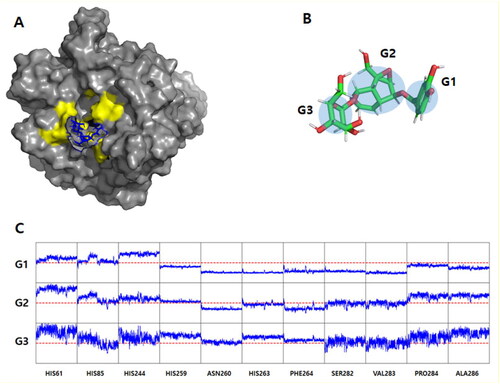
We performed MD simulations for two potent derivatives of verproside on mTyr and hTyr proteins. depicts the final structures obtained from 100-nanosecond (ns) explicit water molecular dynamics simulations. As shown in , the verproside on mTyr remains bound to the active site, consistent with the docking simulation results. However, the verproside on hTyr dissociates from the active site and moves independently in proximity to the protein (Supplementary material Figure S7). To perform a detailed analysis, we measured the interaction distance between verproside and the key residues suggested by the docking simulation during the MD simulation. As the verproside consists of three rings, we divided it into three groups, as shown in , to observe which parts remain fixed in the active site and which parts began to enter the pocket. illustrates that Group 1 (G1) serves as the anchor region of the verproside. It tightly interacts with HIS259, ASN260, HIS263, PHE264, SER282, VAL283, PRO284, and ALA286 within the pocket. These distances remain stable with minimal fluctuations, indicating that the binding is well-organised. G2 also maintains a well-packed position within the pocket. However, G3 shows weaker binding to some residues, and the distances are significantly greater (over 10 Å) from the pocket. In summary, the interaction between verproside and the protein’s residues corresponds well with the results obtained from the docking simulation. The distances are well-maintained, ensuring tight binding to the active site. Notably, G1 serves as the anchor region for inhibiting mTyr, and the key residues show a strong match on the docking results. However, the opposite trend was observed for the results obtained with verproside and hTyr (Supplementary material Figure S7). Experimental data reveals that hTyr-verproside exhibits higher IC50 values, indicating weaker binding affinity. Even though the docking simulation suggested that verproside on hTyr is a potent inhibitor of hTyr, the subsequent MD simulation revealed that verproside exhibits weaker binding to hTyr, which aligns well with the experimental findings. As part of the MD simulation validations, we assessed Root Mean Square Deviation (RMSD) and Radius of Gyration (Rgyr) over time, as well as Root Mean Square Fluctuation (RMSF) as a function of residue number. Supplementary material Figure S8 demonstrates that both tyrosinases maintained their structural integrity throughout the simulation.
Figure 6. Molecular dynamics simulation results. (A) The final structures of mTyr-verproside complex. The tyrosinases are depicted using a grey surface model, while the active site revealed by docking simulation is coloured yellow. The verproside is represented by a blue stick model. For clarity, the explicit water models and counter ions are not included in the figure. (B) Verproside grouping. The centre of geometry (COG) of the atoms comprising the rings was utilised to measure the interacting distance. The measurement was conducted between the COG and the alpha Carbon atom of the interacting residues. (C) The interaction distance between verproside and mTyr. It consists of 33 sub-panels, each displaying the distance-time profile (X-axis: time from 0 to 100 ns; Y-axis: distance from 0 to 20 Å). The Y panel is divided into three groups, namely G1, G2, and G3, as mentioned in . The red dotted line represents the distance of 10 Å, which serves as the lower limit distance.
In summary, the structure–activity studies revealed that iridoids from P. rotundum var. subintegrum are potent competitive inhibitors with a chemospecific inhibition mechanism. Verproside (1), which possesses two hydroxyl groups on the upper phenyl ring, worked through the enzyme isomerisation model with slow binding.
Conclusion
The current experiments evaluating enzyme binding affinity were used to tentatively identify inhibitors of a particular enzyme because an enzyme–inhibitor complex must be formed for inhibition to occur. Thus, these iridoids inhibit tyrosinase activity through multiple mechanisms, which are mainly dependent on the hydroxyl group(s) on the upper phenyl ring and the C-7 substituent. Among these, dramatic differences in the binding affinity, docking simulations and IC50 values were observed, with the most notable compound being 1 (active site = 43, IC50 = 31.5 µM). Verproside-mediated inhibition of tyrosinase is reversible, but this interaction also disrupts the active site competitively, and verproside also interacts with the hydrophilic portion of the enzyme surrounding the active site. The inhibition kinetics analysed by Lineweaver-Burk plots indicated that verproside is a competitive, slow-binding inhibitor, and the Ki was determined to be 5.1 μM. Thus, verproside (1) is a competitive inhibitor with a chemo-specific inhibition mechanism that operates via the enzyme isomerisation model. Additional well-known tyrosinase hyperactivity inhibitors include compounds such as hydroquinone (mutagenic, dermatitis, and irritation), arbutin (unstable), L-ascorbic acid (degradation), kojic acid (carcinogenic), and ellagic acid (solubility). However, these inhibitors exhibit many side effects. Therefore, the plant-derived tyrosine inhibitors, verproside, studied herein displayed the most potent inhibition profiles, suggesting that these inhibitors are excellent therapeutic candidates to prevent excessive melanin production and accumulation for the treatment of melasma, freckles, ephelides, and solar lentigines.
Supplemental Material
Download PDF (3.8 MB)The authors report no conflicts of interest.
Disclosure statement
Additional information
Funding
References
- Lee AY. Skin pigmentation abnormalities and their possible relationship with skin aging. Int J Mol Sci. 2021;22(7):3727.
- Woo S-Y, Hoshino S, Wong CP, Win NN, Awouafack MD, Ngwe H, Zhang H, Hayashi F, Abe I, Morita H, et al. Lignans with melanogenesis effects from Premna serratifolia wood. Fitoterapia. 2019;133:35–42.
- Cui Y, Hu Y-H, Yu F, Zheng J, Chen L-S, Chen Q-X, Wang Q. Inhibition kinetics and molecular simulation of p-substituted cinnamic acid derivatives on tyrosinase. Int J Biol Macromol. 2017;95:1289–1297.
- Solano F, Briganti S, Picardo M, Ghanem G. Hypopigmenting agents: an updated review onbiological, chemical and clinical aspects. Pigment Cell Res. 2006;19(6):550–571.
- Fernandes MS, Kerkar S. Microorganisms as a source of tyrosinase inhibitors: a review. Ann Microbiol. 2017;67(4):343–358.
- Page MJ, Cera ED. Role of Na+ and K+ in enzyme function. Physiol Rev. 2006;86(4):1049–1092.
- Chang TS. An updated review of tyrosinase inhibitors. Int J Mol Sci. 2009;10(6):2440–2475.
- Zaidi KU, Ali AS, Ali SA, Naaz I. Microbial tyrosinases: promising enzymes for pharmaceutical, food bioprocessing, and environmental industry. Biochem Res Int. 2014;2014:854687–16.
- Ha TJ, Tamura S, Kubo I. Effects of mushroom tyrosinase on anisaldehyde. J Agric Food Chem. 2005;53(18):7024–7028.
- Atanasov AG, Waltenberger B, Pferschy-Wenzig E-M, Linder T, Wawrosch C, Uhrin P, Temml V, Wang L, Schwaiger S, Heiss EH, et al. Discovery and resupply of pharmacologically active plant-derived natural products: a review. Biotechnol Adv. 2015;33(8):1582–1614.
- Liu Z. Preparation of botanical samples for biomedical research. Endocr Metab Immune Disord Drug Targets. 2008;8(2):112–121.
- Efferth T, Koch E. Complex interactions between phytochemicals. The multi-target therapeutic concept of phytotherapy. Curr Drug Targets. 2011;12(1):122–132.
- Lee DH. CONET: a virtual human system-centered platform for drug discovery. Front Comput Sci. 2018;12(1):1–3.
- Xiao Y, Zhang Z. Recent advances in small molecular modulators targeting histone deacetylase 6. Future Drug Discov. 2020;2:53.
- Zuo G, Wang Z, Quispe YNG, Hwang SH, Kim HY, Kang BG, Lim SS. Target guided isolation of potential tyrosinase inhibitors from Otholobium pubescens (Poir.) J.W. Grimes by ultrafiltration, high-speed countercurrent chromatography and preparative HPLC. Ind Crops Prod. 2019;134:195–205.
- Chen G, Huang BX, Guo M. Current advances in screening for bioactive components from medicinal plants by affinity ultrafiltration mass spectrometry. Phytochem Anal. 2018;29(4):375–386.
- Chen G, Guo M. Rapid screening for α-glucosidase inhibitors from Gymnema sylvestre by affinity ultrafiltration–HPLC-MS. Front Pharmacol. 2017;8:228.
- Jonker N, Kool J, Irth H, Niessen WMA. Recent developments in protein–ligand affinity mass spectrometry. Anal Bioanal Chem. 2011;399(8):2669–2681.
- Hou X, Sun M, Bao T, Xie X, Wei F, Wang S. Recent advances in screening active components from natural products based on bioaffinity techniques. Acta Pharm Sin B. 2020;10(10):1800–1813.
- Chen Y, Yu H, Wu H, Pan Y, Wang K, Jin Y, Zhang C. Characterization and quantification by LC-MS/MS of the chemical components of the heating products of the flavonoids extract in pollen typhae for transformation rule exploration. Molecules. 2015;20(10):18352–18366.
- Shu P, Yu M, Zhu H, Luo Y, Li Y, Li N, Zhang H, Zhang J, Liu G, Wei X, et al. Two new iridoid glycosides from Gardeniae Fructus. Carbohydr Res. 2021;501:108259.
- Saidi I, Baccari W, Marchal A, Waffo-Téguo P, Harrath AH, Mansour L, Jannet HB. Iridoid glycosides from the Tunisian Citharexylum spinosum L.: Isolation, structure elucidation, biological evaluation, molecular docking and SAR analysis. Ind Crops Prod. 2020;151:112440.
- Wang Z, Wang N, Han D, Yan H. Characterization of tyrosinase inhibitors in Dryopteris crassirhizoma rhizome using a combination of high-speed counter-current chromatography, affinity-based ultrafiltration, and liquid chromatography–tandem mass spectrometry. Front Nutr. 2022;9:862773.
- Mann T, Gerwat W, Batzer J, Eggers K, Scherner C, Wenck H, Stäb F, Hearing VJ, Röhm KH, Kolbe L. Inhibition of human tyrosinase requires molecular motifs distinctively different from mushroom tyrosinase. J Invest Dermatol. 2018;138(7):1601–1608.
- Lomenick B, Olsen RW, Huang J. Identification of direct protein targets of small molecules. ACS Chem Biol. 2011;6(1):34–46.
- Park MH, Jung S, Yuk HJ, Jang H-J, Kim WJ, Kim D-Y, Lim GTae, Lee J, Oh S-R, Lee SU, et al. Rapid identification of isoprenylated flavonoids constituents with inhibitory activity on bacterial neuraminidase from root barks of paper mulberry (Broussonetia papyrifera). Int J Biol Macromol. 2021;174:61–68.
- Copeland EA. Enzyme: a practical introduction to structure, mechanism, and data analysis. 2nd ed. New York (NY): Wiley-VCH; 2000.
- Frieden C. Kinetic aspects of regulation of metabolic processes. J Biol Chem. 1970;245(21):5788–5799.
- Trott O, Olson AJ. AutoDock Vina: improving the speed and accuracy of docking with a new scoring function, efficient optimization, and multithreading. J Comput Chem. 2010;31(2):455–461.
- Brooks BR, Brooks CL, Mackerell AD, Nilsson L, Petrella RJ, Roux B, Won Y, Archontis G, Bartels C, Boresch S, et. al. CHARMM: the biomolecular simulation program. J Comput Chem. 2009;30(10):1545–1614.
- Morrison JF, Walsh CT. The behavior and significance of slow binding enzyme inhibitors. Adv Enzymol Relat Areas Mol Biol. 1988;61:201–301.
- Sculley MJ, Morrison JF, Cleland WW. Slow-binding inhibition: the general case. Biochim Biophys Acta. 1996;1298(1):78–86.
- Song H-H, Shin I-S, Woo SY, Lee SU, Sung MH, Ryu HW, Kim D-Y, Ahn K-S, Lee H-K, Lee D, et al. Piscroside C, a novel iridoid glycoside isolated from Pseudolysimachion rotundum var. subinegrum suppresses airway inflammation induced by cigarette smoke. J Ethnopharmacol. 2015;170:20–27.
- Li CM, Zhang XL, Xue XY, Zhang FY, Xu Q, Liang XM. Structural characterization of iridoid glycosides by ultra-performance liquid chromatography/electrospray ionization quadrupole time-of-flight tandem mass spectrometry. Rapid Commun Mass Spectrom. 2008;22(12):1941–1954.
- Dong J, Wang H, Wan LR, Hashi Y, Chen SZ. Identification and determination of major constituents in Polygonum cuspidatum Sieb. et Zucc by high performance liquid chromatography/electrospray ionization-ion trap/time-of-flight mass spectrometry. Chin J Chromatogr. 2009;27:425–430.
- Gębalski J, Graczyk F, Załuski D. Paving the way towards effective plant-based inhibitors of hyaluronidase and tyrosinase: a critical review on a structure–activity relationship. J Enzyme Inhib Med Chem. 2022;37(1):1120–1195.
- Obaid RJ, Mughal EU, Naeem N, Sadiq A, Alsantali RI, Jassas RS, Moussa Z, Ahmed SA. Natural and synthetic flavonoid derivatives as new potential tyrosinase inhibitors: a systematic review. RSC Adv. 2021;11(36):22159–22198.
- Al-Rooqi MM, Sadiq A, Obaid RJ, Ashraf Z, Nazir Y, Jassas RS, Naeem N, Alsharif MA, Shah SWA, Moussa Z, et al.,. Evaluation of 2,3-dihydro-1,5-benzothiazepine derivatives as potential tyrosinase inhibitors: in vitro and in silico studies. ACS Omega. (19)2023;8(19):17195–17208.
- Alsantali RI, Mughal EU, Naeem N, Alsharif MA, Sadiq A, Ali A, et al. Flavone-based hydrazones as new tyrosinase inhibitors: Synthetic imines with emerging biological potential, SAR, molecular docking and drug-likeness studies. J Mol Struct. 2022;1251:13193.
- Mughal EU, Ashraf J, Hussein EM, Nazir Y, Alwuthaynani AS, Naeem N, Sadiq A, Alsantali RI, Ahmed SA. Design, synthesis, and structural characterization of thioflavones and thioflavonols as potential tyrosinase inhibitors: in vitro and in silico studies. ACS Omega. 2022;7(20):17444–17461.
- Alshaye NA, Mughal EU, Elkaeed EB, Ashraf Z, Kehili S, Nazir Y, Naeem N, Abdul Majeed N, Sadiq A. Synthesis and biological evaluation of substituted aurone derivatives as potential tyrosinase inhibitors: in vitro, kinetic, QSAR, docking and drug-likeness studies. J Biomol Struct Dyn. 2022;18:1–16.
- Dolinska MB, Kovaleva E, Backlund P, Wingfield PT, Brooks BP, Sergeev YV. Albinism-causing mutations in recombinant human tyrosinase alter intrinsic enzymatic activity. PLOS One. 2014;9(1):e84494.