
 ?Mathematical formulae have been encoded as MathML and are displayed in this HTML version using MathJax in order to improve their display. Uncheck the box to turn MathJax off. This feature requires Javascript. Click on a formula to zoom.
ABSTRACT
Background
The influenza vaccine administrated every year is a recommended infection control procedure for individuals above the age of six months. However, the effectiveness of repeated annual vaccination is still an active research topic. Therefore, we investigated the vaccine immunogenicity in two independent groups: previously vaccinated versus non-vaccinated individuals at three time points; prior vaccination, one week and three months post vaccination. The assessment enabled us to evaluate the elicited immune responses and the durability of the induced protection in both groups.
Research Design and Methods
A research study was conducted to assess the immunogenicity of a single dose of Trivalent Inactivated Influenza Vaccine (A/H1N1, A/H3N2, and B) in 278 healthy adults aged between 32 and 66 years. Almost half of the participants, 140 (50·36%), received influenza vaccination at least once precursor to past influenza seasons. One blood sample was taken prior to vaccination for complete blood analysis and baseline immunogenicity assessment. The selected study participants received a single vaccine dose on the first day, and then followed up for three months. Two blood samples were taken after one week and three months post vaccination, respectively, for vaccine immunogenicity assessment.
Results
Before vaccination, the seroprotection, defined as a hemagglutination-inhibiting titer of =>1:40, was detected for the three vaccine virus strains in 20 previously vaccinated participants (14·29%) [8·95%, 21·2%]. We compared the overall vaccine response for the three virus strains using a normalized response score calculated from linearly transformed titer measurements; the score before vaccination was 84% higher in the previously vaccinated group and the mean difference between the two groups was statistically significant. Three months post-vaccination, we didn’t find a significant difference in vaccine responses; the number of fully seroprotected individuals became 48 (34·29%) [26·48%, 42·77%] in the previously vaccinated group and 59 (42·75%) [34·37%, 51·45%] in the non-vaccinated group. The calculated response score was almost equal in both groups and the mean difference was no longer statistically significant.
Conclusion
Our findings suggest that a single dose of influenza vaccine is equally protective after three months for annually vaccinated adults and first-time vaccine receivers.
1. Introduction
The influenza virus is a contagious respiratory pathogen which can affect the entire population when it breaks out. Influenza can cause severe complications in healthy individuals of any age [Citation1]. People in certain risk groups (e.g. the elderly and individuals with chronic conditions) have higher chances of developing more severe complications such as fulminant pneumonia [Citation2]. Despite the availability of antiviral drugs for influenza and its related complications, annual vaccination before the influenza season remains the most effective method of minimizing the rate of infection. Influenza vaccines are associated with lower rates of laboratory-confirmed influenza illness as well as clinical influenza-like illness among children [Citation3–5], healthy adults under the age of 65 [Citation6–8], and healthy older adults [Citation9].
Repeated influenza vaccination given to older adults, categorized according to their level of risk (high-risk individuals with heart or lung diseases, intermediate-risk individuals with diabetes, renal disease, stroke, dementia, rheumatologic diseases, and low-risk healthy individuals), led to significant reductions in hospitalizations for pneumonia and all-cause mortality. Specifically, there was a 29% reduction in hospitalizations for pneumonia among high-risk individuals, a 32% reduction among intermediate-risk individuals, and a 49% reduction among low-risk healthy individuals. Additionally, there was a 49% reduction in all-cause mortality among high-risk individuals, a 64% reduction among intermediate-risk individuals, and a 55% reduction among low-risk healthy individuals [Citation10].
Influenza vaccine strain compositions are updated annually for administrating vaccine antigens that are as close as possible to the circulating strains, which makes yearly vaccination a recommended infection control procedure. However, multiple studies have raised concerns about the effect of repeated annual influenza vaccination. Clinical trials reported contradicting evidence about reduced antibody response associated with repeated vaccination [Citation11,Citation12]. In contrast, systematic reviews and meta- analyses found no significant reduction in vaccine effectiveness with repeated vaccinations [Citation13,Citation14]. Therefore, to better understand the implications of repeated vaccinations and the subsequent elicited immune responses, experts believe that further investigations are required.
In Japan, a study was conducted in 2011/2012 to assess the immunogenicity of a single dose of the trivalent inactivated influenza vaccine (TIIV) (A/H1N1, A/H3N2, and B) in healthy Japanese adults. Hemagglutination-inhibiting titer measurements were taken at three time points: prior to vaccination, then 7 days and 90 days post-vaccination. The aim of this study was to compare and assess the vaccine immunogenicity in two independent groups: previously vaccinated versus non-vaccinated participants. It was also to determine the group that would achieve better and longstanding serotype protection against the three virus strains. We assessed seroprotection based on serum strain-specific antibodies, performed a stratified analysis for each virus strain using inferential statistics, and defined a vaccine overall response score for the three virus strains to quantify the difference between the two groups using a linear mixed-effects model for repeated measures.
2. Methods
2.1. Study design
A research study was conducted to assess the immunogenicity of a single dose of TIIV (A/California/7/2009 (H1N1) pdm09, A/Victoria/210/2009 (H3N2), and B/Brisbane/60/2008) in healthy Japanese adults. The vaccine compositions included the virus strains that were circulating in Japan and overseas in the influenza season of 2010/2011 and was expected in the season of 2011/2012. Influenza viruses that were isolated during the 2011/2012 influenza season were consistent with the vaccine compositions and consisted mainly of subtype H3N2 (71%), H1N1pdm09 (0·2%), and type B (28%). The influenza type B viruses consisted of the Victoria and Yamagata lineages and were isolated in a ratio of 2:1.
Prior to vaccination, the participants wrote an informed written consent and answered a questionnaire about their overall health, allergic status, and previous influenza vaccinations. The participants received a TIIV single dose (1 mL/vial) on the first day and were then followed up for three months. One blood sample was taken prior to vaccination (day 0) for complete blood analysis and baseline immunogenicity assessment, two blood samples were taken at day 7 and day 90 post vaccination, respectively, for vaccine immunogenicity assessment. The study protocol was approved by the Ethics Committee of Kyoto University Graduate School and Faculty of Medicine.
2.2. Participants
In Japan, inactivated influenza vaccines are administrated yearly. Trivalent inactivated influenza vaccines (TIIV) (A/H1N1, A/H3N2, and B) were administrated until the 2014/2015 influenza season. This study was conducted during the 2011/2012 influenza season to assess the immunogenicity of a single dose of the trivalent inactivated influenza vaccine in healthy Japanese adults. The study participants included 278 Japanese healthy individuals residing in Nagahama City, Japan: 183 (65·83%) female and 95 (34·17%) male participants, aged between 32 and 66 years (Mean = 55·62 and SD = 9·00). Almost half of the participants, 140 (50·36%), had received influenza vaccination at least once prior to past influenza seasons and didn’t report major side effects after getting the vaccine. The vaccine virus strains administrated in each influenza season from the 2001/2002 season to 2010/2011 before this study are listed in Supplementary File-1.
2.3. Measurements
The influenza virus is an enveloped virus with a segmented single-strand RNA genome of negative polarity. There are four types of influenza viruses: A, B, C, and D. These viruses are further subdivided into subtypes and strains depending on the characteristics of the virus surface proteins. Influenza A and B viruses are the types that cause seasonal epidemics in humans. Trivalent inactivated vaccines involve virus purification which leaves viral hemagglutinin (HA) and neuraminidase (NA) glycoproteins [Citation15] from two subtypes of influenza A viruses (H1N1 and H3N2) and one subtype of influenza B viruses. HA is a trimeric glycoprotein responsible for the attachment of the virus to the surface of the host cell by binding it to sialic acid receptors [Citation16]; HA remains the main target of current inactivated influenza vaccines (IIVs). The vaccine administration generates hemagglutination-inhibiting antibodies as an immune response that prevents infection by disrupting the binding of the virus to host receptors [Citation17]. Hemagglutination-inhibiting (HAI) antibodies immunological assay (SRL, Inc., Tokyo, Japan), also called HAI titer, is the most common serological test available for assessing influenza vaccine response. HAI titer value of =>1:40 is generally accepted to be associated with a 50% reduction in the risk of illness [Citation18] and could be regarded as a seroprotection threshold value.
We used hemagglutination-inhibiting titer measurements transformed to a linear scale as an ordinal score to assess the vaccine immunogenicity for each influenza virus strain. This transformed titer score has a minimum value of 0 and a maximum value of 8; the seroprotection threshold value is 3 (0;1:1 < 10, 1;1:10, 2;1:20, 3;1:40, 4;1:80, 5;1:160, 6;1:320, 7;1:640 and 8;1:1280). In addition to the per virus strain titer score, we computed three specific scores as an overall assessment for the trivalent inactivated vaccine: (1) Day 0 score, a baseline numerical normalized score computed as an average of the HAI titer ordinal scores of the three virus strains added to a weight corresponding to seroprotection level prior to vaccination; (2) Day 7 score, a short term numerical normalized score computed as an average of the HAI titer ordinal response scores of the three virus strains added to a weight corresponding to seroprotection level at one week post-vaccination; (3) Day 90 score, a long term numerical normalized score computed as an average of the HAI titer ordinal response scores of the three virus strains added to a weight corresponding to seroprotection level at three months post-vaccination. Day 90 score takes into account the titer response after 7 days.
In summary, the calculation of the response scores follows a three-step procedure. First, the titer measurements undergo a linear transformation, where values ranging from 0 to 8 are assigned corresponding to the dilution factors (0;1:1 < 10, 1;1:10, 2;1:20, 3;1:40, 4;1:80, 5;1:160, 6;1:320, 7;1:640 and 8;1:1280). Second, an amplified weighted average is calculated by adding a constant weight to the linearly transformed titer measurements. This constant weight reflects the individual’s seroprotection level. Third, score normalization using the ordered quantile (ORQ) normalization transformation:
Where Φ refers to the standard normal cumulative distribution function, rank(x) refers to each observation’s rank, and length(x) refers to the number of observations.
2.4. Statistical methods
Descriptive statistical methods used for summarizing the main characteristics of study participants included: the number of participants and percentage of participants in each group, average age with a 95% confidence interval (CI), and gender ratio with 95% binomial CI. Inferential statistical methods used for assessing the difference in immunogenicity between the two groups are as follows: the Mann-Whitney test compared medians of ordinal titer scores for each virus subtype; a chi-squared test compared number and percentage of seroprotected participants for each virus strain; Welch’s two-sample t-test compared means of normalized scores assessing the trivalent inactivated vaccine overall responses; a linear mixed-effects model [Citation19] quantified the difference in vaccine response between both groups by including repeated measurements and previous vaccination status as fixed effects and individual differences among participants as random effects. The mixed-effects model, also known as multilevel regression modeling, is a robust statistical approach that proves valuable when analyzing data gathered from distinct groups or when multiple measurements are acquired from the same individuals. This modeling technique effectively addresses the within-group variations or differences between individuals. We applied this multi-level approach using two levels of regression models: a first-level that predicts the vaccine response score based on the day the titer measurement was taken, and a separate second-level regression model that is fitted for each participant based on their characteristics and previous vaccination status. The score-level regression and participant-level regression are the two levels of this multilevel model that allow for predicting the response score for each participant. The model equations as a varying-intercept model comprise two levels: a first level in the form of a linear regression predicting scores from score-level predictors with an intercept that can vary based on individuals, and a second level that predicts the variable intercepts from individual-level predictors:
for i = 1, … , 834 and j = 1, … 278,
Where j[i] indexes the score i of person j, is the variable intercept of the score-level regression,
is the vector of coefficients for the score-level regression,
is the vector of coefficients for the individual-level regression,
is the standard deviation of individual-level errors.
A p-value of 0.05 was considered as a threshold for statistical significance. Univariate tests and regression models were generated using R (The R Foundation for Statistical Computing, Vienna, Austria, www.r-project.org).
3. Results
3.1. Demographic characteristics and baseline immunogenicity
A total of 278 participants were recruited to receive a single dose of TIIV: a vaccinated group of 140 (50·36%) had received at least one or more doses of influenza vaccination prior to past influenza seasons, and a non-vaccinated group of 138 (49·64%) received the vaccine for the first time mainly for this study. Among all the participants, the average age was 55·62 years and the percentage of females (65·83%) was higher than that of males (34·17%).
The average age of the vaccinated group (53·96 years) was somehow lower than that of the non-vaccinated group (57·31 years), and the gender ratio was almost similar in both groups. Participants’ demographics are summarized in .
Table 1. Summary of demographic characteristics for the study participants.
The baseline immunogenicity was in favor of the vaccinated group mainly due to previous exposure to influenza vaccines, while the non-vaccinated group acquired seroprotection against disparate strains due to previous natural influenza infections. The number of seroprotected participants against H1N1 in the vaccinated group was 68 (48·57%) versus 23 (16·66%) participants in the non-vaccinated group, and the H1N1 ordinal score median difference between the two groups was statistically significant (); 56 (40·0%) participants in the vaccinated group were seroprotected against H3N2 versus 10 (7·25%) participants in the non-vaccinated group, and the H3N2 ordinal score median difference was statistically significant (); 59 (42·14%) participants in the vaccinated group were seroprotected against B1 versus 20 (14·49%) participants in the non-vaccinated group, and the ordinal score median difference between the two groups was also statistically significant (). Among the three strains, protection against H1N1 was the highest which may indicate more conserved HA epitopes. This was previously demonstrated during the 2009 H1N1 influenza outbreak when elder people were protected from severe disease complications and mortality due to preexisting immunity against conserved and variable epitopes of HA [Citation20,Citation21]. On the contrary, protection against H3N2 was the lowest which may indicate fewer conserved HA epitopes. Gouma, S. et al. [Citation22] reported related findings when they noted that antibodies isolated from subjects elicited by H3N2 viruses in the 1960s and 1970s do not neutralize recent H3N2 viruses.
Figure 1. Transformed titre ordinal score mapped to the original titre measurement at day 0 for H1N1 virus strain (sub-figure A), H3N2 virus strain (sub-figure B), and B1 virus strain (sub-figure C) in vaccinated and non-vaccinated groups, respectively. Overall vaccine response scores at day 0 (sub-figures D and E) in vaccinated and non-vaccinated groups, respectively. The calculated response score provided informative visualization that clearly shows higher scores and better seroprotection among previously vaccinated participants.
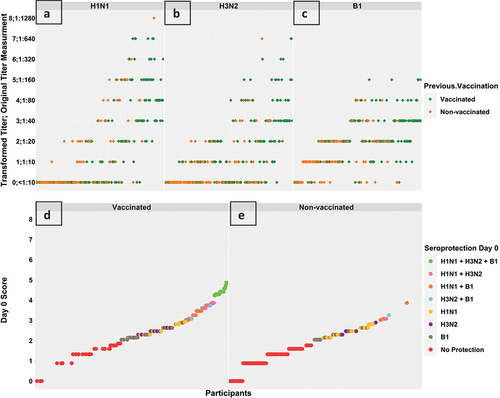
The overall vaccine response normalized score mean difference between the two groups was statistically significant, and 20 (14·29%) participants among the vaccinated group were seroprotected against the three virus strains versus no participants among the non-vaccinated group (). Participants’ baseline immunogenicity are summarized in .
Table 2. Summary of baseline immunogenicity for the study participants. Statistical tests are used to inspect the differences between the vaccinated and non-vaccinated groups; the Mann-Whitney test compares the mean ranks of the transformed titer ordinal scores, the Chi-squared examines the differences between the number of seroprotected participants, and the Welch two Sample t-test compares the mean of the overall vaccine response score.
The study was conducted during the influenza season of 2011/2012 with 298 participants between the ages of 32 and 66 years, infering that each participant experienced at least one pandemic of influenza [Citation23]. Participants under 35 years old encountered the H1N1/09 influenza pandemic in 2009 and participants who were younger than 55 years old went through the 1977 Russian H1N1 influenza pseudo-pandemic which affected people under 25 years of age. Senior participants above 55 years old were affected by the 1968 Hong Kong H3N2 influenza pandemic in and the 1957 Asian H2N2 influenza pandemic.
Assessment of baseline seroprotection stratified by age groups revealed only 9 participants under the age of 35 years and out of them eight particiapnts received influenza vaccination previously, the sole non-vaccinated participant was seroprotected against the H1N1 strain, which could have been acquired during the 2009 pandemic. The age group of 35 to 55 years included a total of 103 participants. Out of them, 45 did not receive influenza vaccination previously. Among these 45 unvaccinated participants, 14 (31·1%) were seroprotected against the H1N1 strain, 1 (2·2%) was serorprotected against the H3N2 strain and 9 (20·0%) were serorprotected against the B1 strain. Seroprotection against H3N2 influenza strain appeared to be rare among individuals under the age of 55 years who had not received a previous vaccination, which could be attributed to their limited exposure to H3N2 influenza pandemics. The group of senior participants above 55 years was the largest group and included a total of 166 participants. Out of them, 92 didn’t receive influenza vaccination previously. Among these 92 unvaccinated participants, 8 (8·7%) were seroprotected against the H1N1 strain, 9 (9·78%) were serorprotected against the H3N2 strain and 11 (11·96%) were serorprotected against the B1 strain. Participants’ baseline immunogenicity stratified by age groups are summarized in .
Table 3. Summary of baseline seroprotection stratified by age groups of participants.
3.2. Vaccination immunogenicity
The response to TIIV is characterized by the generation of long-lived antibody-secreting plasma cells and memory B cells; both cell subsets arise from activation of naïve B cells in the case of primary exposure to the vaccine or memory B cells together with activated naïve B cells in the case of repeated exposure. In this study, after receiving a single dose of TIIV, the three titer score measurements and the number of seroprotected participants increased in both groups (). The number of seroprotected participants against H1N1 in the vaccinated group increased from 68 (48·57%) to 98 (70·0%) at day 7 and then decreased to 88 (62·86%) at day 90, whereas the number in the non-vaccinated group increased from 23 (16·66%) to 76 (55·07%) at day 7, then further increased to 95 (68·84%) at day 90. The H1N1 ordinal score median difference between the two groups became statistically insignificant at day 7 and remained insignificant at day 90 (). H3N2 showed a similar response pattern as H1N1; the number of seroprotected participants among the vaccinated group increased from 56 (40·0%) to 93 (66·43%) at day 7 and then decreased to 88 (62·86%) at day 90, whereas the number in the non-vaccinated group increased from 10 (7·25%) to 58 (42·03%) at day 7, then further increased to 95 (68·84%) at day 90. The H3N2 ordinal score median difference between the two groups remained statistically significant at day 7 and became insignificant at day 90 (). This increase in antibody response at day 7 in the vaccinated group followed by a slight decrease at day 90 could be explained by the production of a huge first wave of antibodies secreted by transient antibody secreting cells originating from memory B cells which peaks in the periphery at day 7 after booster vaccination [Citation24]. The antibody response at day 90 in both groups could be explained by the production of long-lived plasma cells that migrated and resided in the bone marrow [Citation25].
Figure 2. Titre response scores at day 0, day 7, and day 90 against the H1N1 virus strain (sub-figure A), H3N2 virus strain (sub-figure B), and B1 virus strain (sub-figure C) in vaccinated and non-vaccinated groups, respectively. The box plots in subfigure a show an increase in H1N1 score among both groups at day 7, then the median score of the vaccinated group slightly decreased at day 90; more participants from the non-vaccinated group showed an increase in score and the median score of the non-vaccinated group increased further at day 90. The box plots in subfigure B shows a similar response pattern for H3N2 response but median scores for the vaccinated group were equal at day 7 and day 90. The box plots in subfigure C shows an increase in the score at day 7 and day 90 in both groups.
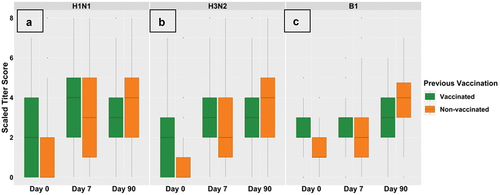
Table 4. Immunogenicity at Day 7 and Day 90 for the study participants. Statistical tests are used to inspect the differences between the vaccinated and non-vaccinated groups.
The B virus showed a slightly different response pattern from influenza A virus strains. The number of seroprotected participants among the vaccinated group increased from 59 (42·14%) to 77 (55·0%) at day 7, then increased to 103 (73·6%) at day 90, whereas the number among the non-vaccinated group increased from 20 (14·49%) to 56 (40·58%) at day 7, then increased to 112 (81·16%) at day 90. B ordinal score median difference between the two groups became statistically insignificant at day 7 and remained insignificant at day 90 (). The B strain antibody response in both groups could suggest lower production of transient antibody secreting cells than for the A strain, and that a major proportion of activated B cells either from naïve or memory subpopulations are recruited into a secondary germinal center for affinity maturation and clonal selection in order to produce long-lived plasma cells and memory cells.
We compared the overall normalized score as an assessment of the response to the trivalent inactivated vaccine in the two groups. After 7 days of receiving the vaccine, the score was higher in the vaccinated group and the mean difference between the two groups was statistically significant. This result was reflected in the number of seroprotected participants: 48 (34·29%) participants in the vaccinated group were seroprotected against the three virus strains () versus 19 (13·77%) participants in the non-vaccinated group (). However, after 90 days of receiving the vaccine, the immune response was similar in the two groups. The three titer score measurements increased in the non-vaccinated group and compensated for the persistent difference with the vaccinated group on day 0 and day 7. The number of seroprotected participants against the three virus strains was 48 (34·29%) in the vaccinated groups () and increased to 59 (42·75%) in the non-vaccinated group (). The overall normalized score mean difference between the two groups was not statistically significant at day 90. Vaccine immunogenicity after 7 and 90 days of receiving the vaccine is summarized in .
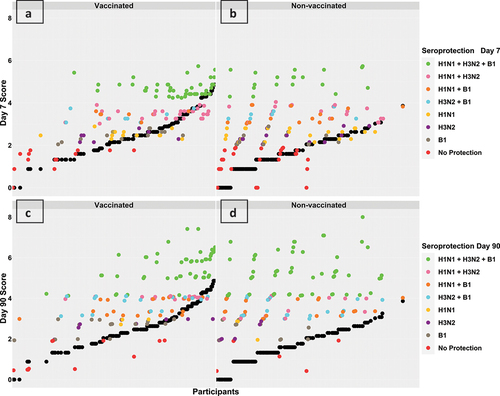
Figure 3. Overall response scores at day 7 (sub-figures a and B) and day 90 (sub-figures C and D) in vaccinated and non-vaccinated groups, respectively. Each participant’s score is represented by two points aligned vertically, a black point representing the participant’s score prior to vaccination (day 0) and a coloured point representing the corresponding score post-vaccination (day 7 or day 90). The colours are mapped according to the participant’s seroprotection level. Prior to vaccination, the average baseline scores were higher in the vaccinated group (black points in sub-figure a versus B and black points in sub-figure C versus D). Post- vaccination, the majority of participants in both groups showed an increase in their response scores as coloured points were vertically aligned over black points. Figures a and C show that vaccinated group participants with higher baseline scores seemed to have robust responses, while figures B and D show that non-vaccinated group participants seemed to have a uniform increase in response scores independent of baseline scores.
We used the linear mixed-effects model to assess the overall vaccine response scores as repeated measures and their dependency on three main fixed effects: participants’ previous vaccination status (vaccinated vs. non-vaccinated), the time point of taking the measurement (Day 0, Day 7, or Day 90), and effect modification of previous vaccination on measurement values collected at a certain time point (DayVaccination). Individual differences between participants such as age, gender, and underlying health condition were modeled as random effects.
The fitted model estimated about 32·44% of the variation to be due to fixed effects and 55·9% due to random effects. Considering individual differences, the model estimated the average response score before vaccination to be 84% higher in the vaccinated group; the average score was 2·76 in the vaccinated group versus 1·51 in the non-vaccinated group. After 7 days of receiving the vaccine, the average response score became 20.6% higher in the vaccinated group; the average score was 3·45 in the vaccinated group versus 2·86 in the non-vaccinated group. After 90 days of receiving the vaccine, the average response score was estimated to be equal in both groups; the average score was 3·97 in the vaccinated and non-vaccinated groups () which reflects very similar vaccine response in the two groups. The fixed effects coefficients and random effects variances are shown in .
Figure 4. Repeated measurements of the vaccine response scores in vaccinated and non-vaccinated groups, respectively. The distributions at day 0 showed a clearly higher average score in the vaccinated group which remained slightly higher at day 7. The score distributions at day 90 seemed to be very similar in both groups with equal means.
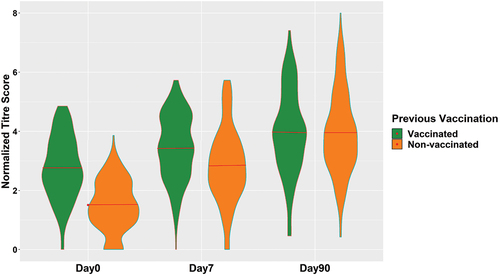
Table 5. Summary of mixed effect model parameters.
3.3. Assessment of short-term responders and non-responders to vaccine
After three months from the administration of a single shot of TIIV, there was no significant difference in the count of seroprotected participants between those who were administered the vaccine for past influenza seasons and those who received the vaccine for the first time. Nonetheless, there are participants in both groups who didn’t exhibit the desired response to the vaccine. Few participants were able to attain seroprotection within 7 days, but subsequently lost it after 90 days (short-term responders), while others were unable to achieve seroprotection over the span of 90 days (non-responders). We assessed the vaccine response at day 90 against each virus strain within two smaller subsets of participants. The first subset consisted of participants who initially lacked seroprotection at day 0 but subsequently achieved seroprotection by day 7, their loss of seroprotection by day 90 would signify a short-term response (). The second subset consisted of participants who initially lacked seroprotection at day 0 and remained non-seroprotected till day 7, their inability to respond by day 90 would indicate a non-response to the vaccine ().
Table 6. Summary of post-vaccination seroprotection at Day 90 for a subset of non seroprotected participants at Day 0 then achieved seroprotection post-vaccination at Day 7. The Chi-squared test examines the differences between the number of seroprotected participants between the vaccinated and non-vaccinated groups.
Table 7. Summary of post-vaccination seroprotection at Day 90 for a subset of participants non seroprotected prior vaccination at Day 0 and not achieving serprotection post-vaccination at Day 7. The Chi-squared test examines the differences between the number of seroprotected participants between the vaccinated and non-vaccinated groups.
At day 7, there were 34 seroprotected participants against H1N1 in the vaccinated group who were not seroprotected before vaccination, of those, 23 (67·65%) maintained the acquired seroprotection till day 90 and 11 (32·35%) were classified as short-term responders. In the non-vaccinated group, there were 54 participants, of those, 49 (90·74%) maintained the acquired seroprotection till day 90 and 5 (9·26%) were classified as short-term responders. H3N2 showed a similar response pattern as H1N1; there were 37 seroprotected participants against H3N2 at day 7 in the vaccinated group, of those, 25 (67·57%) maintained the acquired seroprotection till day 90 and 12 (32·35%) were classified as short-term responders. In the non-vaccinated group, there were 48 participants, of those, 44 (91·67%) maintained the acquired seroprotection and 4 (8·33%) were classified as short-term responders. The B1 response showed another similar pattern to that of strains of the influenza A virus, suggesting that deficiencies in adaptive immunity could be responsible for the short-term responses instead of variations in virus strains. There were 39 seroprotected participants against B1 at day 7 in the vaccinated group, of those, 23 (58·97%) maintained the acquired seroprotection till day 90 and 16 (41·03%) were classified as short-term responders. In the non-vaccinated group, there were 47 participants, of those, 41 (87·23%) maintained the acquired seroprotection and 6 (12·77%). A statistically significant difference was observed at day 90 between the vaccinated and non-vaccinated groups in the number of short-term responders against the three virus strains, which might be expected as the vaccinated group had received at least one dose of the vaccine in the past and didn’t exhibit a long-term seroprotection. A durable seroprotection requires consistent secretion of antibodies by bone marrow plasma cells. Consequently, short-term responses following an initial or booster influenza vaccine shot could be related to potential defects in the production and maintenance of long-lived plasma cells. Knowing that the production of these cells is a complex process that requires an alteration in the morphology and gene expression profile of B cells to promote antibody secretion [Citation26] and formation of germinal centers for affinity maturation [Citation27], followed by migration and competition for a finite number of survival niches in the bone marrow [Citation28].
The assessment of non-responders revealed similar findings. In the case of H1N1, 38 participants in the vaccinated group were not seroprotected before vaccination and failed to achieve seroprotection at day 7, of those, only 4 (10·53%) were able to acquire seroprotection at day 90 and 34 (89·47%) were classified as non-responders. In the non-vaccinated group, there were 61 participants, of those, 24 (39·34%) were able to acquire seroprotection at day 90 and 37 (60·66%) were classified as non-responders. In the case of H3N2, there were 47 participants in the vaccinated group, of those, 10 (21·28%) were able to acquire seroprotection at day 90 and 37 (78·72%) were classified as non-responders. In the non-vaccinated group, there were 80 participants, of those, 41 (51·25%) were able to acquire seroprotection at day 90 and 39 (48·75%) were classified as non-responders. Lastly, despite a higher proportion of non-responders observed within the group of previously vaccinated participants, there was no significant difference in the number of non-responders to the influenza B strain between the two groups. There were 42 participants in the vaccinated group, of those, 24 (57·14%) were able to acquire seroprotection at day 90 and 18 (42·86%) were classified as non-responders. In the non-vaccinated group, there were 71 participants, of those, 52 (73·24%) were able to acquire seroprotection at day 90 and 19 (26·76%) were classified as non-responders.
A noticeable significant difference between the two groups was observed at day 90 in terms of the number of non-responders to strains of the influenza A virus The inability to achieve seroprotection indicates a considerable decline in the production of the two main populations of antibody-secreting cells: plasmablasts and plasma cells. Plasmablasts are the short-lived population originating from naive and memory B cells as a part of an extrafollicular reaction [Citation29], aiming to provide a preliminary adaptive immune response until long-lived plasma cells are produced and matured. The absence of early protective antibodies could be related to potential defects in the initial response outside the follicles and the failure to generate plasmablasts.
4. Discussion
Among all vaccines, influenza vaccines are unique because they are seasonal vaccines that may require annual updates in response to viral antigenic drifts and circulating strains. Seasonal influenza vaccines that currently have licenses lack two main characteristics: (1) they do not generate a cross-reactive adaptive immune response that can neutralize various influenza virus strains; (2) they do not generate a durable seroprotection and may require the administration of additional booster shots. An ideal universal influenza vaccine [Citation30–35] would be administrated once and elicit long-term neutralizing antibodies against all influenza circulating strains, regardless of the seasonal antigenic drifts and the pandemic antigenic shifts. In recent times, with a better understanding of the structure and key immunogens of the influenza virus, attempts have been made to design vaccines that elicit cross-reactive antibodies against highly conserved influenza proteins, including the stalk structure of the hemagglutinin surface protein instead of its highly variable head structure [Citation36], neuraminidase surface protein (NA) [Citation37] and matrix protein (M2) [Citation34,Citation38]. To date, the longevity of achieved seroprotection and the effectiveness of repetitive vaccination is still a subject of ongoing research.
Influenza vaccines have been administrated for more than half a century, and studies evaluating immunogenicity and effectiveness of repetitive vaccination started early during the 1970s. The earliest studies were conducted by Hoskins et al. [Citation39–41] who examined the effectiveness of repeated annual vaccination in limiting infection rates during three H3N2 influenza outbreaks in England between 1972 and 1976. Initially, Hoskins et al. conducted a 3-year randomized clinical trial [Citation39] that took place between 1970 and 1972. In the clinical trial, 800 boys in a boarding school were randomly assigned to receive an inactivated whole-virus vaccine containing either influenza virus subtype A or B. During the first H3N2 outbreak in 1972, vaccines provided reasonable protection against infection but no significant difference in the attack rate was reported for boys who had received one, two, or three doses of vaccine. During the second H3N2 outbreak in 1974, the infection rate increased among boys who had previously received vaccines between 1970 and 1972 [Citation40]. Lastly, after the third H3N2 outbreak in 1976, they examined a subset of 375 boys who experienced the three H3N2 outbreaks, and their study focused on assessing immunization against multiple H3N2 strains rather than the number of vaccine doses [Citation41]. Surprisingly, the authors reported a higher infection rate among boys who were vaccinated against the three H3N2 circulating strains of the studied outbreaks. A few years later, Keitel et al. [Citation42] conducted a 5-year randomized clinical trial of repeated vaccination between 1983 and 1987 in healthy adults who received inactivated whole-virus vaccine. The study reported increased protection against influenza viruses and decreased virus shedding by an average of 38·8%. However, in the last year of the trial, they noticed a significant association between the number of received vaccine doses and the H3N2 infection rate among participants. Skowronski et al. [Citation43] reported similar findings as a result of a test-negative observational study conducted between 2010 and 2015 in Canada during three H3N2 influenza outbreaks. The study observed reduced vaccine effectiveness with repeated vaccination when the H3N2 vaccine component was not updated while the circulating H3N2 circulating epidemic strain had undergone substantial antigenic drift. These findings were consistent with the antigenic distance hypothesis proposed by Smith et al. [Citation44]. In contrast, Plant et al. [Citation45] analyzed the antibody responses against drifted virus strains in different influenza seasons between 1995 and 2008 and reported that updating the vaccine formulation results in an antibody repertoire that is better able to react with emerging virus strains in repeatedly vaccinated subjects.
Despite the existing literature, the impact of repeated influenza vaccination on vaccine effectiveness and seroprotection duration remains controversial. The immune response is a remarkably personalized mechanism; hence, several factors, including the number of study participants, individual differences between participants, and time point(s) chosen post-vaccination for assessing immunogenicity play a role in obtaining conclusive study results. Our study was conducted during the 2011/2012 influenza season to investigate trivalent inactivated influenza vaccine immunogenicity at one time point prior to vaccination and two time points post-vaccination to assess immunogenicity progression while taking into account individual differences between participants.
The baseline immunogenicity reflects preexisting immunity due to previous vaccine compositions and past infections. Comparing repeatedly vaccinated participants before previous influenza seasons to participants who had never received influenza vaccine doses in the past could give a rough estimate of the vaccine’s capability to provide seroprotection for 1 year or more. Prior vaccination assessment showed 108 (77·1%) participants from the previously vaccinated group seroprotected against at least one subtype of influenza viruses, and 20 (14·3%) participants were seroprotected against the three subtypes, which could indicate possible long-term immunization against these viruses if they undergo no or minimal antigenic drifts. However, significant antigenic drifts that change the virus’ antigenic properties may increase susceptibility to infection, and antibodies developed in response to the vaccine virus strain may not recognize and bind to the antigenically different virus [Citation46]. The post-vaccination assessment showed that the vaccine is capable of inducing an acceptable immune response in both groups after three months of administration but the nature of the response is different between the two groups. Our assessment revealed three main observations: (1) the majority of seroprotected participants from the vaccinated group had a higher baseline score while seroprotection among the non-vaccinated participants was independent of their baseline score; (2) few participants from both groups started to lose seroprotection at some point in time between day 7 and day 90; (3) the overall vaccine response score after three months was almost equivalent in the two groups when we modeled longitudinal response score measurements and previous vaccination status as fixed effects and individual differences as random effects. To further investigate these observations, we examined a subset of participants in each group who were not seroprotected against any of the three virus subtypes prior to vaccination and had very low baseline scores; the subsets included 32 (22·6%) participants in the vaccinated group, regarding multiple previous vaccinations, and 91 (65·95%) in the non-vaccinated group. Their seroprotection at day 7 and day 90 revealed interesting findings: no participants (0·0%) in the vaccinated group out of 32 and 11 (12·1%) participants in the non-vaccinated group out of 91 were able to achieve seroprotection at day 7 and remained seroprotected at day 90. On the other hand, we found 5 (15·6%) participants in the vaccinated group out of 32 and 2 (2·2%) participants in the non-vaccinated group out of 91 never achieved seroprotection, not even at day 7 nor day 90. This subset in the vaccinated group with low baseline scores pointed out a group of individuals who either never respond to the vaccine or who lose seroprotection after a short amount of time versus another subset of individuals in the same vaccinated group with high baseline scores who respond robustly and exhibit long term seroprotection. These assumptions may require more observational studies involving analysis of seroprotection levels at more time points and comprehensive tracking of adaptive immune responses prior to and post-vaccination using high-throughput technologies. Classification of individuals based on the amount of time they start losing seroprotection and understanding their immune response mechanisms may lead to the development of an improved or even ideal influenza vaccine that would be administered once and provide prolonged protection against all influenza circulating strains, a step toward a universal influenza vaccine.
5. Conclusion
Yearly vaccination against seasonal influenza viruses showed a robust and possibly longstanding immune response among potential vaccine responders. No significant immune response differences were found between the previously vaccinated group and the group of first-time vaccine receivers. However, individuals within each group do not respond equally to the vaccine, and further research is required to explain the causal factors of response diversity in each group in order to develop a universal vaccine.
Declaration of interests
The authors have no relevant affiliations or financial involvement with any organization or entity with a financial interest in or financial conflict with the subject matter or material discussed in the manuscript. This includes employment, consultancies, honoraria, stock ownership or options, expert testimony, grants or patents received or mending, or royalties.
Reviewer disclosures
Peer reviewers on this manuscript have no relevant financial or other relationships to disclose.
Author contributions
Fumihiko Matsuda and Anavaj Sakuntabhai were involved in planning, supervising the work, and providing feedback. Kristel Van Steen and Takahisa Kawaguchi verified the analytical methods, provided feedback and helped shape the analysis and manuscript. Takahisa Kawaguchi, Meiko Takahashi, Kazuya Setoh, Izumi Yamaguchi, and Yasuharu Tabara carried out the study design, data collection and processing and conducted the preliminary analysis. Ahmed Tawfik planned and performed the analysis, drafted the manuscript, and designed the figures.
Supplemental Material
Download Zip (774.6 KB)Data availability statement
The datasets that support the findings of this study are managed by Kyoto University Graduate School and Faculty of Medicine and can be requested from the authors.
Supplementary material
Supplemental data for this article can be accessed online at https://doi.org/10.1080/14760584.2023.2262563
Additional information
Funding
References
- Rothberg MB, Haessler SD, Brown RB. Complications of viral influenza. Am j med. 2008;121(4):258–264.
- Buchy P, Selim B. Who and when to vaccinate against influenza. Inter J Infect Dis. 2020;93:375–387.
- Manzoli L, Schioppa F, Boccia A, et al. The efficacy of influenza vaccine for healthy children. A meta-analysis evaluating potential sources of variation in efficacy estimates including study quality. Pediatr Infect Dis J. 2007;26(2):97–106. doi: 10.1097/01.inf.0000253053.01151.bd
- Jefferson T, Rivetti A, Harnden A, et al. Vaccines for preventing influenza in health children. Cochrane Database Syst Rev. 2008;2.
- Negri E, Colombo C, Giordano L, et al. Influenza vaccine in healthy children: a meta-analysis. Vaccine. 2005;23(22):2851–2861. doi: 10.1016/j.vaccine.2004.11.053
- Villari P, Manzoli L, Boccia A. Methodological quality of studies and patient age as major sources of variation in efficacy estimates of influenza vaccination in healthy adults: a meta-analysis. Vaccine. 2004;22(25–26):3475–3486. doi: 10.1016/j.vaccine.2004.01.068
- Beyer WEP. Heterogeneity of case definitions used in vaccine effectiveness studies—and its impact on meta-analysis. Vaccine. 2006;24(44–46):6602–6604. doi: 10.1016/j.vaccine.2006.05.038
- Demicheli V, Jefferson T, Ferroni E, et al. Vaccines for preventing influenza in healthy adults. Cochrane Database Syst Rev. 2018;2.
- Govaert TM, Thijs CT, Masurel N, et al. The efficacy of influenza vaccination in elderly individuals. A randomized double-blind placebo-controlled trial. JAMA. 1994;272(21):1661–1665. doi: 10.1001/jama.1994.03520210045030
- Nichol KL, Wuorenma J, Von Sternberg T. Benefits of influenza vaccination for low-, intermediate-, and high-risk senior citizens. Arch Internal Med. 1998;158(16):1769–1776.
- Sanyal M, Holmes TH, Maecker HT, et al. Diminished B-cell response after repeat influenza vaccination. J Infect Dis. 2019;219(10):1586–1595.
- Khurana S, Hahn M, Coyle EM, et al. Repeat vaccination reduces antibody affinity maturation across different influenza vaccine platforms in humans. Nat Commun. 2019;10(1):1–15.
- Ramsay LC, Buchan SA, Stirling RG, et al. The impact of repeated vaccination on influenza vaccine effectiveness: a systematic review and meta-analysis. BMC Med. 2019;17(1):1–16.
- Bartoszko JJ, McNamara IF, Aras OA, et al. Does consecutive influenza vaccination reduce protection against influenza: a systematic review and meta-analysis. Vaccine. 2018;36(24):3434–3444.
- Soema PC, Kompier R, Amorij JP, et al. Current and next generation influenza vaccines: formulation and production strategies. Eur J Pharm Biopharm. 2015;94:251–263.
- Krammer F, Fouchier RA, Eichelberger MC, et al. Naction! How can neuraminidase-based immunity contribute to better influenza virus vaccines? MBio. 2018;9(2):e02332–17.
- Sangster S, Nguyen MYPQ, Topham DJ. Role of memory B cells in hemagglutinin-specific antibody production following human influenza a virus infection. Pathogens. 2019;8(4):167.
- Hannoun C, Megas F, Piercy J. Immunogenicity and protective efficacy of influenza vaccination. Virus res. 2004;103(1–2):133–138.
- Gelman A, Hill J. Data analysis using regression and multilevel/hierarchical models. Cambridge university press; 2006.
- Khurana S, Verma N, Talaat KR, et al. Immune response following H1N1pdm09 vaccination: differences in antibody repertoire and avidity in young adults and elderly populations stratified by age and gender. J Infect Dis. 2012;205(4):610–620. doi: 10.1093/infdis/jir791
- Verma N, Dimitrova M, Carter DM, et al. Influenza virus H1N1pdm09 infections in the young and old: evidence of greater antibody diversity and affinity for the hemagglutinin globular head domain (HA1 domain) in the elderly than in young adults and children. J Virol. 2012;86(10):5515–5522. doi: 10.1128/JVI.07085-11
- Gouma S, Kim K, Weirick ME, et al. Middle-aged individuals may be in a perpetual state of H3N2 influenza virus susceptibility. Nat Commun. 2020;11(1):4566. doi: 10.1038/s41467-020-18465-x
- Monto AS, Fukuda K. Lessons from influenza pandemics of the last 100 years. Clinl Infect Dis. 2020;70(5):951–957.
- Wrammert J, Smith K, Miller J, et al. Rapid cloning of high-affinity human monoclonal antibodies against influenza virus. Nature. 2008;453(7195):667–671. doi: 10.1038/nature06890
- Davis CW, Jackson KJ, McCausland MM, et al. Influenza vaccine–induced human bone marrow plasma cells decline within a year after vaccination. Science. 2020;370(6513):237–241.
- Nutt SL, Hodgkin PD, Tarlinton DM, et al. The generation of antibody-secreting plasma cells. Nat Rev Immunol. 2015;15:160–171. doi: 10.1038/nri3795
- Shlomchik MJ, Weisel F. Germinal center selection and the development of memory B and plasma cells. Immunol Rev. 2012;247(1):52–63. doi: 10.1111/j.1600-065X.2012.01124.x
- Radbruch A, Muehlinghaus G, Luger EO, et al. Competence and competition: the challenge of becoming a long-lived plasma cell. Nat Rev Immunol. 2006;6(10):741–750. doi: 10.1038/nri1886
- MacLennan IC, Toellner K-M, Cunningham AF, et al. Extrafollicular antibody responses. Immunol Rev. 2003;194(1):8–18. doi: 10.1034/j.1600-065X.2003.00058.x
- Madsen A, Cox RJ. Prospects and challenges in the development of universal influenza vaccines. Vaccines. 2020;8(3):361.
- Estrada LD, Schultz-Cherry S. Development of a universal influenza vaccine. J Immunol. 2019;202(2):392–398. doi: 10.4049/jimmunol.1801054
- Paules CI, Marston HD, Eisinger RW, et al. The pathway to a universal influenza vaccine. Immunity. 2017;47(4):599–603. doi: 10.1016/j.immuni.2017.09.007
- Pica N, Palese P. Toward a universal influenza virus vaccine: prospects and challenges. Annu Rev Med. 2013;64(1):189–202. doi: 10.1146/annurev-med-120611-145115
- Fiers W, De Filette M, El Bakkouri K, et al. M2e-based universal influenza a vaccine. Vaccine. 2009;27(45):6280–6283. doi: 10.1016/j.vaccine.2009.07.007
- Wei CJ, Crank MC, Shiver J, et al. Next-generation influenza vaccines: opportunities and challenges. Nat Rev Drug Discov. 2020;19(4):239–252.
- Yuan L, Welsh JP, Swartz JR. Production and stabilization of the trimeric influenza hemagglutinin stem domain for potentially broadly protective influenza vaccines. Proc Nat Acad Sci. 2014;111(1):125–130.
- Eichelberger MC, Monto AS. Neuraminidase, the forgotten surface antigen, emerges as an influenza vaccine target for broadened protection. J Infect Dis. 2019;219(Supplement_1):S75–S80.
- Mezhenskaya D, Isakova-Sivak I, Rudenko L. M2e-based universal influenza vaccines: a historical overview and new approaches to development. J Biomed Sci. 2019;26(1):1–15.
- Hoskins TW, Davies J, Allchin A, et al. Controlled trial of inactivated influenza vaccine containing the A/Hong kong strain during an outbreak of influenza due to the A/England/42/72 strain. Lancet. 1973;302(7821):116–120.
- Hoskins TW, JoanR Davies AJS, Allchin A, et al. Influenza at Christ’s hospital: March, 1974. Lancet. 1976;307(7951):105–108.
- Hoskins TW, Davies J, Smith AJ, et al. Assessment of inactivated influenza-A vaccine after three outbreaks of influenza a at Christ’s hospital. Lancet. 1979;313(8106):33–35.
- Keitel WA, Cate TR, Couch RB, et al. Efficacy of repeated annual immunization with inactivated influenza virus vaccines over a five year period. Vaccine. 1997;15(10):1114–1122.
- Skowronski DM, Chambers C, De Serres G, et al. Serial vaccination and the antigenic distance hypothesis: effects on influenza vaccine effectiveness during a (H3N2) epidemics in Canada, 2010–2011 to 2014–2015. J Infect Dis. 2017;215(7):1059–1099.
- Smith DJ, Forrest S, Ackley DH, et al. Variable efficacy of repeated annual influenza vaccination. Proc Nat Acad Sci. 1999;96(24):14001–14006.
- Plant EP, Fredell LJ, Hatcher BA, et al. Different repeat annual influenza vaccinations improve the antibody response to drifted influenza strains. Sci Rep. 2017;7(1):1–12.
- Carrat F, Flahault A. Influenza vaccine: the challenge of antigenic drift. Vaccine. 2007 Sep 28;25(39–40):6852–6862. doi: 10.1016/j.vaccine.2007.07.027