
ABSTRACT
Introduction
The rapid development of COVID-19 vaccines has provided crucial tools for pandemic control, but the occurrence of vaccine-related adverse events (AEs) underscores the need for comprehensive monitoring.
Methods
This study analyzed the Vaccine Adverse Event Reporting System (VAERS) data from 2020–2022 using statistical methods such as zero-truncated Poisson regression and logistic regression to assess associations with age, gender groups, and vaccine manufacturers.
Results
Logistic regression identified 26 System Organ Classes (SOCs) significantly associated with age and gender. Females displayed especially higher odds in SOC 19 (Pregnancy, puerperium and perinatal conditions), while males had higher odds in SOC 25 (Surgical and medical procedures). Older adults (>65) were more prone to symptoms like Cardiac disorders, whereas those aged 18–65 showed susceptibility to AEs like Skin and subcutaneous tissue disorders. Moderna and Pfizer vaccines induced fewer SOC symptoms compared to Janssen and Novavax. The zero-truncated Poisson regression model estimated an average of 4.243 symptoms per individual.
Conclusion
These findings offer vital insights into vaccine safety, guiding evidence-based vaccination strategies and monitoring programs for precise and effective outcomes.
1. Introduction
The COVID-19 pandemic, triggered by the SARS-CoV-2 virus, has led to over 190 million infections and more than 1 million fatalities in the U.S [Citation1]. As a countermeasure to this global health crisis, a variety of vaccines have been rapidly developed and granted emergency use authorizations to combat COVID-19 [Citation2]. Vaccines play a pivotal role in managing and ultimately curtailing the pandemic by preparing the body’s immune system to identify and fight the virus. Nevertheless, as with all medical interventions, vaccines can lead to adverse events (AEs), which can vary from mild reactions like injection site soreness and slight fever, to severe outcomes such as seizure or life-threatening allergic reactions [Citation3]. Although most AEs are infrequent, the protective benefits of vaccination against COVID-19 significantly surpass the potential risks [Citation4]. It is essential to continue monitoring and reporting these AEs to maintain the safety and effectiveness of these vaccines [Citation5].
Vaccine Adverse Event Reporting System (VAERS), acting as a passive reporting system to collect and analyze reports on every AE associated with the administration of any US licensed vaccine in all age groups, was developed and implemented by the Centers for Disease Control and Prevention (CDC) and the Food and Drug Administration (FDA) to monitor the safety of vaccines [Citation6]. By August 2023, VAERS had received more than 1,742,000 vaccine AE reports, to allow it to identify potential risk factors for particular events [Citation7] [Citation8]. In 2022, the COVID-19 vaccine was the most frequently reported vaccine in VAERS, underscoring the importance of utilizing VAERS to investigate potential AEs related to COVID-19 vaccination.
Currently, the COVID-19 vaccines available in the United States are typically made from four manufacturers: Pfizer, Moderna, Janssen and Novavax [Citation9]. Of these, Pfizer-BioNTech and Moderna COVID-19 vaccines rely on messenger Ribonucleic acid (mRNA) technology to enhance immunity by delivering the genetic code for a specific pathogen’s antigen [Citation10] [Citation11]. The host then translates this mRNA into the relevant protein from the pathogen, triggering an immune response [Citation11]. The Janssen COVID-19 vaccine utilizes a replication-incompetent adenovirus serotype 26 vector to encode the prefusion spike glycoprotein of SARS-CoV-2, the virus that causes COVID-19 [Citation12] [Citation13]. In contrast, the Novavax vaccine is produced by genetically engineering a baculovirus carrying a gene that encodes the full-length spike glycoprotein, which is stabilized in the prefusion conformation [Citation14]. In its role, VAERS collects reports of AEs from these four manufacturers of COVID-19 vaccines.
Conducting correlation analysis for adverse events following COVID-19 vaccination based on age, sex, and vaccine manufacturer is crucial to comprehensively monitor vaccine safety, identify potential risk factors, and ensure targeted interventions if necessary. By analyzing real-world data from different demographic groups and vaccine types, health authorities can gain valuable insights into the occurrence and distribution of adverse events, allowing for the identification of specific risk factors associated with certain vaccines or subpopulations. This information aids in promoting vaccine development, and supporting ongoing efforts to improve vaccine safety and efficacy.
Although much work has been done on studying AEs following COVID-19 vaccination using VAERS data, most studies have focused only on specific symptoms as independent events, and furthermore, they have primarily used one-year data. Li et al. examined the incidence and risk of myocarditis and pericarditis following COVID-19 vaccination in the United States, stratified by age and vaccine type, using VAERS data from 11 December 2020 to 13 August 2021 [Citation15]. Their study was based on the reporting odds ratio (ROR) and found that the higher incidence rate among adolescents and after the administration of the second dose of mRNA vaccines [Citation15]. Frontera et al. studied neurological events reported to VAERS between 1 January 2021 and 14 June 2021 [Citation16]. Although reports of serious neurological events following COVID-19 vaccination are rare, Guillain-Barré Syndrome (GBS), cerebral venous thrombosis (CVT), and seizures may occur at higher than background rates following Janssen vaccination, but the rates of neurological complications following acute SARS-CoV-2 infection are up to 617-fold higher than after COVID vaccination [Citation16]. Gringeri et al. conducted a nested case-control study using VAERS, which indicated a slightly increased risk of reporting both Zoster (ROR = 1.49) and Simplex (ROR = 1.51) infections following the Pfizer-BioNTech vaccine [Citation17]. In the analysis of VAERS data from 11 December 2020 to 8 January 2021, Lv et al. found a mortality rate of 53.4 per million population, with hypertension, dementia, chronic obstructive pulmonary disease (COPD), diabetes, and heart failure being the most commonly reported comorbidities associated with deaths [Citation18]. Furthermore, the study showed that dementia was more likely to be associated with deaths among those vaccinated at long-term care facilities compared to those vaccinated elsewhere [Citation18].
In this paper, our research leveraged the Medical Dictionary for Regulatory Activities (MedDRA), which is the international medical terminology developed under the auspices of the International Council for Harmonization of Technical Requirements for Pharmaceuticals for Human Use (ICH) [Citation19]. Following organizing symptoms into 27 System Organ Classes (SOCs), we analyzed the grouped symptom data with regression models and categorical analysis. More precisely, we calculated the average number of symptoms per individual by stratifying the cases into sex, age groups, and vaccine manufacturer. Additionally, we employed logistic regression to examine the relationship between the occurrence of an SOC and sex/age/vaccine manufacturer at the individual SOC level. To examine the correlations among SOCs, we generated a rank-based correlation matrix. Last but not least, we also explore the relationship between allergies and AEs in different SOCs via Spearman rank correlation test and linear correlation.
2. Methods and materials
2.1. Data source
We gathered adverse event reports following COVID-19 vaccination from 12/13/2020 to 12/28/2022 through VAERS. These reports are organized into three Comma-Separated-Value (CSV) files: VAERSDATA.CSV, VAERSVAX.CSV, and VAERSSYMPTOMS.CSV, grouped by year. VAERSDATA.CSV includes demographic information, vaccination details, timing of adverse events, symptom descriptions, allergy history, and serious outcomes. VAERSVAX.CSV provides information on vaccine types and manufacturers associated with each AE, while VAERSSYMPTOMS.CSV lists the symptoms linked to each AE based on the Preferred Term (PT) in the MedDRA terminology. The primary key ‘VAERS_ID’ links the three tables.
MedDRA and the Human Disease Ontology (DO) were used to describe the post-vaccination symptoms and allergic reactions in this project. MedDRA serves as a standardized vocabulary for reporting AEs, facilitating consistent classification and analysis of safety data across different pharmaceutical products and clinical studies [Citation19]. The MedDRA Terminology consists of a hierarchical structure with five levels: SOC, High Level Group Term (HLGT), High Level Term (HLT), PT, and the lowest Level Term (LLT). According to the MedDRA website, the current version of MedDRA (version 24.1 as of September 2021) encompasses over 84,000 PTs, which VAERS uses to code and classify AEs reported to the system [Citation20]. DO serves as a standardized and comprehensive ontology for human disease, providing consistent and reusable descriptions of disease terms, phenotypes, and related medical concepts [Citation21]. In this study, we used MedDRA to map reported symptoms to MedDRA terminology, whereas DO was leveraged to normalize the reported allergies.
2.2. Reported symptoms mapped to MedDRA terminology
We adopted the same approach to that of Li et al. in classifying Symptoms/AEs into their respective SOCs for this study [Citation22]. In VAERS, AEs are reported through a voluntary and spontaneous reporting system, where healthcare professionals, vaccine recipients, or other concerned individuals submit information regarding potential vaccine-related AEs [Citation23]. The reported events are categorized and coded using the MedDRA system, which classified symptoms into SOCs [Citation24]. Specifically, SOC (refer to Supplementary Table S1) serves as the highest-level hierarchical structure employed to broadly categorize medical concepts, based on factors such as etiology, manifestation site, or purpose [Citation25]. In the context of this analysis, the reported events were aligned with the SOC classification, which provides a standardized framework for grouping related AEs [Citation24].
2.3. Reported allergies mapped to DO terminology
During the allergy concept mapping process, we matched the preferred label (concept name) and synonyms in DO with the self-reported allergy history in the VAERS report. This yielded a total of 81 allergy names found in the DO that correlated with the reported allergies.
2.4. Statistical analysis
In this study, all analyses were performed in RStudio with R version 4.1.2 and STATA version 17.0 [Citation26,Citation27]. A two-tailed P≤ 0.05 was considered statistically significant.
2.4.1. Zero-truncated poisson regression
Since every subject in our dataset had at least one SOC to report, we used a zero-truncated Poisson regression model for data analysis [Citation28]. We adjusted for sex, age (year) in groups ((0–5), [5–12), [12–18), [18–65), 65+, and Unknown), and vaccine manufacturers to fit the model to estimate and compare the number of symptoms across different sex, age, and vaccine manufacturer groups.
2.4.2. Logistic regression
We conducted logistic regression analysis [Citation29] to explore the potential risk factors associated with each SOC, such as gender, age, and vaccine manufacturer. To facilitate the analysis, the original SOC count was transformed into a binary outcome variable (1: SOC ≥ 1, 0: SOC = 0) in the logistic regression.
2.4.3. Spearman rank correlation coefficient
Given the highly right-skewed and non-normally distributed nature of SOC counts, we opted to use Spearman’s rank correlation coefficient as a nonparametric measure to evaluate the correlations between SOCs [Citation30]. This coefficient is well-suited for non-normally distributed data and has demonstrated efficacy in identifying the correlation between two variables. To showcase the strength of pairwise correlations between SOCs, we produced a correlation matrix for the SOCs.
In our investigation of the co-occurrence of individual allergies and SOCs, we initially constructed an observed table to explore their associations. Furthermore, Spearman correlation was employed to examine the correlations between each allergy and SOC pair.
2.4.4. Linear regression
In addition to exploring the co-occurrence of individual allergies and SOCs, we employed linear regression to further investigate the associations between each SOC (dependent variable) and allergies (independent variable), which provides a robust method to investigate the potential impact of allergies on specific SOCs following COVID-19 vaccination. This linear regression analysis allowed us to assess the strength and direction of these associations, providing valuable insights into the potential impact of allergies on specific SOCs.
3. Results
shows the descriptive statistics about this study
Table 1. Descriptive statistics for VAERS reports related to COVID-19 vaccination during 2020–2022.
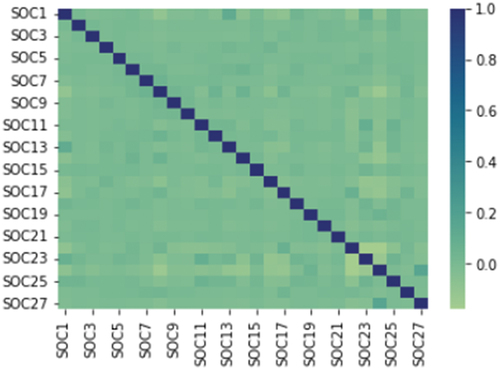
We utilized Spearman’s method [Citation30] to calculate the pairwise correlation matrix of SOCs as shown in . The color and size of each spot indicate the strength of the correlation between SOCs. To determine significant correlations, we considered a correlation coefficient threshold of 0.15 or greater. Our analysis revealed a strong positive correlation between SOC 1 (Infections and infestations) and SOC 23 (Investigations), while we also observed a strong negative correlation between SOC 8 (Nervous system disorders) and SOC 24 (Injury, poisoning, and procedural complications).
Figure 1. The pairwise correlation matrix of SOCs determined by Spearman’s method.
The analysis carried out using a zero-truncated Poisson model revealed that the mean number of symptoms per individual in the study group was estimated to be 4.243 (95% confidence interval (CI): (4.242, 4.245), median: 4.49, interquartile range (IQR): (4.12,4.70), 2.5th percentile = 2.18, and 97.5th percentile = 5.46). After adjusting for gender, age group, and vaccine manufacturer, the results from zero-truncated Poisson regression showed the number of symptoms among sex, age groups, and vaccine manufacturers. The study found that the ages 5 to 12 reported the fewest symptoms with an average of 2.43, while the ages 18 to 65 reported the most, with 4.52 symptoms. Janssen, the vaccine manufacturer with the most symptoms, leads by an average of approximately 4.8 symptoms, while Novavax, the manufacturer with the fewest symptoms, induces an average of 3.87. In terms of gender, females tend to report an average of approximately 4.4 symptoms compared to 4 symptoms for males. For those individuals with the unknown gender, they typically report 2.34 symptoms on average.
The study found that 26 SOCs were significantly associated with age groups and genders, except for SOC 21 (Congenital, familial and genetic disorders). Among these, 23 SOCs showed statistically significant associations with vaccine manufacturers, excluding SOC 2 (Neoplasms benign, malignant and unspecified (incl cysts and polyps)), SOC 6 (Metabolism and nutrition disorders), and SOC 15 (Hepatobiliary disorders).
The study also revealed that males had higher likeliness than females in several SOCs, including SOC 1 (Infections and infestations) (OR = 1.38), SOC 2 (Neoplasms benign, malignant and unspecified (incl cysts and polyps)) (OR = 1.34), SOC 6 (Metabolism and nutrition disorders) (OR = 1.06), SOC 10 (Ear and labyrinth disorders) (OR = 1.04), SOC 11 (Cardiac disorders) (OR = 1.31), SOC 12 (Vascular disorders) (OR = 1.07), SOC 15 (Hepatobiliary disorders) (OR = 1.45), SOC 18 (Renal and urinary disorders) (OR = 1.61), SOC 21 (Congenital, familial and genetic disorders) (OR = 1.48), SOC 23 (Investigations) (OR = 1.19), SOC 24 (Injury, poisoning and procedural complications) (OR = 1.57), SOC 25 (Surgical and medical procedures) (OR = 1.76), and SOC 27 (Product issues) (OR = 1.74). On the other hand, males were less likely than females to suffer from symptoms in SOC 3 (Blood and lymphatic system disorders) (OR = 0.63), SOC 4 (Immune system disorders) (OR = 0.65), SOC 5 (Endocrine disorders) (OR = 0.56), SOC 7 (Psychiatric disorders) (OR = 0.99), SOC 8 (Nervous system disorders) (OR = 0.78), SOC 9 (Eye disorders) (OR = 0.82), SOC 13 (Respiratory, thoracic and mediastinal disorders)(OR = 0.99), SOC 14 (Gastrointestinal disorders)(OR = 0.61), SOC 16 (Skin and subcutaneous tissue disorders) (OR = 0.63), SOC 17 (Musculoskeletal and connective tissue disorders) (OR = 0.73), SOC 19 (Pregnancy, puerperium and perinatal conditions) (OR = 0.03), SOC 20 (Reproductive system and breast disorders) (OR = 0.15), SOC 22 (General disorders and administration site conditions) (OR = 0.74), and SOC 26 (Social circumstances) (OR = 0.81).
People older than 65 years old demonstrated a significantly higher chance of getting symptoms in Infections and infestations (P< .001), Neoplasms benign, malignant and unspecified (including cysts and polyps) (P< .001), Metabolism and nutrition disorders (P< .001), Psychiatric disorders (P< .001), Cardiac disorders (P < .001), Respiratory, thoracic and mediastinal disorders (P< .001), Hepatobiliary disorders (P< .001), Renal and urinary disorders (P< .001), General disorders and administration site conditions (P< .001), Investigations (P< .001), and Surgical and medical procedures (P< .001), while those aged 18–65 were more prone to experience symptoms in Blood and lymphatic system disorders (P< .001), Nervous system disorders (P< .001), Eye disorders (P< .001), Ear and labyrinth disorders (P< .001), Vascular disorders (P< .001), Gastrointestinal disorders (P< .001), Skin and subcutaneous tissue disorders (P< .001), Musculoskeletal and connective tissue disorders (P< .001), Pregnancy, puerperium and perinatal conditions (P< .001), Reproductive system and breast disorders (P< .001), and Social circumstances (P< .001). Children aged 0–5 years old were more likely to develop symptoms in SOC 27 (Product issues) (P< .001), whereas those in the age group of 5–12 exhibited a higher likelihood of experiencing symptoms related to SOC 24 (Injury, poisoning and procedural complications) (P< .001).
Regarding vaccine manufacturers, Janssen vaccines had a significantly higher occurrence of symptoms in SOC 7 (Psychiatric disorders) (P< .001), SOC 8 (Nervous system disorders) (P< .001), SOC 9 (Eye disorders) (P< .001), and SOC 12 (Vascular disorders) (P< .001), SOC 14 (Gastrointestinal disorders) (P< .001), SOC 17 (Musculoskeletal and connective tissue disorders) (P< .001), SOC 22 (General disorders and administration site conditions) (P< .001), while Novavax vaccines were associated with symptoms in SOC 5 (Endocrine disorders) (P= .034), and SOC 24–26 (Injury, poisoning and procedural complications (P< .001); Surgical and medical procedures (P= .003); Social circumstances (P= .044)). Moderna and Pfizer vaccines induced fewer SOC symptoms, with Moderna showing the highest odds in SOC 16 (Skin and subcutaneous tissue disorders) (P< .001) and SOC 27 (Product issues) (P< .001), and Pfizer demonstrating the highest odds in SOC 3 (Blood and lymphatic system disorders) (P< .001), and SOC 10 (Ear and labyrinth disorders) (P< .001). Finally, in all 27 logistic regression tests conducted, the results revealed a remarkable level of statistical significance, with P< .001.
Out of 900,522 medical reports, 419,927 provide information on allergies. Among these, 93,623 reports feature a corresponding concept in DO. Our analysis identified the top three correlations between allergies and SOC symptoms: penicillin allergy correlates with SOC 22 (General disorders and administration site conditions) (Spearman correlation (ρ): 0.057), penicillin allergy with SOC 16 (Skin and subcutaneous tissue disorders) (ρ: 0.052), and latex allergy with SOC 16 (Skin and subcutaneous tissue disorders) (ρ: 0.040).
In the linear regression model, Penicillin allergy also exhibits a substantial coefficient of 0.38 (P< .001). Similarly, Latex allergy demonstrates a significant coefficient of 0.18 in SOC 16 modeling (P< .001), while Penicillin allergy shows a coefficient of 0.14 (P< .001).
4. Discussion
Our correlation analysis revealed some interesting results. We observed a strong positive correlation between SOC 1 (Infections and infestations) and SOC 23 (Investigations). This association may be attributed to the fact that vaccinated individuals may have a higher awareness of potential symptoms of infection and seek medical attention and testing more frequently, leading to an increase in investigations for infections [Citation31,Citation32]. Additionally, vaccination may cause certain side effects such as fever and fatigue, which can mimic symptoms of infection, and prompt individuals to seek medical attention and undergo testing [Citation12,Citation31]. Further, the immune response triggered by vaccination could increase susceptibility to certain infections or cause the reactivation of latent infections, leading to an increase in investigations for infections [Citation33]. However, additional research is required to fully comprehend the underlying mechanisms of this association. We also observed a strong negative correlation between SOC 8 (Nervous system disorders) and SOC 24 (Injury, poisoning, and procedural complications). A study by Paterson et al. found that patients with neurological disorders who were hospitalized with COVID-19 had a higher likelihood of admission to the intensive care unit (ICU) and invasive mechanical ventilation compared to patients without neurological disorders [Citation34]. This finding implies that patients with neurological disorders may receive more intensive care and monitoring, leading to better outcomes and a lower risk of complications such as injury, poisoning, and procedural complications.
Our findings reveal compelling evidence supporting the strong associations between penicillin allergy and General disorders and administration site conditions (SOC 22), penicillin allergy and Skin and subcutaneous tissue disorders (SOC 16), as well as latex allergy and Skin and subcutaneous tissue disorders (SOC 16). Blumenthal et. al. conducted a retrospective cohort study, which further supports these associations, revealing that patients with a reported penicillin allergy had a 50% increased odds of surgical site infections (SSIs) due to the receipt of second-line perioperative antibiotics [Citation35]. Additionally, individuals with documented allergies to gelatin, yeast, latex, antibiotics, or other specific vaccine components should undergo an allergy assessment before vaccination [Citation36]. Furthermore, another study highlighted the spectrum of symptoms related to latex allergy, ranging from mild local cutaneous reactions to more severe manifestations, including generalized urticaria, angioedema, allergic rhinitis, respiratory symptoms, and, in rare cases, life-threatening or fatal anaphylaxis [Citation37].
Our correlation study has several strengths. Firstly, unlike other studies, our analysis involved VAERS data spanning more than two years. In correlation analysis, having a large size of dataset offers several benefits. Firstly, a larger dataset provides a more comprehensive representation of the underlying population, leading to more accurate and reliable correlation estimates. Secondly, with a large dataset, correlations between variables can be assessed with higher statistical power, increasing the likelihood of detecting meaningful relationships and reducing the impact of random variations. Lastly, a larger dataset allows for the exploration of correlations in different subgroups or subsets, enabling researchers to gain deeper insights into how relationships may vary across various demographic or experimental conditions. Additionally, our study analyzed the impact of each risk factor, including gender, age group, and vaccine manufacturers, in a detailed manner. By analyzing each risk factor separately, we were able to identify the subpopulations that are more susceptible to AEs following COVID-19 vaccination. Finally, we employed popular statistical methods to analyze the correlation between SOCs and between allergy history and SOCs. Our approach allowed us to identify the most common AEs associated with COVID-19 vaccines and their underlying mechanisms. This information can help healthcare providers better manage and treat AEs associated with COVID-19 vaccines.
However, it is important to acknowledge that our study has several limitations. Firstly, VAERS serves as a system to signal potential AEs post-vaccination. Most of the VAERS data are based on voluntary self-reporting, introducing the possibility of reporting bias and posing challenges to establish a direct causal relationship [Citation38]. For example, some individuals may choose not to report adverse events or allergy history on VAERS. Therefore, follow-up studies are needed (outside of VAERS) to determine actual risks of AE following vaccination. Secondly, we excluded cases where patients had been administered a combination of Pfizer and Moderna vaccines, leading to selection bias. Nonetheless, this bias had negligible effects as the weekly administration was minimal compared to the overall vaccinations. Additionally, this study has limitations in interpreting the results due to the absence of personal health information such as body mass index (BMI), medical history, with only sex, age and vaccine manufacturer available for the study population.
5. Conclusion
In conclusion, our comprehensive correlation analysis of symptoms in SOCs following COVID-19 vaccination has yielded significant insights with implications for public health and vaccination strategies. By investigating the relationships between symptoms and demographic factors like age, sex, and vaccine manufacturer, we have identified crucial risk factors associated with specific SOCs. The use of zero-truncated Poisson regression to model symptom occurrence has provided a valuable framework for understanding the impact of these factors. Additionally, our study’s exploration of the correlation between allergies and SOCs adds to the growing knowledge base on vaccine safety and allergic conditions.
These findings hold great significance for the medical and scientific community, as they enhance our understanding of the COVID-19 vaccination’s effects on different population subgroups. By identifying relevant risk factors, our study contributes to the advancement of evidence-based vaccination strategies and better-targeted healthcare interventions. Moreover, the insights gained from this research can aid public health authorities and healthcare professionals in optimizing post-vaccination monitoring and addressing potential adverse events.
Moving forward, we plan to conduct a case-control study to identify potential risk factors for adverse events in different populations. This will allow us to develop targeted interventions and improve vaccine safety for all individuals.
Abbreviations
| AE | = | adverse event |
| BMI | = | body mass index |
| CDC | = | the Centers for Disease Control and Prevention |
| CI | = | confidence interval |
| COPD | = | chronic obstructive pulmonary disease |
| CSV | = | Comma-Separated-Value |
| CVT | = | cerebral venous thrombosis |
| DO | = | Human Disease Ontology |
| FDA | = | the Food and Drug Administration |
| GBS | = | Guillain-Barré Syndrome |
| HLGT | = | High Level Group Term |
| HLT | = | High Level Term |
| ICH | = | the International Council for Harmonization of Technical Requirements for Pharmaceuticals for Human Use |
| ICU | = | intensive care unit |
| IQR | = | interquartile range |
| LLT | = | lowest Level Term |
| MedDRA | = | Medical Dictionary for Regulatory Activities |
| mRNA | = | messenger Ribonucleic acid |
| OR | = | odds ratio |
| PT | = | Preferred Term |
| ROR | = | reporting odds ratio |
| SOC | = | System Organ Class |
| SSI | = | surgical site infection |
| VAERS | = | Vaccine Adverse Event Reporting System |
Declaration of Interests
The authors have no relevant affiliations or financial involvement with any organization or entity with a financial interest in or financial conflict with the subject matter or materials discussed in the manuscript. This includes employment, consultancies, honoraria, stock ownership or options, expert testimony, grants or patents received or pending, or royalties.
Reviewer disclosures
A reviewer on this manuscript has disclosed that they are currently receiving funding from Moderna for a study not related to COVID-19 vaccine (or any vaccines). Peer reviewers on this manuscript have no other relevant financial or other relationships to disclose.
Author contributions
CT and YC took the lead in designing the experiments, with YL contributing to the experimental design. YL and YD were responsible for data collection. YL and SL conducted data analysis, while YL handled data visualization. WT performed data validation. YL and JL were involved in drafting the manuscript, with CT offering research support. CT and SL edited and reviewed the manuscript. All authors have reviewed and approved the final manuscript.
Data availability
The datasets generated during and/or analyzed during the current study are available from the corresponding author on reasonable request.
Supplemental Material
Download MS Word (8.6 KB)Acknowledgments
We are sincerely grateful to Dazheng Zhang and Jiayi Tong for their advice at the early stages of this project.
Supplementary material
Supplemental data for this article can be accessed online at https://doi.org/10.1080/14760584.2023.2292203
Additional information
Funding
References
- World Health Organization. WHO Coronavirus (COVID-19) Dashboard. [cited 2023 Jul 30]; https://covid19.who.int/
- Acosta-Coley I, Cervantes-Ceballos L, Tejeda-Benítez L, et al. Vaccines platforms and COVID-19: what you need to know. Trop Dis Travel Med Vaccines. 2022;8(1):20. doi: 10.1186/s40794-022-00176-4
- Li Y, Li J, He J, et al. AE-GPT: using large language models to extract adverse events from surveillance reports-a use case with influenza vaccine adverse events. arXiv.org. Sep 2023. doi: 10.48550/arXiv.2309.16150
- Hause AM, Baggs J, Marquez P, et al. Safety monitoring of COVID-19 vaccine booster doses among adults—United States, September 22, 2021–February 6, 2022. Morbidity Mortality Weekly Rep. 2022;71(7):249. doi: 10.15585/mmwr.mm7107e1
- Nohynek H, Wilder-Smith A. Does the world still need new covid-19 vaccines? N Engl J Med. 2022;386(22):2140–2142. doi: 10.1056/NEJMe2204695
- Chen RT, Rastogi S, Mullen J, et al. The vaccine adverse event reporting system (VAERS). Vaccine. 1994 May;12(6):542–550. doi: 10.1016/0264-410X(94)90315-8
- About VAERS. Vaccine Adverse Event Reporting System. [cited 2023 Apr 12]. [ Online]. Online https://vaers.hhs.gov/about.html
- CDC WONDER. Wide-ranging Online Data for Epidemiologic Research (CDC WONDER). [cited 2023 Apr 12]. [ Online]. Online https://wonder.cdc.gov/
- Minka SO, Minka FH. A tabulated summary of the evidence on humoral and cellular responses to the SARS-CoV-2 Omicron VOC, as well as vaccine efficacy against this variant. Immunol Lett. 2022Mar;243:38–43. doi: 10.1016/j.imlet.2022.02.002
- Dighriri IM, Alhusayni KM, Mobarki AY, et al. Pfizer-BioNTech COVID-19 vaccine (BNT162b2) side effects: a systematic review. Cureus. 2022 Mar. doi: 10.7759/cureus.23526.
- Anand P, Stahel VP. The safety of Covid-19 mRNA vaccines: a review. Patient Saf Surg. 2021 May;15(1):20. doi: 10.1186/s13037-021-00291-9
- Oliver SE, Gargano <, Scobie <, et al. The advisory committee on immunization practices’ interim recommendation for use of Janssen COVID-19 vaccine — United States, February 2021. MMWR Morb Mortal Wkly Rep. 2021 Mar;70(9):329–332.doi: 10.15585/mmwr.mm7009e4.
- Food and Drug Administration. Janssen COVID-19 vaccine emergency use authorization. 2021. [cited 2023 Apr 12]. [ Online]. Online. https://www.fda.gov/emergency-preparedness-and-response/coronavirus-disease-2019-covid-19/Janssen-covid-19-vaccine
- Shinde V, Bhikha S, Hoosain Z, et al. Efficacy of NVX-CoV2373 Covid-19 Vaccine against the B.1.351 Variant. N Engl J Med. 2021 May;384(20):1899–1909.doi: 10.1056/NEJMoa2103055
- Li M, Yuan J, Lv G, et al. Myocarditis and pericarditis following COVID-19 vaccination: inequalities in age and vaccine types. J Pers Med. 2021 Oct;11(11):1106. doi: 10.3390/jpm11111106
- Frontera JA, Tamborska AA, Doheim MF, et al. Neurological events reported after covid-19 vaccines: an analysis of VAERS. Ann Neurol. 2022 Mar;91(6):756–771.doi: 10.1002/ana.26339
- Gringeri M, Battini V, Cammarata G, et al. Herpes zoster and simplex reactivation following COVID-19 vaccination: new insights from a vaccine adverse event reporting system (VAERS) database analysis. Expert Rev Vaccines. 2022 May;21(5):675–684.doi: 10.1080/14760584.2022.2044799
- Lv G, Yuan J, Xiong X, et al. Mortality rate and characteristics of deaths following COVID-19 vaccination. Front Med. 2021;8:670370. 10.3389/fmed.2021.670370
- Brown EG, Wood L, Wood S. The medical dictionary for regulatory activities (MedDRA). Drug Saf. 1999 Feb;20(2):109–117. doi: 10.2165/00002018-199920020-00002.
- International Council for Harmonisation of Technical Requirements for Pharmaceuticals for Human Use (ICH). MedDRA version 24.1: what’s new. 2021. [cited 2023 Apr 14]. [ Online]. Online. https://admin.meddra.org/sites/default/files/guidance/file/000636_whatsnew_24_1.pdf
- “Human disease ontology < ontology lookup service < embl-ebi.” [cited 2023 Jul 31]. [Online]. Available from: https://www.ebi.ac.uk/ols/ontologies/doid
- Li Y, Li J, Dang Y, et al. Temporal and spatial analysis of COVID-19 vaccines using reports from vaccine adverse event reporting system. JMIR Preprints. 2023. https://preprints.jmir.org/preprint/51007
- Singleton JA, Lloyd JC, Mootrey GT, et al. An overview of the vaccine adverse event reporting system (VAERS) as a surveillance system. Vaccine. 1999 Jul;17(22):2908–2917. doi: 10.1016/S0264-410X(99)00132-2
- Mozzicato P. MedDRA. Pharm med. 2009 Apr;23(2):65–75. doi: 10.1007/BF03256752
- MedDRA Maintenance and Support Services Organization (MSSO). Introductory guide MedDRA version 25.1. Sep. 2022.
- “Stata statistical software: release 17,” 2021.
- R Core Team, R: a Language and Environment for Statistical Computing. Vienna Austria: R Foundation for Statistical Computing [Online]. [cited Jul 312021]. [Online] https://www.R-project.org/
- Cohen AC. Estimating the parameter in a conditional poisson distribution. Biometrics. 1960;16(2):203–211. doi: 10.2307/2527552
- Jr DWH, Lemeshow S, Sturdivant RX. Applied logistic regression. Newark: John Wiley & Sons; 2013.
- Spearman C. The proof and measurement of association between two things. Am J Psychol. 1904;15(1):72–101. doi: 10.2307/1412159
- CDC. What to expect after getting a COVID-19 vaccine. Centers for Disease Control and Prevention. cited 2023 Apr 21. [ Online]. Available from: https://www.cdc.gov/coronavirus/2019-ncov/vaccines/expect/after.html
- CDC. COVID-19 vaccines and severe allergic reactions. Centers for Disease Control and Prevention. cited 2023 Apr 21. [ Online]. Available from: https://www.cdc.gov/coronavirus/2019-ncov/vaccines/safety/allergic-reaction.html
- CDC. COVID-19 vaccination. Centers for Disease Control and Prevention. [cited 2023 Apr 21]. [Online]. [Online] https://www.cdc.gov/coronavirus/2019-ncov/vaccines/index.html
- Paterson RW, Brown RL, Benjamin L, et al. The emerging spectrum of COVID-19 neurology: clinical, radiological and laboratory findings. Brain. 2020 Jul;143(10):3104–3120. doi: 10.1093/brain/awaa240
- Blumenthal KG, Ryan EE, Li Y, et al. The impact of a reported penicillin allergy on surgical site infection risk. Clin Infect Dis. 2018 Jan;66(3):329–336. doi: 10.1093/cid/cix794
- Sarti L, Lezmi G, Mori F, et al. Diagnosis and management of hypersensitivity reactions to vaccines. Expert Rev Clin Immunol. 2020 Sep;16(9):883–896. doi: 10.1080/1744666X.2020.1814745
- Davenport J, Gomez R, Smith D. Latex content in adult vaccines. Mil Med. 2020 Mar;185(3–4):354–355. doi: 10.1093/milmed/usz376
- Centers for Disease Control and Prevention. VAERS | vaccine Safety | CDC. [Online]. [Online] https://www.cdc.gov/vaccinesafety/ensuringsafety/monitoring/vaers/index.html