
 ?Mathematical formulae have been encoded as MathML and are displayed in this HTML version using MathJax in order to improve their display. Uncheck the box to turn MathJax off. This feature requires Javascript. Click on a formula to zoom.
ABSTRACT
Background
Cell-based quadrivalent inactivated influenza vaccines (IIV4c) avoid egg-adaptive mutations found in egg-based production, improving vaccine effectiveness (VE). Studies demonstrate improved VE for IIV4c relative to egg-based quadrivalent inactivated influenza vaccines (IIV4).
Research Design and Methods
We built on a static compartmental model developed by the CDC to estimate the influenza burden in persons 0–64 years that would be additionally averted by vaccination with IIV4c vs. IIV4. Model inputs were based on published data from 2017–2018, 2018–2019, and 2019–2020 Northern Hemisphere influenza seasons for the US.
Results
Over 3 influenza seasons, relative to IIV4, IIV4c would avert 31–39% more symptomatic cases, 29–40% more outpatient visits, 29–38% more hospitalizations and ICU admissions, and 34–49% more deaths vs. IIV4. In a deterministic sensitivity analysis, the main drivers were the relative VE of IIV4c vs. IIV4 in the 2017–2018 season and influenza burden estimates for the 2018–2019 and 2019–2020 seasons. Probabilistic sensitivity analysis showed that the interquartile range of symptomatic cases was ± 13% of baseline in 2017–2018, ±8% in 2018–2019, and ± 7% in 2019–2020.
Conclusions
IIV4c prevented significantly more symptomatic cases, outpatient visits, hospitalizations, and deaths than IIV4 in persons aged 0–64 years over 3 influenza seasons.
1. Introduction
Although much of the general public considers influenza a routine illness of mild severity [Citation1], it carries a high burden of disease. Each year, the influenza virus causes approximately 1 billion infections and 3–5 million severe cases, leading to nearly 650,000 deaths [Citation2,Citation3]. Severe cases requiring hospitalization most often affect older adults aged ≥65 years and children younger than 2 years but may affect people of all ages [Citation4]. Working-age adults have the highest rate of absenteeism among all age groups due to their own illness or caring for sick household members [Citation4–6]. Annual influenza vaccination is the most effective means of preventing infections and reducing associated negative outcomes, including medical visits, hospitalizations, and deaths [Citation7]. However, vaccine effectiveness (VE) varies annually depending on the match between vaccine viruses and circulating strains. A mismatch with the circulating strains may reduce VE and hence contribute to increased rates of influenza-related outcomes [Citation8–11].
Most influenza vaccines used in the United States are manufactured using hens’ eggs as the substrate for vaccine virus replication [Citation12]. Propagation of influenza vaccine viruses in hens’ eggs can promote mutations in the antigen-binding sites of egg-grown strains, a process known as egg-adaptation [Citation13]. Cell-based influenza vaccines avoid egg-adaptive mutations, improving potential match to circulating influenza viruses and therefore VE [Citation13,Citation14]. During the seasons evaluated, IIV4c was approved for people aged ≥4 years and has been approved for ≥6 months since 2021. Previous real world observational studies have shown that cell-based quadrivalent inactivated influenza vaccine (IIV4c) is more effective at preventing influenza-associated outcomes compared to egg-based quadrivalent inactivated influenza vaccine (IIV4) [Citation14].
Because the overall public health impact of influenza vaccination in any given season depends on a number of factors including the severity of the seasons (ie, number of influenza infections and associated complications), influenza vaccine coverage and timing, and the absolute effectiveness of the influenza vaccines used, the impact of improved effectiveness of one vaccine over another will also vary depending on these parameters. Relative vaccine effectiveness values are often misconstrued as being equivalent to the proportionate change in burden averted expected in the overall population with use of one vaccine vs another. However, the reality is that when accounting for the other factors that influence the overall public health impact of influenza vaccination, rVE values may differ substantially from the true proportionate change in influenza burden averted expected with use of one vaccine over another.
To provide information on the impact of the use of IIV4c compared to IIV4 on influenza-related outcomes, we conducted a modeling study to estimate the burden of influenza that would be averted if all vaccinated individuals in the 2017–2020 influenza seasons in the United States received IIV4c compared to IIV4.
2. Patients and methods
2.1. Model design and structure
A static compartmental model based on US Centers for Disease Control and Prevention (CDC) calculation methods (Method 2 in Tokars et al. 2018 [Citation15]) was used to estimate the burden of influenza in the population aged 0–64 years that might be averted by vaccination during a Northern Hemisphere influenza season (October to September of the following year). Tokars et al. developed a static compartmental model that analyzed simulated daily counts of vaccinations and influenza cases to estimate the total burden averted by vaccination [Citation15]. Tokars and colleagues considered this model their reference model and tested seven alternative static model against it for accuracy and determined that Methods 2 and 3 performed optimally vs. the reference model. For our analysis, we chose Method 2 as the base case because it has high accuracy compared with the reference model in Tokars et al. and also has a simpler, more transparent structure, requiring fewer derived variables than Method 3.
Patients aged ≥65 years were not included in the analysis because the US Advisory Committee for Immunization Practices (ACIP) recommends an adjuvanted or higher-dose influenza vaccine for this population [Citation16]. A compartmental model is a modeling technique that classifies subjects to different ‘compartments’ or health states (eg, susceptible or infected). Subjects can then move between compartments over time (with each timepoint being one ‘cycle’) based on the assumed structure of the model and input parameters used. The model was stratified by subgroups of patients aged 0–4 years, 5–17 years, 18–49 years, and 50–64 years, which were then summed to give the total burden averted for 0–64 years.
In the model, pair-wise comparisons of two distinct vaccination scenarios (everyone receiving IIV4c vs. everyone receiving IIV4) were performed. Burden averted was expressed as the total cases prevented for each vaccination scenario as well as the incremental difference in cases prevented between vaccines (ie, total averted QIVc – total averted QIVe) for the outcomes of interest. The reference model included seven health states that reflected combinations of individual status variables (influenza case or non-case [ie, well], vaccinated or nonvaccinated, and immune or susceptible) (Supplementary Figure S1). Each of the input parameters are used to calculate the number of subjects in each of the seven health states for each month and then the cumulative number of outcomes that occurred was calculated and subtracted from the number of outcomes expected if none of the subjects were vaccinated. The model applied vaccine coverage and effectiveness only to the non-case population and did not include any post-vaccination immunity lag.
2.2. Model inputs
The model incorporated estimates of population counts, vaccine coverage, VEs, and influenza burden () obtained from the literature and CDC surveillance data for the 2017–2018, 2018–2019, and 2019–2020 influenza seasons [Citation17–22]. The age subgroups aligned with those reported by the CDC for influenza burden estimates but inputs for case distribution, vaccine coverage, and VE reported in the literature did not exactly align and were mapped to those used by the model and the CDC (Supplementary Table S1) [Citation17–23]. The population size of 271,568,000 persons 0–64 years of age was determined from 2019 US census data and assumed to be constant across the 3 seasons [Citation23].
Figure 1. Burden of influenza in the United States 2017–2020 among people 0–64 years (number and rate of events) as estimated by the US Centers for Disease Control and Prevention (CDC). Data are presented with point estimate and 95% confidence interval.
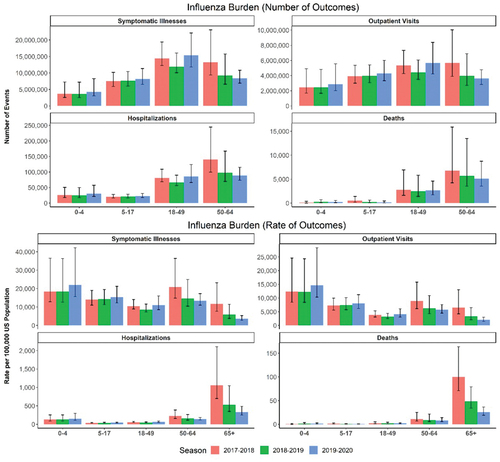
VE inputs for IIV4 were based on CDC estimates of absolute VE (aVE; ie, VE relative to no vaccination) for any influenza vaccine in each age group in each season (Supplementary Table S2) [Citation17–19]. The aVE for IIV4c was estimated using published relative VE (rVE) estimates for IIV4c vs. IIV4 from studies that used the same databases and analysis methods to permit greater comparability across the three seasons [Citation24]. Estimates of rVE were assumed to be constant across age subgroups and were 19.3% for the 2017–2018 season, 7.6% for the 2018–2019 season, and 17.2% for the 2019–2020 season [Citation25–27]. The aVE of IIV4c was calculated using the following equation [Citation28]:
Monthly vaccine coverage percentages for each season were extracted from the CDC Weekly Influenza Vaccination Dashboard [Citation20], which presents coverage data for each season for the period from July to May of the following year. To align with the seasonal definition in the model (October to September of the next year), we added all vaccinations occurring in July, August, and September to the count for October. Monthly coverage rates for each season by age group appear in Supplementary Table S3.
Case inputs in the model were based on the number of positive influenza specimens per week during each season, as reported from CDC sentinel public health laboratories [Citation20]. The percentage of weekly cases was determined by dividing the number of cases per week by the sum of all cases in the season. This weekly proportion was then multiplied by the total number of symptomatic cases in each age group to estimate the total incident cases by week. The total incident cases by week were converted to a monthly scale to include in the analysis as the incident cases during the month (Supplementary Table S4).
We included burden estimates for influenza-related outcomes of interest, including estimates of the number of influenza-related symptomatic cases, outpatient visits, hospitalizations, intensive care unit (ICU) admissions, and deaths as originally reported by the CDC (Supplementary Table S2) [Citation29–31]. We note that the original disease burden estimates for the three seasons used in the model are no longer available and were recently updated [Citation5,Citation32,Citation33]. These updated burden estimates were not available at the time the analysis was conducted and are not expected to meaningfully change the conclusions of the study relative to the estimates used. Hospitalization data were obtained from the Influenza Hospitalization Surveillance Network (FluSurv-NET) [Citation21]. Outpatient visit numbers were determined by the CDC using a fixed ratio relative to the total incidence of influenza-related hospitalizations [Citation21,Citation22]. Influenza-related deaths were estimated directly from reported data [Citation22]. Rates of influenza-related ICU admissions were estimated as a proportion of hospitalizations and were 15.5% for the 2017–2018 season and 17.8% for the 2018–2019 season, as reported by the CDC [Citation22]. The CDC did not report an ICU rate for the 2019–2020 season; the rate used in the model—17.3%—was calculated as the average of the ICU rates from the 2010–2011 season to the 2018–2019 season [Citation22]. ICU rates were assumed to be constant across age groups. Burden averted was also expressed as the number needed to vaccinate (NNV), which is the number of outcomes prevented divided by the number of people vaccinated.
2.3. Sensitivity analyses
To evaluate the impact of model input parameters on results, deterministic sensitivity analyses (DSA) were conducted to evaluate the change from ‘base case’ estimates when the lower and upper bounds of 95% confidence intervals (CIs) for input parameters were used in the model (Supplementary Table S2). Where no 95% CIs were reported, the bounds were assumed to be ± 20% around the point estimate used in the base case. Results of DSAs corresponding to the lower and upper bounds of the tested parameters were ranked based on their absolute difference and presented as a tornado diagram for the incremental outcome averted.
A probabilistic sensitivity analysis (PSA) was performed to account for the joint uncertainty of the underlying parameter estimates by repeatedly sampling from a specified distribution of input parameters. For each comparison, 1000 PSA simulations were run to generate the empirical distribution for burden averted because an a priori analysis determined that the burden averted distribution converges at 1000 simulations. The probabilistic distributions used to approximate the uncertainty of the model parameters included normal distribution, beta distribution, and Dirichlet distribution. The parameters used to inform these distributions were calculated using the mean value (ie, the base case point estimate) and standard errors (Supplementary Table S5) calculated from the CIs used in the DSA, using the equation:
Where UB is ‘upper bound’ and LB is ‘lower bound.’
DSA and PSA were conducted for all outcomes for the 2017–2018 season, which demonstrated consistency across outcomes in sensitivity analysis results, so DSA and PSA were conducted only for symptomatic cases and deaths in the following two seasons.
3. Results
3.1. Modeling analysis
3.1.1. Overall population
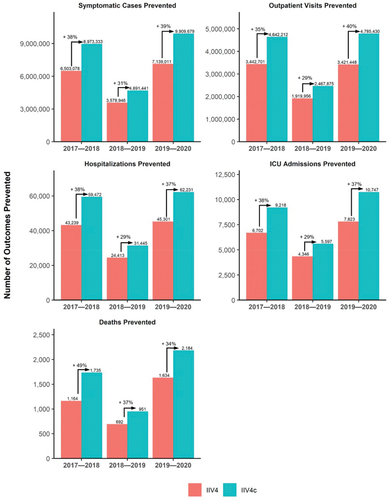
The modeling analysis showed that in the overall population aged 0–64 years, use of IIV4c would prevent more symptomatic cases, outpatient visits, hospitalizations, ICU admissions, and deaths compared to use of IIV4 in all 3 seasons evaluated (). In the 2017–2018 season, for example, 38% more symptomatic cases, 35% more outpatient visits, 38% more hospitalizations, 38% more ICU visits, and 49% more deaths would be averted among recipients of IIV4c compared to IIV4. When separated into children aged 0–17 and adults 18–64 years, there were similar proportionate reductions in burden with use of IIV4c compared to IIV4 (Supplementary Figures S2–S3). Despite there being 2.7 times as many people aged 18–64 years in the US compared to 0–17 years, there were more symptomatic illnesses and outpatient visits averted in the 0–17 age group due to a combination of the high burden of influenza, high influenza vaccine coverage, and generally higher absolute VE for this age group (Supplementary Table 6).
Figure 2. Estimated influenza disease burden averted in persons aged 0–64 years during the 2017–2018, 2018–2019, and 2019–2020 influenza seasons.
3.1.2. Number needed to vaccinate
The model demonstrated lower NNV to avoid any outcome with use of IIV4c than with IIV4 (, Supplementary Table S7). The NNV results mirror the patterns seen in the burden averted results and represent the number of patients that would need to be vaccinated to prevent a single outcome. One benefit of the NNV results is that NNV is based on the number of people vaccinated and therefore allows for a more equal comparison across seasons, even if there are differences in vaccine coverage between seasons.
Table 1. Numbers needed to vaccinate to prevent influenza-related outcomes with IIV4c and IIV4 in persons aged 0–64 years.
3.2. Deterministic sensitivity analysis
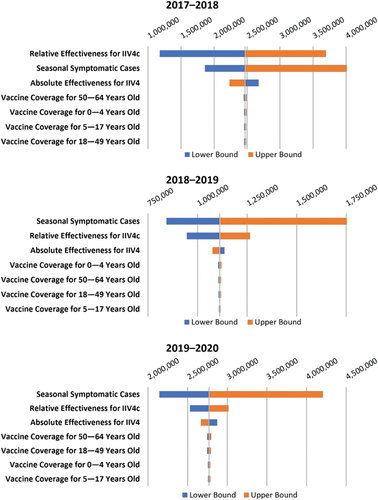
In the DSA, the incidence of influenza-related outcomes of interest (ie, symptomatic cases, outpatient visits, etc.) had the greatest impact on the model results during the 2018–2019 and 2019–2020 seasons, whereas during the 2017–2018 seasons, the rVE of IIV4c had the greatest impact. (and Supplementary Table S8) shows the DSA results for symptomatic cases; other outcomes followed similar patterns (Supplementary Figures S4–S6). rVE was the most important factor in the analysis for the 2017–2018 season except for averted deaths, which had a greater impact on the model (Supplementary Figure S4). In the 2018–2019 and 2019–2020 seasons, the influenza burden estimate was the most important factor, followed by rVE of IIV4c (, S5, and S6). The aVE of IIV4 had a nonlinear influence on incremental additional outcomes averted with IIV4c vs. IIV4. Although the total number of cases prevented is highest when aVE is high, the proportionate impact of improved VE is inversely related to aVE (ie, the lower the aVE, the larger the percent increase in burden averted). Consequently, the incremental number of symptomatic cases prevented increased when the lower limits of the 95% CI for aVE were used in the DSA and decreased when the upper limits were used – the opposite trend compared with all other model input parameters (, Supplementary Table S8).
Figure 3. Tornado diagram of incremental burden averted for symptomatic cases of influenza in persons aged 0–64 years in the deterministic sensitivity analysis (DSA). aVE, absolute vaccine effectiveness; IIV4c, cell-based quadrivalent inactivated influenza vaccine; IIV4, egg-based quadrivalent inactivated influenza vaccine; rVE, relative vaccine effectiveness.
3.3. Probabilistic sensitivity analysis
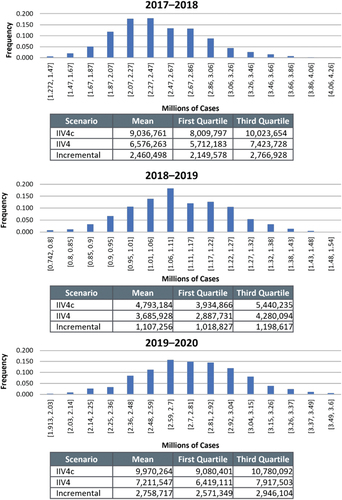
After 1000 simulations were completed for the PSA, the averted symptomatic case distributions fell within the expected parameters and appeared close to normal ( and S7). The PSAs evaluated all outcomes in the 2017–2018 season, which showed that the distribution of incremental burden averted was similar across outcomes. In each of the seasons, the mean PSA results for symptomatic cases were within a 0.5% difference of the base case results, and the interquartile ranges (IQR) were ± 13% of base case in 2017–2018, ±8% in 2018–2019, and ± 7% in 2019–2020.
Figure 4. Histograms of distribution of averted symptomatic influenza cases for persons aged 0–64 years in the probabilistic sensitivity analysis (PSA) during each season.
4. Discussion
Using a modeling analysis that estimated the influenza burden averted with use of IIV4c vs. IIV4, we found that use of IIV4c would prevent more influenza-related outcomes, including symptomatic cases, outpatient visits, hospitalizations, ICU visits, and deaths among persons aged 0–64 years. The total and incremental burden averted varied by age group depending on the burden of disease, vaccine coverage, and aVE in the age group, but there was a consistent substantial benefit observed when everyone received IIV4c across the three seasons. DSAs demonstrated that the rVE of IIV4c vs. IIV4 had the greatest impact on these results during the 2017–2018 influenza season, whereas during the 2018–2019 and 2019–2020 seasons, each influenza-related outcome of interest was the most important factor in the analysis. In addition, PSAs demonstrated that even when uncertainty in parameter estimates was incorporated into the model, IQRs for symptomatic cases only varied by ± 13% of base case in 2017–2018 and even less in the other seasons.
The disease burden of influenza varies from season to season due to differences in the specific influenza strains circulating, antigenic drift, and egg-adaptation, all of which can also influence influenza vaccine effectiveness. The CDC designated the 2017–2018 season as high severity and the 2018–2019 and 2019–2020 seasons as moderate severity [Citation5,Citation32,Citation33]. Within each season, the burden of influenza varied among age groups. The 2017–2018 season was unusual in that rates of hospitalizations and deaths were elevated in all age groups, with >43,000 hospitalizations in children and adolescents and 8100 deaths in adults younger than 65 years [Citation32]. Although the 2019–2020 season was considered one of moderate severity, total numbers of influenza-related outcomes approached those of the 2017–2018 season and exceeded them in some age groups. In particular, nearly 46,000 children and adolescents were hospitalized for influenza, and 9000 adults aged 18–64 years died from influenza [Citation33]. These findings highlight the importance of using the most effective influenza vaccine available, including for young children and those that have low rates of vaccination, such as adults younger than 65 years [Citation17–19]. It also highlights the importance of translating vaccine effectiveness estimates to estimates of burden averted in future research on the impact of influenza vaccination.
This study utilized vaccine effectiveness estimates generated using the same database and methods to improve comparability across seasons. However, the estimates of the rVE IIV4c vs IIV4 utilized should also be considered within the broader body of evidence comparing the two vaccines. A systematic review and meta-analysis published after the time of this study reported pooled estimates of the vaccine effectiveness of IIV4c vs IIV4 among patients 4–64 years of age of 16.2% [95% CI 7.6 to 24.8] for 2017–2018 (vs 19.3% in the model), 6.1% [4.9 to 7.3] in 2018–2019 (vs 7.6% in the model) and 10.1% [6.3 to 14.0] in 2019–2020 (vs 17.2% in the model) [Citation34]. Using these values in the model would have resulted in 32%, 25%, and 22% increases in symptomatic cases averted (and similar percentage increases for the other outcomes) with use of IIV4c vs IIV4 in 2017–2018, 2018–2019, and 2019–2020 (compared to 38%, 31%, and 39% for the rVE values used in this study).
Some additional limitations may have influenced our results. First, the static structure used does not factor in reduced disease transmission due to reduction in cases and therefore likely conservatively underestimates the true cases averted. A dynamic model would be needed to account for the indirect effect of vaccination (ie, herd immunity). Second, because CDC disease burden estimates correspond to the overall population, including both vaccinated and unvaccinated people, they may under-estimate burden of disease in the unvaccinated population, which would likely lead to an underestimation of averted cases in our analysis. Third, because age-specific data were not available for ICU admission rate and overall age group data were used for the rVE of IIV4e, the model does not capture the potential variability that might exist for these parameter inputs across age groups.
5. Conclusion
In conclusion, we developed a static compartmental model to compare the impact of influenza vaccinations with IIV4c vs. IIV4 in the US over the 2017–2018, 2018–2019, and 2019–2020 influenza seasons using disease burden data from the CDC and real-world data on the relative effectiveness of IIV4c compared with IIV4. Our analysis showed that if all vaccinated individuals 0–64 years of age during the 2017–2020 influenza seasons in the United States received IIV4c instead of IIV4, it would have prevented 31% to 39% more symptomatic cases with subsequent proportionate reductions in outpatient visits, hospitalizations, ICU admissions, and deaths.
Declaration of interest
A Taylor, A Sardesai and H Toro-Diaz are employees of Evidera, which received funding for this study from Seqirus. I McGovern and M Haag are employees of CSL Seqirus Inc. The authors have no other relevant affiliations or financial involvement with any organization or entity with a financial interest in or financial conflict with the subject matter or material discussed in the manuscript.
Reviewer disclosures
A reviewer on this manuscript has disclosed that they own shares in Vicebio ltd, which is developing vaccines against pathogens other than influenza. Peer reviewers on this manuscript have no other relevant financial or other relationships to disclose.
Author contributions
Conception and design: IM; Analysis and interpretation of the data: IM, AT, AS, HT, MH; Drafting of the paper/revising it critically for intellectual content: IM, AT, AS, HT, MH; Final approval of published version: IM, AT, AS, HT, MH.
Geolocation information
United States of America
Ethics approval
Ethical review and approval were not required for the retrospective analysis of the deidentified secondary data modeled in this study. Informed consent was not required for this type of study.
Supplemental Material
Download PDF (1.6 MB)Acknowledgments
Financial support for this work was provided by CSL Seqirus. AT, AS, and HT received investigator fees for their time and efforts supporting this work and were funded by CSL Seqirus. IM and MH are employees of CSL Seqirus, the manufacturer of IIV4c. Medical consultant C. Gordon Beck and Amanda M. Justice provided editorial and medical writing support that was funded by CSL Seqirus.
Data availability statement
Data was obtained from publicly available sources and is referenced in the manuscript.
Supplementary material
Supplemental data for this article can be accessed online at https://doi.org/10.1080/14760584.2024.2330643
Additional information
Funding
References
- Schmid P, Rauber D, Betsch C, et al. Barriers of influenza vaccination intention and behavior—a systematic review of influenza vaccine hesitancy, 2005–2016. PLoS One 2017;12(1):e0170550. doi: 10.1371/journal.pone.0170550
- Iuliano AD, Roguski KM, Chang HH, et al. Estimates of global seasonal influenza-associated respiratory mortality: a modelling study. Lancet. 2018;391(10127):1285–1300. doi: 10.1016/S0140-6736(17)33293-2
- Langer J, Welch VL, Moran MM, et al. High clinical burden of influenza disease in adults aged ≥ 65 years: can we do better? A systematic literature review. Adv Ther 2023;40(4):1601–1627. doi: 10.1007/s12325-023-02432-1
- Tokars JI, Olsen SJ, Reed C. Seasonal incidence of symptomatic influenza in the United States. Clin Infect Dis. 2018;66(10):1511–8. doi: 10.1093/cid/cix1060
- Centers for Disease Control and Prevention [Internet]. Atlanta (GA): CDC; c1946–2023. Estimated flu-related illnesses, medical visits, hospitalizations, and deaths in the United States—2018–2019 flu season; 2021 Sep 29 [cited 2023 Oct 25]. Available from: https://archive.cdc.gov/#/details?url=https://www.cdc.gov/flu/about/burden/2018-2019.html
- de Courville C, Cadarette SM, Wissinger E, et al. The economic burden of influenza among adults aged 18 to 64: a systematic literature review. Influenza Other Respir Viruses 2022;16(3):376–385. doi: 10.1111/irv.12963
- World Health Organization. Vaccines against influenza: WHO position paper—May 2022. Wkly Epidemiol Rec 2022;97(19):185–208.
- McLean HQ, Thompson MG, Sundaram ME, et al. Influenza vaccine effectiveness in the United States during 2012–2013: variable protection by age and virus type. J Infect Dis 2015;211(10):1529–1540. doi: 10.1093/infdis/jiu647
- Gaglani M, Pruszynski J, Murthy K, et al. Influenza vaccine effectiveness against 2009 pandemic influenza A(H1N1) virus differed by vaccine type during 2013–2014 in the United States. J Infect Dis. 2016;213(10):1546–1556. doi: 10.1093/infdis/jiv577
- Flannery B, Kondor RJG, Chung JR, et al. Spread of antigenically drifted influenza A(H3N2) viruses and vaccine effectiveness in the United States during the 2018–2019 season. J Infect Dis. 2020;221(1):8–15. doi: 10.1093/infdis/jiz543
- Tenforde MW, Kondor RJG, Chung JR, et al. Effect of antigenic drift on influenza vaccine effectiveness in the United States–2019–2020. Clin Infect Dis 2021;73(11):e4244–e50. doi: 10.1093/cid/ciaa1884
- Centers for Disease Control and Prevention [Internet]. Atlanta (GA): CDC; c1946–2023. How influenza (flu) vaccines are made; [updated 2022 Nov 3;cited 2023 Oct 25]. Available from: https://www.cdc.gov/flu/prevent/how-fluvaccine-made.htm
- Rockman S, Laurie K, Ong C, et al. Cell-based manufacturing technology increases antigenic match of influenza vaccine and results in improved effectiveness. Vaccines (Basel). 2022;11(1):52. doi: 10.3390/vaccines11010052
- Puig-Barberà J, Tamames-Gómez S, Plans-Rubio P, et al. Relative effectiveness of cell-cultured versus egg-based seasonal influenza vaccines in preventing influenza-related outcomes in subjects 18 years old or older: a systematic review and meta-analysis. Int J Environ Res Public Health. 2022;19(2):818. doi: 10.3390/ijerph19020818
- Tokars JI, Rolfes MA, Foppa IM, et al. An evaluation and update of methods for estimating the number of influenza cases averted by vaccination in the United States. Vaccine. 2018;36(48):7331–7337. doi: 10.1016/j.vaccine.2018.10.026
- Grohskopf LA, Blanton LH, Ferdinands JM, et al. Prevention and control of seasonal influenza with vaccines: recommendations of the advisory committee on immunization practices—United States, 2022–23 influenza season. MMWR Recomm Rep. 2022;71(1):1–28. doi: 10.15585/mmwr.rr7101a1
- Centers for Disease Control and Prevention [Internet]. Atlanta (GA): CDC; c1946–2023. Seasonal influenza vaccine effectiveness, 2017–2018; [updated 2019 Feb 25;cited 2023 Jun 27]. Available from: https://www.cdc.gov/flu/vaccines-work/2017-2018.html
- Centers for Disease Control [Internet]. Atlanta (GA): CDC; c1946–2023. US flu VE data for 2018–2019; [updated 2019 Nov 6;cited 2023 Jun 27]. Available from: https://www.cdc.gov/flu/vaccines-work/2018-2019.html.
- Centers for Disease Control and Prevention [Internet]. Atlanta (GA): CDC; c1946–2023. US flu VE data for 2019-2020; [updated 2020 Dec 22;cited 2023 Jun 26]. Available from: https://www.cdc.gov/flu/vaccines-work/2019–2020.html
- Centers for Disease Control and Prevention [Internet]. Atlanta (GA): CDC; c1946–2023. Weekly flu vaccination dashboard. [cited 2023 Jun 26]. Available from: https://www.cdc.gov/flu/fluvaxview/dashboard/vaccination-dashboard.html
- Centers for Disease Control and Prevention [Internet]. Atlanta (GA): CDC; c1946–2023. Influenza hospitalization surveillance network (FluSurv-NET). [cited 2023 Jun 26]. Available from: https://www.cdc.gov/flu/weekly/influenza-hospitalization-surveillance.htm.
- Centers for Disease Control and Prevention [Internet]. Atlanta (GA): CDC; c1946–2023. How CDC estimates the burden of seasonal influenza in the U.S. [updated 2019 Nov 22;cited 2023 Oct 25]. Available from: https://www.cdc.gov/flu/about/burden/how-cdc-estimates.htm
- U. S. Census Bureau [Internet]. Washington (DC): U.S. Census Bureau; c1902–2023. 2019 Annual social and economic supplements; [updated 2021 Oct 8;cited 2023 Oct 25]. Available from: https://www.census.gov/data/datasets/2019/demo/cps/cps-asec-2019.html
- Boikos C, McGovern I, Molrine D, et al. Review of analyses estimating relative vaccine effectiveness of cell-based quadrivalent influenza vaccine in three consecutive US influenza seasons. Vaccines (Basel). 2022;10(6):896. doi: 10.3390/vaccines10060896
- Boikos C, Sylvester GC, Sampalis JS, et al. Relative effectiveness of the cell-cultured quadrivalent influenza vaccine compared to standard, egg-derived quadrivalent influenza vaccines in preventing influenza-like illness in 2017–2018. Clin Infect Dis. 2020;71(10):e665–71. doi: 10.1093/cid/ciaa371
- Boikos C, Fischer L, O’Brien D, et al. Relative effectiveness of the cell-derived inactivated quadrivalent influenza vaccine versus egg-derived inactivated quadrivalent influenza vaccines in preventing influenza-related medical encounters during the 2018–2019 influenza season in the United States. Clin Infect Dis 2021;73(3):e692–8. doi: 10.1093/cid/ciaa1944
- Imran M, Ortiz JR, McLean HQ, et al. Relative effectiveness of cell-based versus egg-based quadrivalent influenza vaccines in adults during the 2019–2020 influenza season in the United States. Open Forum Infect Dis 2022;9(10):ofac532. doi: 10.1093/ofid/ofac532
- Lewis NM, Chung JR, Uyeki TM, et al. Interpretation of relative efficacy and effectiveness for influenza vaccines. Clin Infect Dis. 2022;75(1):170–175. doi: 10.1093/cid/ciab1016
- Centers for Disease Control and Prevention [Internet]. Atlanta (GA): CDC; c1946–2023. Archived: estimated influenza illnesses, medical visits, hospitalizations, and deaths in the United States—2017–2018 influenza season. [cited 2023 Jun 27]. Available from: https://www.cdc.gov/flu/about/burden/2017-2018/archive.htm
- Centers for Disease Control and Prevention [Internet]. Atlanta (GA): CDC; c1946–2023. Archived: estimated influenza illnesses, medical visits, hospitalizations, and deaths in the United States—2018–2019 influenza season. [cited 2023 Jun 27]. Available from: https://www.cdc.gov/flu/about/burden/2018-2019/archive-09292021.html
- Centers for Disease Control and Prevention [Internet]. Atlanta (GA): CDC; c1946–2023. Archived: estimated influenza illnesses, medical visits, hospitalizations, and deaths in the United States—2019–2020 influenza season. [cited 2023 Jun 27]. Available from: https://www.cdc.gov/flu/about/burden/2019-2020/archive-09292021.html
- Centers for Disease Control and Prevention [Internet]. Atlanta (GA): CDC; c1946–2023. Estimated flu-related illnesses, medical visits, hospitalizations, and deaths in the United States—2017–2018 flu season; 2021 Sep 30 [cited 2023 Oct 25]. Available from: https://archive.cdc.gov/#/details?url=https://www.cdc.gov/flu/about/burden/2017-2018.htm
- Centers for Disease Control and Prevention [Internet]. Atlanta (GA): CDC; c1946–2023. Estimated flu-related illnesses, medical visits, hospitalizations, and deaths in the United States—2019–2020 flu season. 2022 Oct 7 [cited 2023 Oct 25]. Available from: https://www.cdc.gov/flu/about/burden/2019-2020.html
- Coleman BL, Gutmanis I, McGovern I, et al. Effectiveness of cell-based quadrivalent seasonal influenza vaccine: a systematic review and meta-analysis. Vaccines (Basel). 2023;11(10):1607. doi: 10.3390/vaccines11101607