
 ?Mathematical formulae have been encoded as MathML and are displayed in this HTML version using MathJax in order to improve their display. Uncheck the box to turn MathJax off. This feature requires Javascript. Click on a formula to zoom.
ABSTRACT
Background
Traditional vaccine development, often a lengthy and costly process of three separated phases. However, the swift development of COVID-19 vaccines highlighted the critical importance of accelerating the approval of vaccines. This article showcases a seamless phase 2/3 trial design to expedite the development process, particularly for multi-valent vaccines.
Research Design and Methods
This study utilizes simulation to compare the performance of seamless phase 2/3 design with that of conventional trial design, specifically by re-envisioning a 9-valent HPV vaccine trial. Across three cases, several key performance metrics are evaluated: overall power, type I error rate, average sample size, trial duration, the percentage of early stop, and the accuracy of dose selection.
Results
On average, when the experimental vaccine was assumed to be effective, the seamless design that performed interim analyses based solely on efficacy saved 555.73 subjects, shortened trials by 10.29 months, and increased power by 3.70%. When the experimental vaccine was less effective than control, it saved an average of 887.73 subjects while maintaining the type I error rate below 0.025.
Conclusion
The seamless design proves to be a compelling strategy for vaccine development, given its versatility in early stopping, re-estimating sample sizes, and shortening trial durations.
1. Introduction
Vaccination is one of the most effective ways to reduce mortality and morbidity from infectious diseases. The recent success in developing COVID-19 vaccines underscores the importance, as well as the feasibility, of fast development and approval of safe and effective vaccines [Citation1–3]. The objective of this article is to introduce and develop the master-protocol-based, seamless phase II-III trial design strategy that could be used to accelerate the development of vaccine, in particular multi-valent vaccine.
Conventionally, vaccine development is a long, complex and expensive process, consisted of three separated phases. Phase 1 primarily focuses on safety and possibly immunogenicity, usually involves a small group of subjects (20–80). Phase 2 consists of more subjects (hundreds of people) to explore safety, immunogenicity, proposed doses, schedule of immunizations, and method of delivery. Phase 3 trials are randomized and double-blind confirmatory studies that continue to assess vaccine safety and immunogenicity on a much larger scale (thousands to tens of thousands of people) and explore rare adverse effects that may not be found in previous trials with small groups of subjects. With unprecedented progress of biomedical research, this conventional paradigm has become increasingly cumbersome and inefficient [Citation4]. First, the conventional approach requires the separate development of a research protocol, regulatory compliance, funding, and related infrastructure for each phase of the development, resulting in excessive ‘time-to-clinical use,’ overhead and overlap of infrastructure. Second, the ‘white’ space between phases slows down the process of testing candidate agents. Third, the data from each phase are analyzed separately (e.g. phase 3 trials do not directly use the data from phase 2 trials), which wastes information and results in larger overall sample size.
Novel adaptive designs, including seamless designs and master protocol, provide a useful way to improve the efficiency and success rate of clinical trials, as noted by US Food and Drug Administration (FDA) guidance [Citation5,Citation6]. These novel approaches are widely accepted and increasingly used in cancer treatment development but are less known and under-utilized in vaccine trials. The objective of this article is to introduce and extend seamless phase 2/3 trial design strategy with application to multi-valent vaccine development.
There is a rich body of literature on phase 2/3 adaptive trial designs, many of which focus on oncology. Ellenberg and Eisenberger proposed a two-stage phase 2/3 design for binary outcomes, using futility early stopping rule after stage 1 [Citation7]. Thall et al. developed a two-stage phase 2/3 design that optimizes the expected overall sample size, controlling over type I error rate and power [Citation8]. Schaid et al. proposed a 2-stage phase 2/3 design to screen multiple experimental treatments in stage 1, following by randomized comparison to the control in phase 3 [Citation9]. Bauer and Kieser proposed an adaptive two-stage design for the situation of multiple treatments to be compared with a control [Citation10]. Stallard and Todd presented a group sequential approach incorporating treatment selection [Citation11]. Liu and Pledger developed a two-stage phase 2/3 trial design with multiple doses [Citation12]. Schmidli et al. provided several examples of phase 2/3 trial designs [Citation13]. Jiang and Yuan proposed a seamless phase 2/3 strategy to reduce the sample size for dose optimization [Citation4].
The majority of these designs evaluate the effectiveness of the treatment based on a single primary endpoint. Multi-valent vaccine trials, however, aim to demonstrate the efficacy of the vaccine for each pathogen and thus require the use of co-primary endpoints (CPEs). Such trials are defined as success if and only if all CPEs meet the efficacy requirement simultaneously [Citation14,Citation15]. For example, 9-valent human papillomavirus (HPV) vaccine trial requires that the geometric mean titer ratios of each of 9 HPV types (i.e. 9 CPEs) reach statistical significance [Citation16]. In this paper, we elucidate a seamless phase 2/3 approach for multi-valent vaccine trials. Compared to the conventional vaccine trial design paradigm, the proposed design has several advantages: (1) requires only one master protocol to encompass both phase 2 and phase 3, simplifying the trial logistics, infrastructure requirements and regulatory approval; (2) is efficient as the design use the data from both phases to compare the vaccine with the control, thus reducing the total sample size and associated cost; (3) allows to re-estimate the sample size of phase 3 in light of phase 2 data, if the effect size assumed for the sample size determination at the trial design phase deviates from the truth, making the trial more adaptive; (4) allows early stopping for superiority if the trial shows better treatment effect than expected, shortening the vaccine development time.
The remaining of this article is organized as follows. Section 2 first describes the adaptive seamless phase 2/3 design for multi-valent vaccine trials in detail, then provides the simulation scheme for evaluating the operating characteristics of the proposed design and compares it with the conventional approach. Section 3 presents the results. Summary and discussion are provided in Section 4.
2. Methods
2.1. Trial design
In alignment with vaccine development objectives, distinct trial scenarios have been designed to validate the efficacy of K-valent vaccines. These include: (1) a seamless phase 2/3 design focusing on efficacy for interim analysis (denoted as Case 1), (2) a seamless phase 2/3 design considering both safety and efficacy for interim analysis (denoted as Case 2), and (3) a two-stage trial assessing interim analysis under both balanced and unbalanced sample allocation ratios (denoted as Case 3). Post-vaccination immunogenicity responses, presumed to follow a K-variate normal distribution, serve as CPEs for K = 1, … , K. For Cases 1 and 2, initially, a Phase 2 stage is conducted to evaluate M (m = 1, … , M) doses of an experimental vaccine against a positive control vaccine, aiming to select an optimal dose, S. Phase 3 stage is then conducted to compare dose S against the control. For Case 3, an experimental vaccine is compared with a positive control vaccine under rT : rC sample allocation ratios. illustrates the workflow for these scenarios. Detailed methodological insights are available in the Appendix.
Figure 1. Design flow chart.
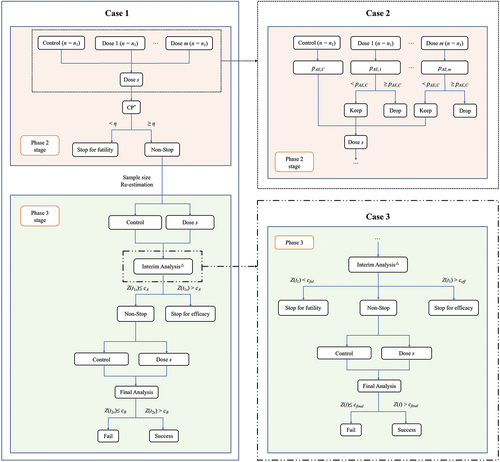
2.1.1. Case 1: seamless phase 2/3 design based on efficacy for interim analysis
This proposed design consists of a phase 2 stage and a phase 3 stage that are seamlessly connected. The trial starts by equally randomized n1 patients into the M doses of the vaccine and the control group. At the end of phase 2, an interim analysis is conducted to compare the M doses of the experimental vaccine against the control to identify the optimal dose with superior efficacy. The go/no-go decision leans on conditional power (CP), gauging the probability of obtaining statistically significant results if the trial continued and completed phase 3 stage with an additional n2 participants. Should the CP for the optimal dose fall below a pre-specified boundary η (e.g. η = 0.5), indicating a slim probability of positive outcomes, the trial is halted; otherwise, it proceeds to the phase 3 stage. Of note, only the optimal dose proceeds to phase 3 stage, with suboptimal doses ceasing after phase 2 stage.
The interim data from Phase 2 stage offer an opportunity to adaptively refine the original trial design, enhancing alignment with trial objectives. Adaptations include sample size re-estimation and performing interim analysis in phase 3 stage for early efficacy determinations. The re-estimation of sample size is facilitated through CP, incorporating the anticipated overall power of the study, thereby updating the originally planned sample size n2. The decision for early stopping is implemented using a group sequential approach based on the O’Brian-Fleming alpha spending function [Citation17–19]. Specifically, after a certain proportion of information is collected during Phase 3 stage, the newly gathered information is combined with that from Phase 2 stage for interim analysis. The immunogenicity response results of the vaccine group and the control group are compared. If the statistic exceeds the pre-specified cA boundary, the trial will be stopped early, and a conclusion of vaccine efficacy will be drawn; otherwise, the trial continues, and ultimately, an analysis based on the combined information from Phases 2 and 2 stages is conducted. The combined statistic is compared with the pre-specified cB boundary. To control the inflation of Type I error due to sample size re-estimation, the inverse normal combination test is used to aggregate information from different stages when making decisions about efficacy.
2.1.2. Case 2: seamless phase 2/3 design based on safety and efficacy for interim analysis
Augmenting Case 1, this scenario introduces an additional safety stopping rule, enabling researchers to consider both efficacy and safety outcomes at the end of Phase 2 stage for dose selection and early stopping decisions. Specifically, the rate of adverse events (AEs) of grade 3 or higher occurring in the control group, denoted as pAE,C, is used as the upper limit acceptable for researchers. At the end of Phase 2 stage, the rate of grade 3 or higher AEs, pAE,m (m = 1, … , M), is calculated for each dose group of the experimental vaccine and compared with pAE,C. If the pAE,m for any dose exceeds that of the control group, that dose is excluded from the study. If all doses are excluded, the study is prematurely stopped and declared as a failure due to toxicity; Otherwise, the trial continues, and the remaining dose groups are subjected to futility stopping assessments. From the doses that survive both toxicity and futility evaluations, the one showing the best efficacy is selected to proceed to Phase 3 stage.
2.1.3. Case 3: two-stage design with interim analysis under even and uneven sample allocation ratios
Efficacy trials may benefit from control-favored randomization, whereas novel platforms or adjuvants might prioritize vaccine allocation for accelerated safety data accrual. Therefore, this scenario primarily focuses on how to conduct two-stage phase 3 design under conditions of unbalanced sample allocation ratios. Assuming the sample allocation ratio between the experimental group and the control group is rT : rC. Before the trial begins, the required sample size for each group under each endpoint is first estimated based on predetermined significance level, power, and estimated effect sizes. The largest sample size among all endpoints is chosen as the sample size for the entire study. If this sample size is below the minimum required by regulatory authorities, nmin, then nmin is chosen as the final sample size. After a certain proportion of information is collected during the trial, an interim analysis based on efficacy results is conducted, comparing the smallest statistic across K endpoints, z1, against the futility stopping boundary, cful, and the efficacy stopping boundary, ceff. If z1 is less than cful, the trial is prematurely stopped and declared a failure; if z1 is greater than ceff, the trial is prematurely stopped and declared as a success; otherwise, enrollment continues until the anticipated sample size is reached. If the trial proceeds, data from both stages are combined, and the smallest statistic across K endpoints, z2, is compared against the final analysis boundary, cfinal. If z2 exceeds cfinal, the trial is declared a success. This scenario employs a group sequential method design, where the initial sample sizes for each group, the efficacy stopping boundary, the futility stopping boundary, and the final analysis boundary are calculated using an O’Brian-Fleming type alpha spending function.
2.2. Simulation study
Monte Carlo experiment was conducted to probe the performance of these cases. The simulation study is based on a non-inferior 9-valent HPV vaccine trial that evaluated immunogenicity and tolerability in heterosexual men (HM) and women 16–26 years old [Citation16], full details in Supplementary Table S1. Briefly, the objective was to demonstrate non-inferior on month 7 geometric mean titers (GMTs). The trial was claimed successful when the lower bound of the two-sided 95% confidence interval (CI) of GMT ratio (HM/young women) is greater than the pre-specified statistical criterion (0.67) for each HPV type. In addition to studies with 9 CPEs, some HPV vaccines have 2 or 4 CPEs. Simulations for trials with 2 or 4 CPEs were also performed for sensitivity analysis purposes.
In the simulation study, we assume that the same endpoint (Geometric mean ratio, GMR) is used for the stop for futility/efficacy decision and the final analysis at the end of phase 3 stage. To demonstrate the non-inferiority of the experimental vaccine with respect to a control vaccine, we wish to test the null hypothesis H0: for at least one k, against the one-sided alternatives H1:
for all k, where δ represents the pre-specified non-inferiority margin. In testing the preceding hypotheses, the null hypothesis H0 is rejected if and only if all of the null hypotheses associated with each of the K CPE are rejected at a one-sided significance level of α.
We assume that higher dose result in higher immunogenicity response and higher toxicity. Thus, for the middle dose experimental group, the loge transformed post-vaccination immunogenicity responses of each valent in is denoted as 0.2 lower than the high dose, with a toxicity rate 0.6% lower. Similarly, the loge transformed post-vaccination immunogenicity responses for the low dose is marked as 0.4 lower than the high dose, with a toxicity rate 1.2% lower. To evaluate type I error rate, it is set that for all K endpoints (m = 1, … , M; k = 1, … , K). The correlation among endpoints is denoted by
= (0, 0.3, 0.6) (k = 1, … , K, k′ = 1, … , K, k
k′), representing three scenarios: endpoints being independent, moderate correlated, and highly correlated. On the contrary, to access type II error rate, a series of scenarios were generated that meet the requirement of
for all k, based on effect sizes observed in actual clinical studies, with the scaling factor r represented as r = Exp(μsim)/Exp(μreal), indicating the ratio of simulated immunogenic response values for the high-dose group to the true values derived from the 9-valent HPV trial. When r < 1, the effect of the experimental vaccine is not as good as that of the real study; when r = 1, true responses are used for parameter setting; and r> 1 indicates that the effect of the experimental vaccine is better than that of the real study. The immunogenicity response of the control vaccine is fixed. Besides, we assume that the white space between phases 2 and 3 was six months. It took ten months from the first patient-in to the end of the phase 2 stage, and the duration of that of phase 3 stage was 12 months. Under each scenario 10,000 simulated trials were conducted. For more details of the simulation study, see the Appendix.
2.3. Performance metrics
For each of the scenarios, we calculated the following metrics, where indicators (a)–(d) apply to all Cases, and indicator (e) applies only to Cases 1 and 2.
(a) Power and type I error rate
Power is defined as the percentage of simulated trials that rejected the null hypothesis and concluded that the vaccine is effective when the vaccine actually is effective. Type I error rate is defined as the percentage of simulated trials that rejected the null hypothesis and concluded that the vaccine is effective when the vaccine actually is ineffective.
(b) Average sample size
The average sample size over 10,000 simulation trials.
(c) Trial duration
The average trial duration over 10,000 simulation trials.
(d) Percentage of early stop
The percentage of simulated trials be stopped early for toxicity, futility or efficacy. The first one is denoted as percentage of toxicity stop (TFS), the second is denoted as percentage of futility stop (PFS) and the last one is denoted as percentage of efficacy stop (PES).
(e) Percentage of correct dose selection
The percentage of correct dose selection is defined as the percentage of simulated trials where the optimal dose is correctly selected at the end of phase 2 and evaluated in phase 3.
3. Results
This study evaluated several key indicators. When it was assumed that the null hypothesis H0 held, the focus was on the Type I error rate, average sample size, duration of the trial, and the proportion of early stops, detailed in . Conversely, when the null hypothesis H0 was not assumed to hold, assessments included the overall power, average sample size, trial duration, the proportion of early stops, and the frequency of correct dose selection, which were illustrated in .
Figure 2. Performance of seamless design compared to conventional design for case 1 in terms of (a) Overall power, (b) Average sample size and (c) Trial duration when the null hypothesis is false.
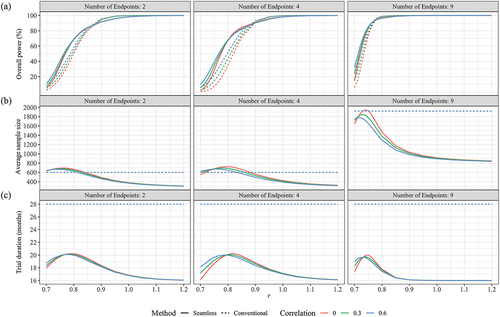
Figure 3. Performance of seamless design for Case 1 in terms of (a) Early stop percentages, (b) Correct dose selection when the null hypothesis is false.
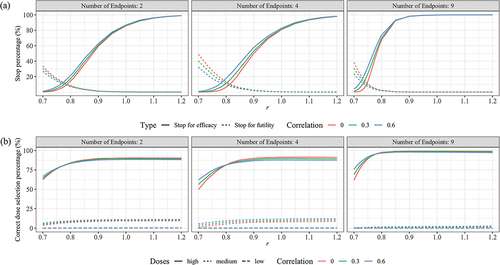
Figure 4. Performance of seamless design compared to conventional design for Case 2 in terms of (a) Overall power, (b) Average sample size and (c) trial duration when the null hypothesis is false.
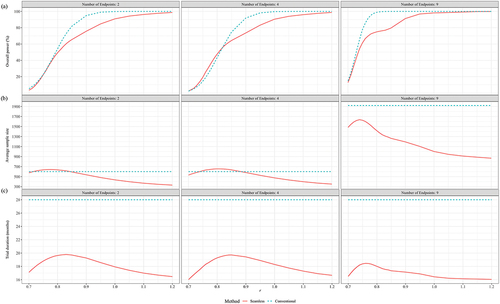
Figure 5. Performance of seamless design for Case 2 in terms of (a) Early stop percentages, (b) Correct dose selection when the null hypothesis is false.
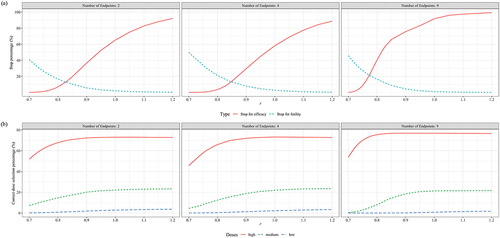
Figure 6. Performance of seamless design compared to conventional design for case 3 in terms of (a) Overall power, (b) Average sample size, (c) Trial duration and (d) Early stop percentages when the null hypothesis is false.
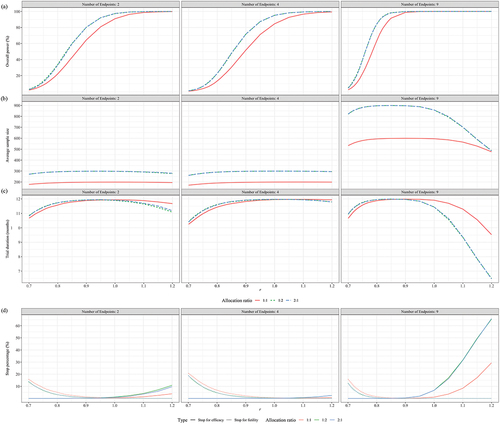
Table 1. Performance of seamless and conventional designs for Case 1 when the null hypothesis is true.
Table 2. Performance of seamless and conventional designs for Case 2 when the null hypothesis is true.
Table 3. Performance of two-stage and conventional designs for Case 3 when the null hypothesis is true.
3.1. Comparative performance of seamless and conventional designs in case 1
presented the performance of seamless and conventional designs under various indicators when the null hypothesis H0 was true. It was observed that both designs managed to keep the Type I error rate below the 2.5% level across different scenarios. When there are two CPEs, the seamless design, despite using a larger average sample size than the conventional design across various correlation scenarios, consistently achieved an early stop for futility rate of 23.88% or higher and reduced the trial duration by at least 8.88 months. When the number of endpoints increased to four, the seamless design further decreased the sample size required, increased the rate of early stops, and shortened the trial duration in comparison with the conventional design. As the endpoints rose to nine, taking the scenario with zero correlation as an example, the seamless design demonstrated a 94.85% probability of correctly stopping an ineffective trial early, saving an average of 1232.5 samples and reducing the trial duration by 17.38 months compared to the conventional design. Comparing across different correlation scenarios, the seamless design performed best when the endpoints were independent, particularly in comparison to the scenario with an endpoint correlation of 0.6.
presented the performance of seamless design with respect to the conventional design under various scenarios when the GMT responses in the high dose group were non-inferior to those in the control group. It is worth noting that the seamless design performs better in terms of overall power compared with conventional design when r, the ratio between simulated GMT and real GMT values derived from the 9-valent HPV trial, was less than 0.85 (2 CPEs), 0.85 (4 CPEs) or 0.76 (9 CPEs). This trend was most pronounced when the endpoints were independent of each other (ρ = 0). For example, when r was equal to 0.83 (2 CPEs), 0.84 (4 CPEs) and 0.75 (9 CPEs), the overall power of the conventional design was 64.67%, 70.74% and 73.10%, respectively, whereas the seamless design achieved over 80% overall power. When the experimental vaccine had a good efficacy (r 0.9), both designs achieved over 90% overall power. Regarding the impact of correlation on overall power, revealed a gap in overall power between
= 0 and
= 0.6, specifically, the difference in overall power between scenarios with
= 0.6 and
= 0 for seamless trials with 2, 4, and 9 CPEs did not exceed 7.47% (r = 0.73), 12.19% (r = 0.73) and 16.03% (r = 0.70), respectively. When r was greater than 0.76 (
= 0), 0.78 (
= 0.3) and 0.74 (
= 0.6), the difference in overall power was less than 5%, indicating that the impact of correlation on overall power was negligible.
In all scenarios, the average sample size (ASS) of the conventional design was fixed at 600 (2 CPEs), 600 (4 CPEs), and 1920 (9 CPEs). In contrast, the ASS for the seamless design was dynamically adjusted based on the results of the interim analysis. clearly demonstrated that as the scaling factor r increased, the ASS for the seamless design initially rose before decreasing. This pattern was similar across scenarios with an equal number of endpoints, regardless of the correlation between the endpoints. For instance, in scenarios where the endpoints were independent, the maximum ASS consumed by the seamless design were 695.72 for 2 CPEs (r = 0.76), 722.30 for 4 CPEs (r = 0.80) and 1945.29 for 9 CPEs (r = 0.74), with corresponding overall powers of 43.82% (2 CPEs), 67.55% (4 CPEs) and 75.02% (9 CPEs). Although these results did not meet our expectations, they were still higher than the 23.90% (2 CPEs), 35.24% (4 CPEs) and 58.72% (9 CPEs) achieved by the conventional design. Futhermore, when r exceeded 0.85 (2 CPEs), 0.90 (4 CPEs) and 0.76 (9 CPEs), trials employing the seamless design were able to save more samples while maintaining comparable overall power. For example, when the actual GMT levels (r = 1) were used in the simulation study, on average, saved 1004.99 subjects compared to conventional design.
presented the expected trial duration across different scenarios when the experimental vaccine was effective. In the conventional design, the durations of phase 2, phase 3, and the interim period between these phases were fixed, cumulating to a total trial duration of 28 months. However, the seamless design demonstrated a distinct advantage in reducing trial duration. Particularly when r ≥ 1.0, the seamless design trials achieved a reduction in duration of at least 11.16 (2 CPEs), 10.88 (4 CPEs), or 11.99 (9 CPEs) months compared to conventionally designed trials.
depicted the performance of the seamless design in terms of the percentage of stops at each scenario when the experimental vaccine was effective. Notably, the PFS dropped below 5% when the scaling factor r reached 0.84 for 2 CPEs, 0.90 for 4 CPEs, and 0.78 for 9 CPEs. Additionally, the PES exceeded 50% when r attained values of 0.90 for both 2 and 4 CPEs, and 0.79 for 9 CPEs.
presented the percentage of CDS for each scenario when the null hypothesis is false. The CDS percentage reached 83.31% (2 CPEs), 81.23%(4 CPEs) and 96.63% (9 CPEs) or higher when r was greater than or equal to 0.8.
3.2. Comparative performance of seamless and conventional designs in case 2
illustrated the performance metrics under scenarios where the null hypothesis H0 was true and the common correlation of 0.3 among endpoints was considered. Both the seamless design with added safety stopping rules and the conventional design managed to keep the Type I error rate below 2.5%. Trends observed under this Case mirrored those in Case 1, showing that when the TSP was at or below 0.04%, the seamless design typically achieved a PFS of at least 30.83% and reduced the trial duration by at least 9.71 months. The advantage of using the seamless design was most pronounced in scenarios with 9 endpoints compared to those with only 2 endpoints.
depicted the performance metrics under the assumption that the alternative hypothesis H1 was true, again considering only a common correlation of 0.3, and including the additional safety stopping rules. With 2 and 4 endpoints, the probabilities of the low, medium, and high dose groups being excluded due to toxicity were 1.81%, 8.80%, and 19.24%, respectively, with a 0.04% chance of all doses being excluded. With 9 endpoints, these probabilities were 0.47%, 6.24%, and 22.24%, respectively, with a 0.01% chance of all doses being excluded. The additional safety stopping rule resulted in the high-dose group, theoretically the most effective and toxic, having a probability of being excluded of not less than 19.24%, leading to a further loss in overall power. From , it is evident that although the seamless design could still ensure an overall power above 90% when r was greater than or equal to 1, it had similar or lower overall power compared to the conventional design, with the maximum difference reaching 19.22% (r = 0.9, 2 CPEs), 18.32% (r = 0.9, 4 CPEs), and 23.99% (r = 0.8, 9 CPEs). concluded that in terms of ASS and trial duration, the seamless design exhibited the flexibility to adjust sample size based on information collected at interim analysis, thus shortening the trial duration and maintaining superiority over the conventional design. This advantage was marked in trials with 9 CPEs, where, when the actual GMT levels (r = 1) were used in the simulation study, the seamless design saved 917.97 subjects on average compared to the conventional design. Even at r = 0.74, the seamless design still saved a minimum of 283.22 subjects relative to the conventional approach.
showed the performance of the seamless design in terms of the percentage of early stops when the alternative hypothesis H1 was true, considering only a common correlation of 0.3, with the added safety stopping rule. Compared to Case 1 without the safety stopping rule, the seamless design used in Case 2 had a higher probability of incorrectly stopping trials early for futility and a lower probability of correctly stopping early for efficacy. The PFS in the seamless design dropped below 5% when r reached or exceeded 0.95 (for 2 CPEs), 0.95 (for 4 CPEs), and 0.9 (for 9 CPEs). The PES surpassed 50% when r reached 0.95 (for 2 CPEs), 1 (for 4 CPEs), and 0.82 (for 9 CPEs).
displayed the CDS percentage for each scenario. Similarly, affected by the safety stopping rule, the proportion of CDS in Case 2 was lower than that in Case 1. Specifically, at r = 0.8, the CDS percentage was only 67.75% (for 2 CPEs), 65.92% (for 4 CPEs), and 75.42% (for 9 CPEs).
3.3. Comparative performance of two-stage and conventional designs in case 3
presented the performance of a two-stage phase 3 design compared to a conventional design across various metrics, under the scenario where the trial vaccine was ineffective and only = 0.3 was considered. Both approaches maintained the Type I error rate below 2.5% across all scenarios. It was observed that the sample size ratio between the experimental and control groups had a minimal impact on the trial duration, PES, and PFS. The ASS was quite similar under the two opposite allocation ratios of 2:1 and 1:2. Compared to the conventional design, the two-stage design had probabilities of correctly stopping ineffective trials at interim analysis not less than 26.71% (2 CPEs), 41.56% (4 CPEs), and 62.17% (9 CPEs); it saved at least 39.02 (2 CPEs), 58.95 (4 CPEs), and 261.11 (9 CPEs) subjects; and reduced the trial duration by 2.24 (2 CPEs), 3.49 (4 CPEs), and 5.22 (9 CPEs) months.
The difference in overall power between the conventional design and the two-stage design across all scenarios did not exceed ± 2%. To prevent the overlapping of lines due to highly similar results, only showed the performance of the two-stage design when the experimental vaccine was effective, considering the scenario with = 0.3. revealed that the performance was similar for both a 2:1 and a 1:2 sample size ratio between the experimental and control groups concerning overall power, ASS, trial duration, and the probability of early stopping. Further observation showed that, compared to a 1:1 sample size ratio, the unbalanced allocation ratios corresponded to higher overall power (), higher ASS used (), and shorter trial duration when the efficacy of the experimental vaccine was better than expected (r > 1) (). The difference brought about by the unbalanced allocation of sample size was most pronounced in trials with 9 CPEs as compared to those with 2 or 4 CPEs.
For the conventional design, when the number of endpoints was 2 and 4, the total sample size consumed was fixed at 300, 200, and 300 for sample size ratios of 2:1, 1:1, and 1:2, respectively; when the number of endpoints was 9, the total sample size consumed was fixed at 900, 600, and 900 for the respective ratios. The sample size consumed by the two-stage design was slightly lower than that of the conventional design across all scenarios.
Regarding trial duration for the conventional design, it was fixed at 12 months. The average trial duration of the two-stage design was consistently lower than that of the traditional design across all scenarios. When there were 9 CPEs and the anticipated efficacy of the trial vaccine was better (r = 1.2), the two-stage design could reduce the trial duration by up to 5.53 months (sample size ratio of 2:1) compared to the conventional design.
4. Discussion
Seamless phase 2/3 design has been developed as an alternative to conventional design by combining both the dose selection and confirmation phases into one trial. By using seamless designs, the trial duration could be reduced by skipping the long pause between phase 2 and phase 3 and sample size could be saved by early stopping. There has been considerable interest in seamless design that focus on trials with a single endpoint [Citation20,Citation21], or trials with 2 or 3 CPE [Citation22–24]. However, the performance of seamless designs in multi-valent vaccine trials with multiple CPE can be influenced by many factors, such as the variation of effect size among endpoints, number of endpoints, and correlation among endpoints. Whether seamless design can offer substantial benefits for the development of vaccine with multiple CPEs remains a question. To address this, we introduced a seamless phase 2/3 design suitable for trials with CPEs (Case 1), which allows for early futility stopping decisions and sample size re-estimation at the end of phase 2, as well as early efficacy stopping decisions during phase 3. Furthermore, we explored how to carry out a seamless design considering both safety and efficacy (Case 2). Lastly, the investigation centered on the phase 3 phase, examining the performance of group sequential in interim analysis with even and uneven sample size allocations (Case 3).
A series of simulations were conducted referencing an actual 9-valent HPV vaccine trial. The results from Case 1 suggest that seamless designs are particularly appealing in trials with multiple CPEs, as they allow for early stopping due to futility or efficacy, with a timely re-estimation of sample sizes based on phase 2 data, and reduce the overall duration while controlling the type I error rates. The appeal of seamless designs increases with the number of endpoints and decreases with the correlation among endpoints. The results from Case 2 indicate that when the safety endpoint is considered alongside efficacy, some dose groups may be eliminated due to excessive toxicity. Compared to a seamless design that did not take safety into account, the design used in Case 2 maintains good performance in terms of early futility stopping and trial duration when the experimental vaccine is ineffective. Conversely, when the vaccine is effective, this design offers the flexibility by increasing or decreasing the sample size based on the effect size of subsequent doses. While Case 2 simulations indicate higher overall power for the conventional design versus the seamless design, this should not suggest the conventional design’s superiority. This conclusion assumes the conventional design’s phase 2 relies exclusively on efficacy for dose selection, disregarding safety. However, if the conventional design were to integrate safety considerations, toxic doses might be eliminated, potentially diminishing its overall power. Lastly, the findings from Case 3 reveal that multi-stage phase 3 study employing a group sequential approach perform well under both balanced and unbalanced sample size allocations. Based on these findings, we advocate for the use of seamless designs in phase 2 and phase 3 trials for multivalent vaccines.
Concerns may exist regarding type II error rate and the resultant sample size inflation for trials with multiple CPEs, as highlighted in literatures [Citation25–27]. In our study, the conditional power that the non-inferiority hypothesis will be met if the study continues is calculated for each endpoint at the end of phase 2 part. Then, the minimum CP is selected for the calculation of sample size required for the next stage. Our results show that the loss of overall power due to CPEs is acceptable. One possible explanation is that the endpoints are widely differed in effect size and variability in the real world. The family-wise type II error rate for the whole study will be controlled if the type II error rate for the one endpoint that is least likely to success were controlled. Our approach is consistent with the guidance for the evaluation of combination vaccines for preventable diseases published by the Center for Drug Evaluation and Research [Citation28], which recommends that the sample size required for each endpoint should be calculated separately and the largest sample size should be selected as the sample size for the overall trial. It should also be highlighted that for innovative vaccines or platforms, regulatory agencies typically require a minimum number of 3,000 subjects for the experimental group [Citation29]. In such contexts, the application of seamless design may be somewhat constrained. When the experimental vaccine is ineffective, seamless design can still expedite the saving of research time and resources through early futility stopping. However, when the experimental vaccine is effective, in order to meet the sample size requirements of regulatory authorities, the seamless design may have to compromise some of its flexibility in sample size adjustment and early stop for efficacy.
Another major concern of the regulatory agencies in developing seamless phase 2/3 design is whether type I error rate can be controlled [Citation30]. Theoretically, both the re-estimation of sample size and interim decisions on efficacy could lead to inflation of type I error. To prevent such inflation, two steps were taken in our study. The first step was to use combination test, whereby accumulated information was combined using a weighted inverse normal method at each look. The second step was to calculate the efficacy stopping boundaries using the O’Brien-Fleming type alpha spending function, which set a high standard for statistical significance early in the trial, providing a conservative testing strategy while maintaining the type I error rate. Additionally, according to the findings of Chang’s research [Citation31], the stopping boundaries of group sequential design for a trial with CPEs are the same for a trial with a single endpoint, since this design is alpha-exhaustive.
One of the primary appeals of seamless phase 2/3 design is its ability to skip the white space between phase 2 and phase 3 stages, thereby reducing the overall trial duration. Our findings in Case 1 for trials with 9 CPEs show that when the experimental group is effective (r = 1), the total duration of the seamless design can be reduced to 42.82% of that of the conventional design. In contrast, when the vaccine is ineffective, the seamless design, on average, shortens the trial’s overall duration to 53.25% of the conventional design. However, as the correlation between endpoints increases, the duration required for the seamless design extends, albeit still shorter than the conventional design. Asakura et al. use the group sequential futility boundary adjusted by the correlations to evaluate a joint effect on two CPEs [Citation32]. In trials with multiple CPEs, further work is required to refine seamless design methods for futility stopping decisions based on conditional power. The study’s conclusions, while based on certain assumptions, simplify the intricacies of real-world trials whose durations are influenced by various factors. For example, multicenter trials across various countries might require less time. Sensitivity analysis, using Case 1 as a reference, was conducted to determine how such conditions affect seamless design. Detailed in the appendix, the results indicate that seamless design consistently shortens trial duration by 42.79% when effective and 56.71% when not, relative to conventional methods. This underscores the time efficiency of seamless designs even when conventional designs are expedited. Naturally, this conclusion is predicated on the seamless execution of the seamless design, while, as suggested by Maca et al. [Citation33], there may not be much time savings for seamless design compared to conventional design unless the phase 3 stage is initiated quickly after the phase 2 part.
This study focuses on the performance of seamless phase 2/3 designs that utilize multiple continuous outcomes as CPEs. The methodologies employed in this research are adaptable to a broader range of scenarios. Building on this foundation to include phase 1 clinical trial could significantly enhance the rapid development of vaccines, particularly in the context of a pandemic. Reflecting on lessons from the COVID-19 pandemic, the Coalition for Epidemic Preparedness Innovations has advocated for a ‘100-day mission’ [Citation34], aiming to develop and initiate production of a viable vaccine within 100 days following the identification of a potentially pandemic pathogen. The insights gleaned from this study are instrumental in advancing this objective. Future research will focus on how to effectively incorporate phase I clinical trials into this accelerated framework, aiming to streamline and optimize the vaccine development process further.
5. Conclusion
In summary, the use of seamless design in trials with multiple CPEs is very attractive because of its flexibility and effectiveness in stopping the trial early for efficacy or futility, re-estimation the sample size based on information accumulated at interim analysis and shortening overall duration while maintaining a relatively small type I error rate.
Declaration of interest
The authors have no relevant affiliations or financial involvement with any organization or entity with a financial interest in or financial conflict with the subject matter or materials discussed in the manuscript. This includes employment, consultancies, honoraria, stock ownership or options, expert testimony, grants or patents received or pending, or royalties.
Reviewer disclosures
Peer reviewers on this manuscript have no relevant financial or other relationships to disclose.
Author contribution statement
All authors have made substantial contributions to the conception and design of this article. All authors contributed to the writing of the manuscript and have critically revised the work for important intellectual content. All authors have approved the final version of the manuscript and agree to be accountable for all aspects of the work in ensuring that questions related to the accuracy or integrity of any part of the work are appropriately investigated and resolved.
Supplemental Material
Download Zip (291.6 KB)Supplementary material
Supplemental data for this article can be accessed online at https://doi.org/10.1080/14760584.2024.2348612.
Additional information
Funding
References
- Mostafavi E, Eybpoosh S, Karamouzian M, et al. Efficacy and safety of a protein-based SARS-CoV-2 vaccine: a randomized clinical trial. JAMA Netw Open. 2023;6(5):e2310302–e2310302. doi: 10.1001/jamanetworkopen.2023.10302
- Chalkias S, Whatley JL, Eder F, et al. Original SARS-CoV-2 monovalent and omicron BA. 4/BA. 5 bivalent COVID-19 mRNA vaccines: phase 2/3 trial interim results. Nature Med. 2023;29(9):2325–2333. doi: 10.1038/s41591-023-02517-y
- Polack FP, Thomas SJ, Kitchin N, et al. Safety and efficacy of the BNT162b2 mRNA COVID-19 vaccine. N Engl J Med. 2020;383(27):2603–2615. doi: 10.1056/NEJMoa2034577
- Jiang L, Yuan Y. Seamless phase II/III design: a useful strategy to reduce the sample size for dose optimization. JNCI. 2023;115(9):1092–1098. doi: 10.1093/jnci/djad103
- U.S. Food & Drug Administration. Adaptive design clinical trials for drugs and biologics guidance for industry [updated 2019 Nov 29; cited 2023 Sep 12]. Available from: https://www.fda.gov/media/78495/download
- U.S. Food & Drug Administration. Master protocols: efficient clinical trial design strategies to expedite development of oncology drugs and biologics guidance for industry [updated 2022 Mar 1; cited 2023 Sep 13]. Available from: https://www.fda.gov/media/120721/download
- Ellenberg S, Eisenberger M. An efficient design for phase III studies of combination chemotherapies. Cancer Treat Rep. 1985;69(10):1147–1152.
- Thall P, Simon R, Ellenberg S. Two-stage selection and testing designs for comparative clinical trials. Biometrika. 1988;75(2):303–310. doi: 10.1093/biomet/75.2.303
- Schaid DJ, Wieand S, Therneau TM. Optimal two-stage screening designs for survival comparisons. Biometrika. 1990;77(3):507–513. doi: 10.1093/biomet/77.3.507
- Bauer P, Kieser M. Combining different phases in the development of medical treatments within a single trial. Statist Med. 1999;18(14):1833–1848. doi: 10.1002/(SICI)1097-0258(19990730)18:14<1833:AID-SIM221>3.0.CO;2-3
- Stallard N, Todd S. Sequential designs for phase III clinical trials incorporating treatment selection. Stat Med. 2003;22(5):689–703. doi: 10.1002/sim.1362
- Liu Q, Pledger GW. Phase 2 and 3 combination designs to accelerate drug development. J Am Stat Assoc. 2005;100(470):493–502. doi: 10.1198/016214504000001790
- Schmidli H, Bretz F, Racine A, et al. Confirmatory seamless phase II/III clinical trials with hypotheses selection at interim: applications and practical considerations. Biom J. 2006;48(4):635–643. doi: 10.1002/bimj.200510231
- U.S. Food & Drug Administration. Multiple endpoints in clinical trials guidance for industry [updated 2022 Oct 20; cited 2023 Sep 15]. Available from: https://www.fda.gov/media/162416/download
- Europen Medicines Agency. Guideline on multiplicity issues in clinical trials [updated 2016 Dec 15; cited 2023 Sep 15]. Available from: https://www.ema.europa.eu/en/documents/scientific-guideline/draft-guideline-multiplicity-issues-clinical-trials_en.pdf
- Castellsagué X, Giuliano AR, Goldstone S, et al. Immunogenicity and safety of the 9-valent HPV vaccine in men. Vaccine. 2015;33(48):6892–6901. doi: 10.1016/j.vaccine.2015.06.088
- Demets DL, Lan KG. Interim analysis: the alpha spending function approach. Stat Med. 1994;13(13‐14):1341–1352. doi: 10.1002/sim.4780131308
- O’Brien PC, Fleming TR. A multiple testing procedure for clinical trials. Biometrics. 1979;35(3):549–556. doi: 10.2307/2530245
- Lan KKG, Demets DL. Discrete sequential boundaries for clinical-trials. Biometrika. 1983;70(3):659–663. doi: 10.2307/2336502
- Cecco S, Muraro E, Giacomin E, et al. Cancer vaccines in phase II/III clinical trials: state of the art and future perspectives. Curr Cancer Drug Targets. 2011;11(1):85–102. doi: 10.2174/156800911793743664
- Rustomjee R, McClain B, Brennan MJ, et al. Designing an adaptive phase II/III trial to evaluate efficacy, safety and immune correlates of new TB vaccines in young adults and adolescents. Tuberculosis. 2013;93(2):136–142. doi: 10.1016/j.tube.2012.11.005
- Zhu FC, Chen W, Hu YM, et al. Efficacy, immunogenicity and safety of the HPV-16/18 AS04-adjuvanted vaccine in healthy Chinese women aged 18–25 years: results from a randomized controlled trial. Int J Cancer. 2014;135(11):2612–2622. doi: 10.1002/ijc.28897
- Duong TN, Thiem VD, Anh DD, et al. A phase 2/3 double blinded, randomized, placebo-controlled study in healthy adult participants in Vietnam to examine the safety and immunogenicity of an inactivated whole virion, alum adjuvanted, A(H5N1) influenza vaccine (IVACFLU-A/H5N1). Vaccine. 2020;38(6):1541–1550. doi: 10.1016/j.vaccine.2019.11.059
- Zhu FC, Hu SY, Hong Y, et al. Efficacy, immunogenicity and safety of the AS04‐HPV‐16/18 vaccine in Chinese women aged 18‐25 years: end‐of‐study results from a phase II/III, randomised, controlled trial. Cancer Med. 2019;8(14):6195–6211. doi: 10.1002/cam4.2399
- Offen W, Chuang-Stein C, Dmitrienko A, et al. Multiple co-primary endpoints: medical and statistical solutions: a report from the multiple endpoints expert team of the pharmaceutical research and manufacturers of America. Drug Inf J. 2007;41(1):31–46. doi: 10.1177/009286150704100105
- Sozu T, Sugimoto T, Hamasaki T, et al. Sample size determination in clinical trials with multiple endpoints. New York (NY): Springer; 2015.
- Xiong C, Yu K, Gao F, et al. Power and sample size for clinical trials when efficacy is required in multiple endpoints: application to an Alzheimer’s treatment trial. Clin Trial. 2005;2(5):387–393. doi: 10.1191/1740774505cn112oa
- U.S. Food & Drug Administration. Guidance for industry for the evaluation of combination vaccines for preventable diseases: production, testing and clinical studies [updated 1997 Apr 1; cited 2023 Sep 20]. Available from: https://www.fda.gov/media/77191/download
- Europen Medicines Agency. Guideline on influenza vaccines: non-clinical and clinical module [updated 2016 Jul 21; cited 2024 Mar 20]. Available from: https://www.ema.europa.eu/en/documents/scientific-guideline/influenza-vaccines-non-clinical-and-clinical-module_en.pdf
- Cerqueira FP, Jesus AMC, Cotrim MD. Adaptive design: a review of the technical, statistical, and regulatory aspects of implementation in a clinical trial. Ther Innov Regul Sci. 2019;54(1):246–254. doi: 10.1007/s43441-019-00052-y
- Chang M. Adaptive design theory and implementation using SAS and R. Boca Raton, Florida: Chapman and Hall/CRC; 2014.
- Asakura K, Hamasaki T, Evans SR. Interim evaluation of efficacy or futility in group-sequential trials with multiple co-primary endpoints. Biom J. 2017;59(4):703–731. doi: 10.1002/bimj.201600026
- Maca J, Dragalin V, Gallo P. Adaptive clinical trials: overview of phase III designs and challenges. Ther Innov Regul Sci. 2014;48(1):31–40. doi: 10.1177/2168479013507436
- Gouglas D, Christodoulou M, Hatchett R. The 100 days mission—2022 global pandemic preparedness summit. Emerg Infect Dis. 2023;29(3):e221142. doi: 10.3201/eid2903.221142